Blog

  • Forex Expert Advisor – Selecting Which Strategies to Trade With

    Forex Expert Advisor – Selecting Which Strategies to Trade With

    Forex Expert Advisor and it’s creation is the main purpose of the online trading courses in EA Forex Academy

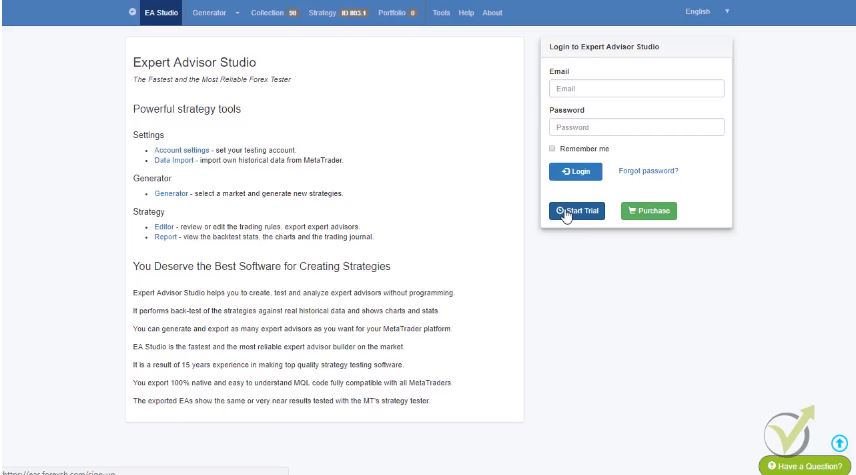
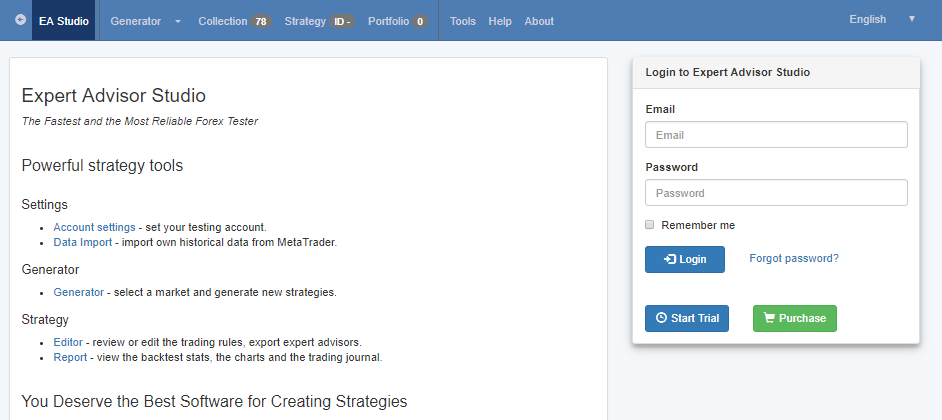
    Forex Expert Advisor selection is the topic of this article, which is part from our course London, New York and Tokyo Algorithmic trading course. It is presenter by Petko Aleksandrov, the Head mentor in the Academy. He has run the reactor in EA Studio which is powerful tool in algorithmic trading to create robust Forex Expert Advisor.

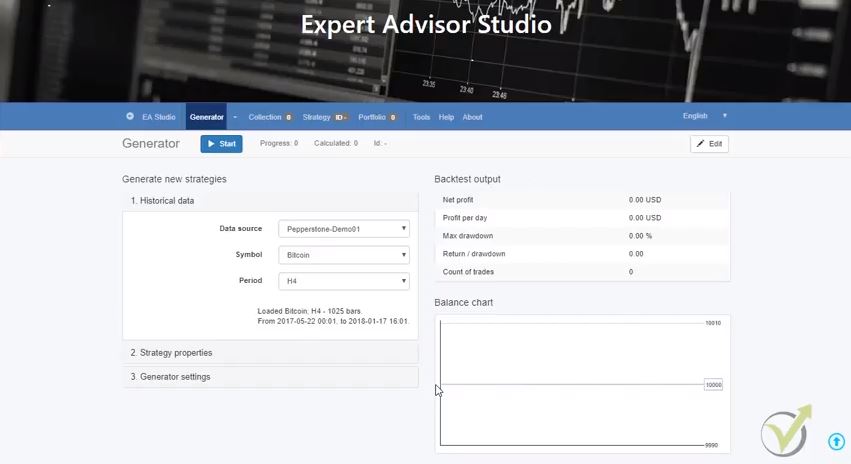
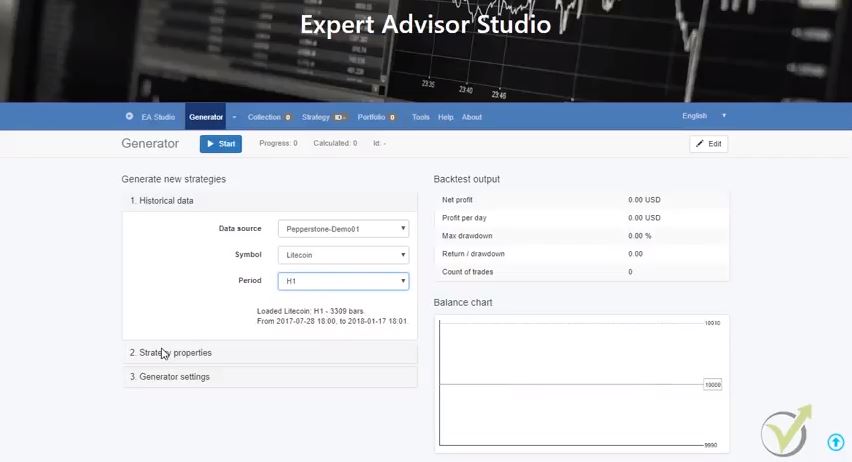
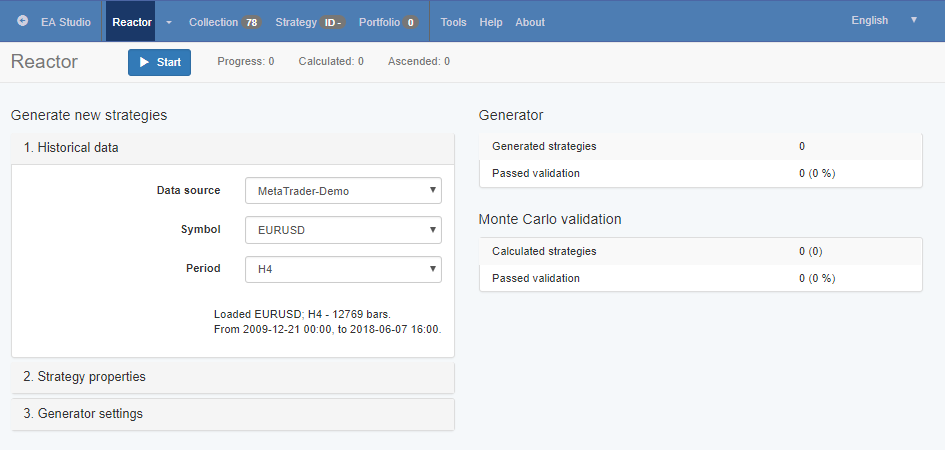
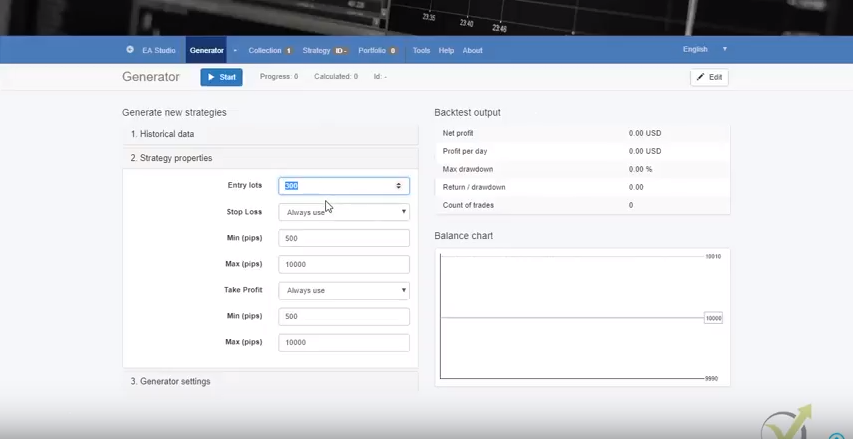
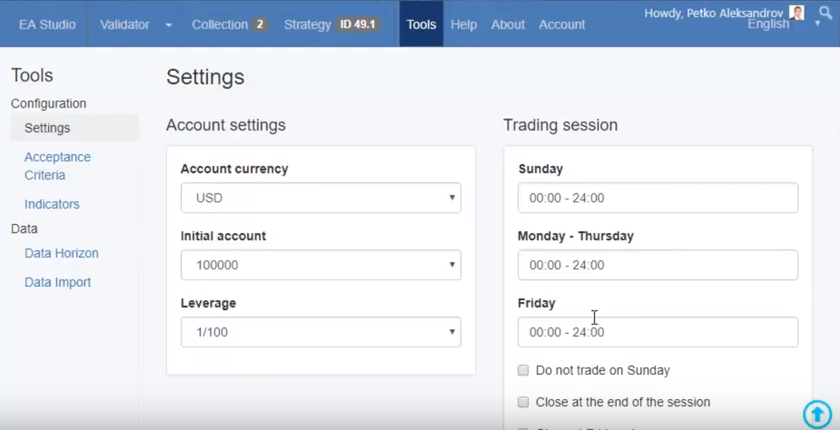
    This is a strategy builder that generates Forex Expert Advisor with predefined rules and conditions over the Historical data of the broker where the trade is going to use the Forex Expert Advisor. Also, the mentor has set trading hours according to the London stock exchange.  This way each Forex Expert Advisor will trade according to these hours. The trade will be opened after the stock exchange is opened. And they will close automatically before the last bell rings. This way the trader catches the volatility. Enjoy the lecture!

    Dear traders, I continue on the next day after

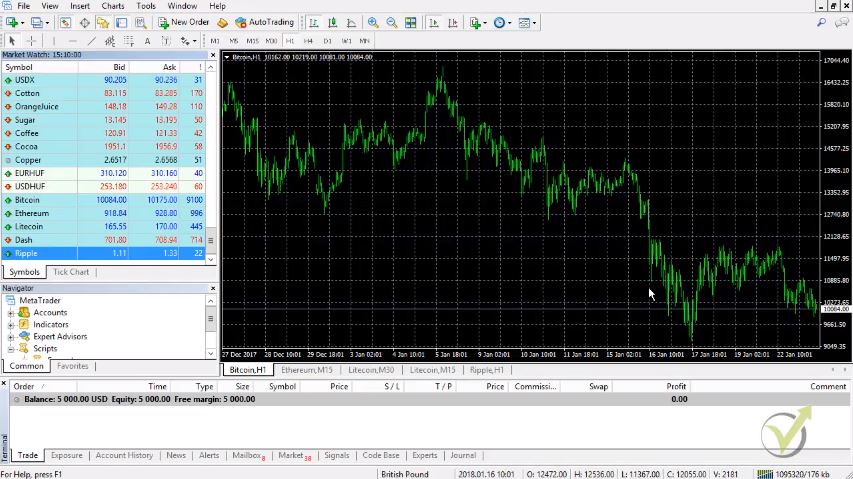
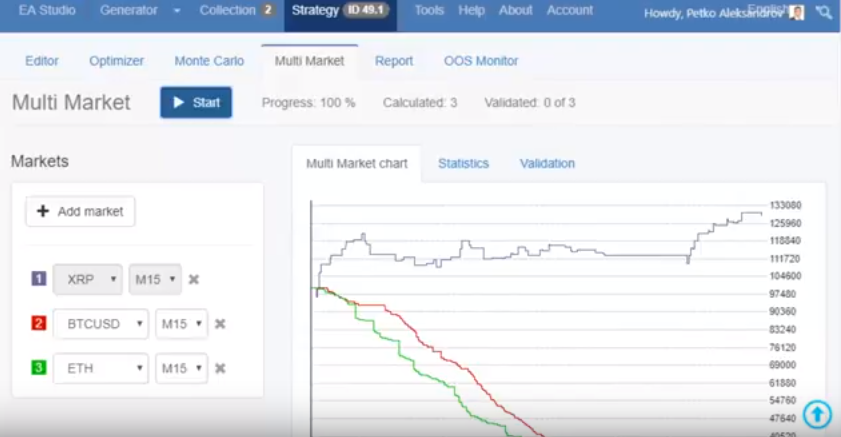
    I have run the reactor for the GBPAUD and for the EURGBP. I have chosen these pairs because they are connected the the London Stock exchange, and each Forex expert advisor will trade on those pairs.

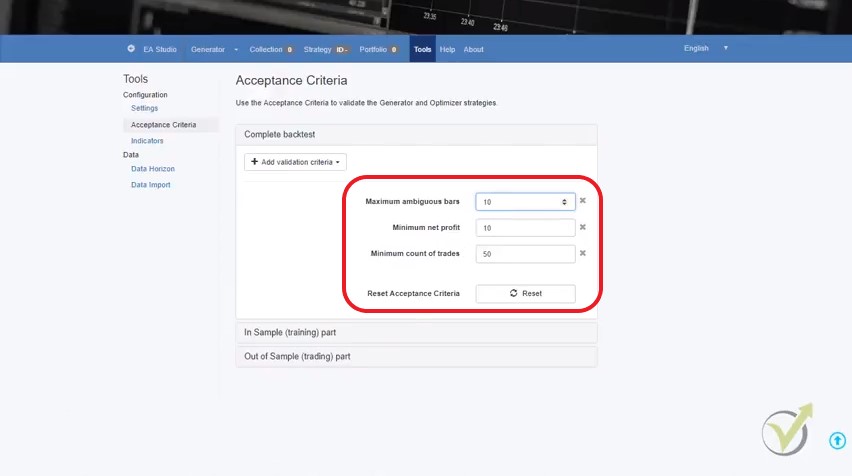
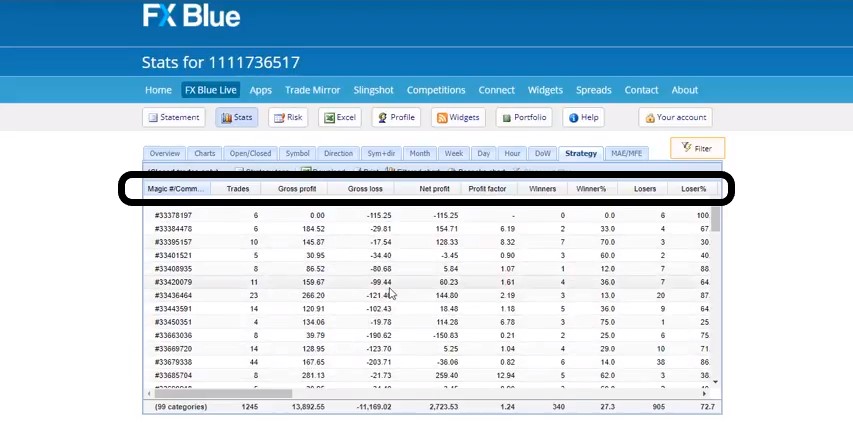
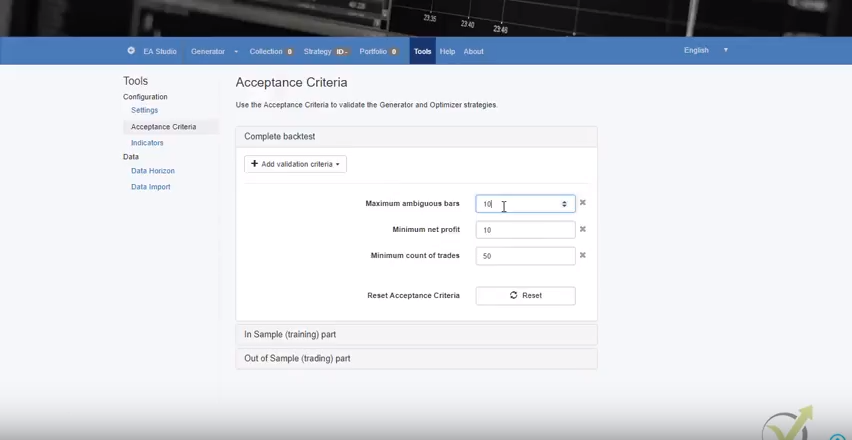
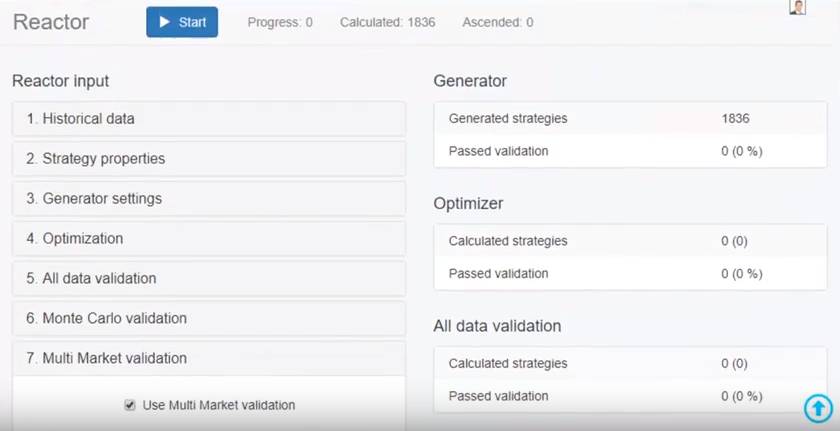
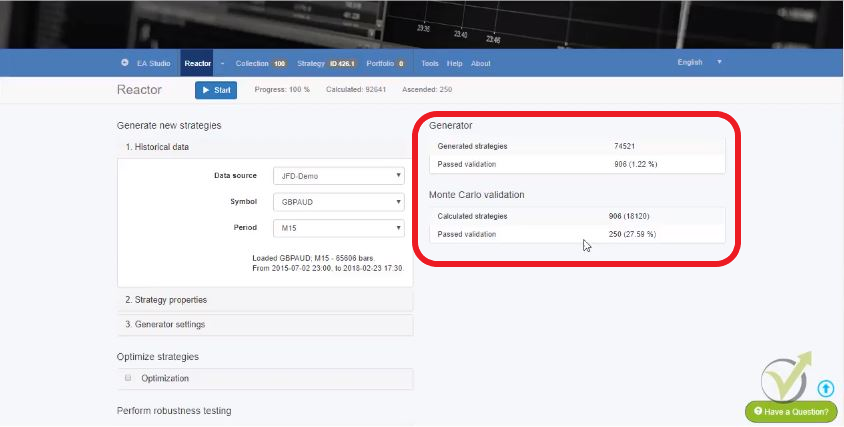
    You can see here that totally 74 521 strategies were generated with the EURGBP. They were actually above 100 000 and from these 74521, 906 past the validation. So, this is the acceptance criteria where we have said. And from these 906 you can see that 250 passed the validation of Monte Carlo.

    Monte Carlo is the robustness test for each Forex Expert Advisor. This way we test the strategy before placing it even on a Demo account. This tool performs different simulations with different spread, historical data, randomize back test starting bar etc, for the Forex Expert Advisor.

    And in the collection I see the top 100. There are 250 but I see the top 100.

    forex expert advisor
    What results do we see after the reactor?

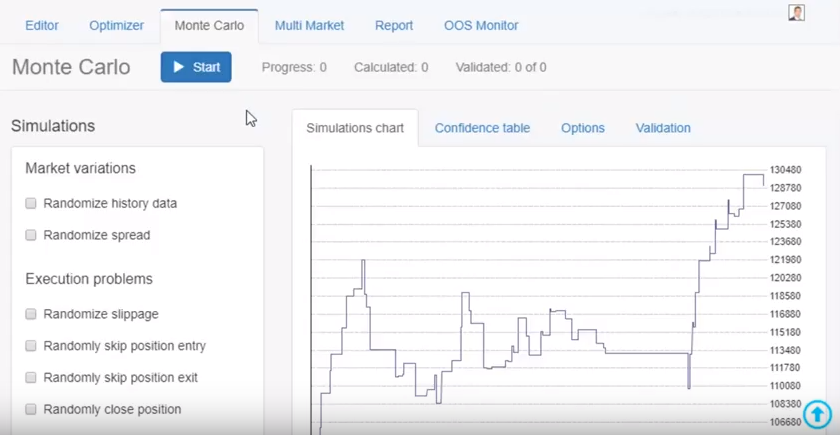
    Let me just click on the first strategy to show you what exactly is the Monte Carlo test, that I have mentioned couple of times. After the strategy is generated it calls automatically to Monte Carlo. And Monte Carlo one more time, this is a simulator which tries to break the strategy. And if I click start you will see that here are the calculated tests, progress and how many of those were validated.

    If you remember I have said 20 tests and I wanted 80% of those to be profitable. You can see with this first strategy that all of the tests actually are profitable. And here are the different simulations you can set up.

    The first one are the market variations for the Forex Expert Advisor – randomize history data, the randomize spread.

    This is very good because the spread normally with the brokers as we said it’s floating. Here one of the simulations is with different spread and with different history data and you can see some more positive, some more negative results, but still profitable results:

    Monte Carlo tests

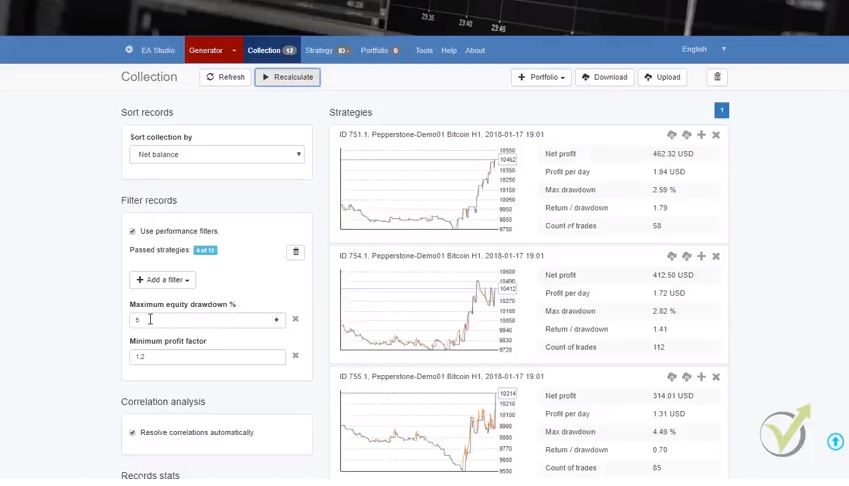
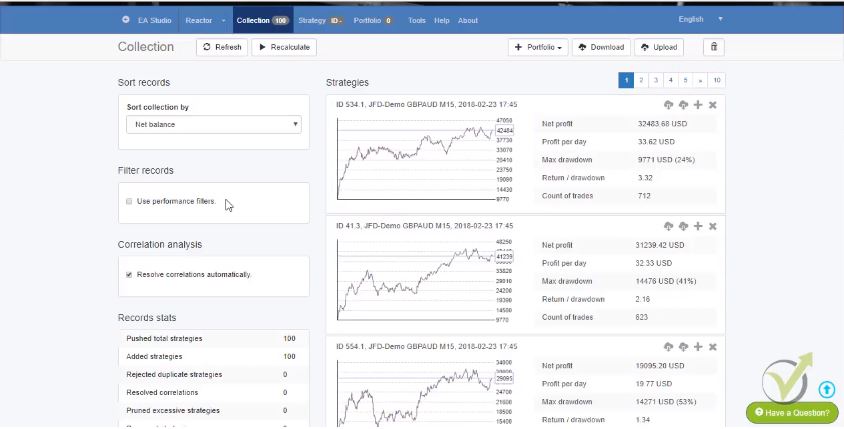
    If you have execution problems with your broker here as well you can choose to use these ticks and strategy variations. You can test the strategy with different parameters. And when I click on the collection again what I will do? I will filter now these 100 strategies with these filter records over here:

    If I select use performance filters you will see here will come another menu from where I can add filters. You see there are many options, let me just go down a little bit.

    Here what I do?

    Forex Expert Advisor collection
    This is how we see the strategies into a collections.

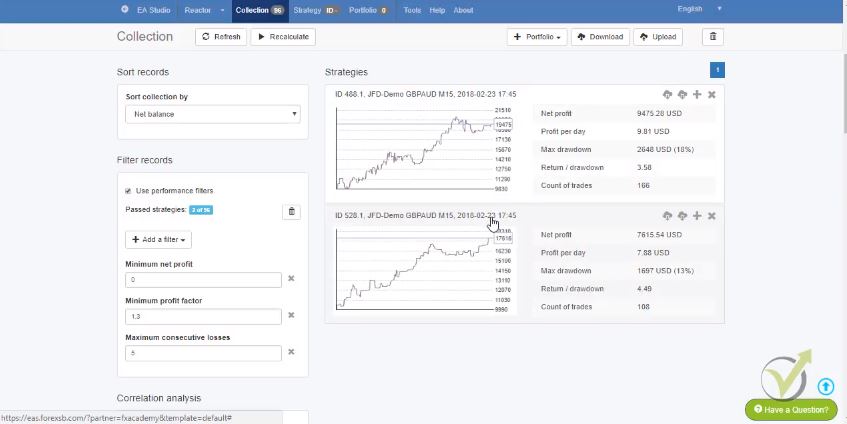
    For example, if I choose a minimum profit factor and I have one, you will see that 100 of the 100 strategy pass the validation. If I increase it to 1.1 you will see that 72 of these 100 pass the validation. Simply, here with this filter we are limiting the number and by using different filters we will leave the top strategies out of the 100. Now, I see 100 because 100 are into the collection. But you see that only 23 out of the 100 passed the validation from the filters. And if I click this button I will remove all the 77 rest strategies (each one is a potential Forex Expert Advisor, but we need to filter them).

    Let me just add another filter. Profit factor is a very good filter. And another good filter that I like to use is the maximum consecutive losses. And now you can see that with 10 maximum consecutive losses still 23 strategies are available. I will reduce 9 and I will go to 8-22. So, they are going down and let’s go to 5. You see only 6 out of the 100 strategies now are left, only these 6 strategies.

    This means that these 6 strategies are having better profit factor than 1.3. And they don’t have more than 5 consecutive losses.

    What are the consecutive losses in a Forex Expert Advisor?

    When having 5 consecutive losses, this means that this Forex Expert Advisor for the whole tested period had no more than 5 losses in a raw. That is a very good statistic!

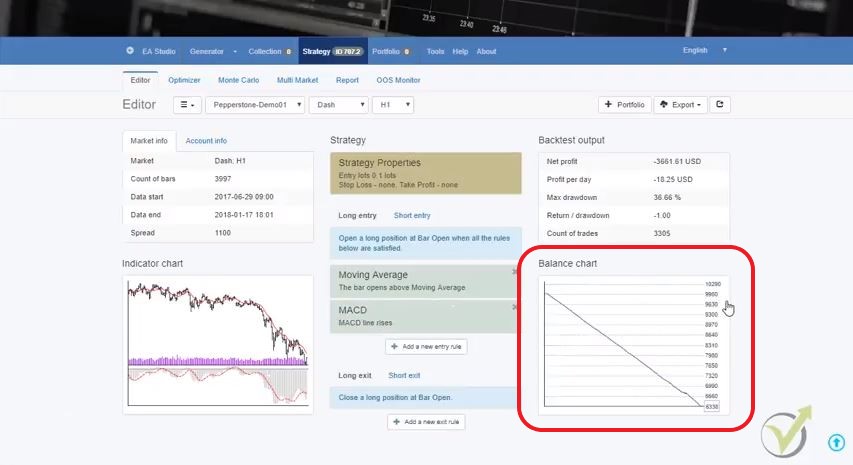
    The other thing here I can add more filters. But what I prefer to do when I have couple of strategies left, is just to look at their profit line. What I see with the first strategy even it makes most profit, is that if there is this huge drawdown over here. And you see the recent days the profit line starts to go down, starts to lose. I will simply remove it from this button over here.

    You see this strategy as well is going down in the middle of the period. And then it’s going just sideways, so I will remove it as well. I have 4 more strategies left, you see that the first strategy here as well has this drawdown, I will remove it.

    These strategies look really nice but I will choose these two. Because the third one recently as well is losing.

    I have these 2 strategies now left into the collection. I will do the very same thing with the other currencies. Because I want to trade totally 12 Forex Expert Advisor. I will choose 2 strategies for each currency. So, you see from 70 000 strategies top 100 were selected then I added more filters. And I have left to with the 2 strategies that passed all the validations and they are having good profit factor and no more than 5 consecutive losses:

    the last two s trategies
    This is how we filter the best EAs

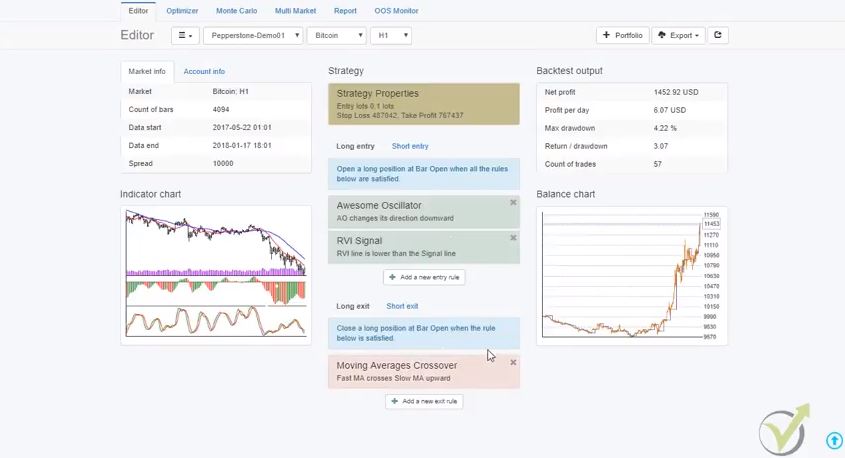
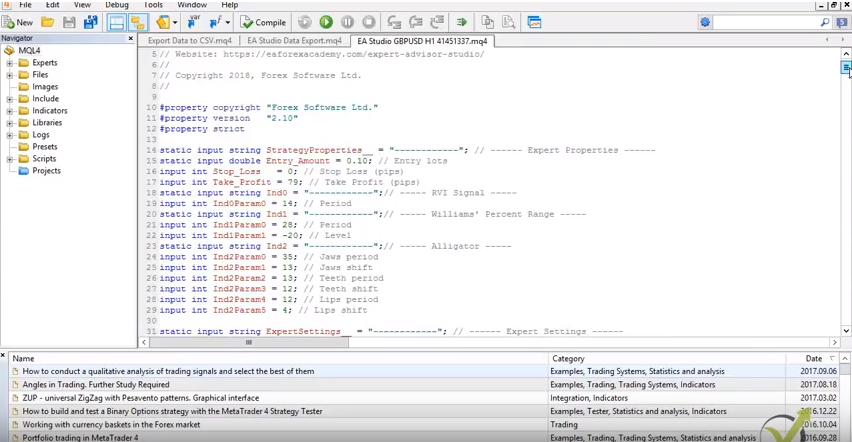
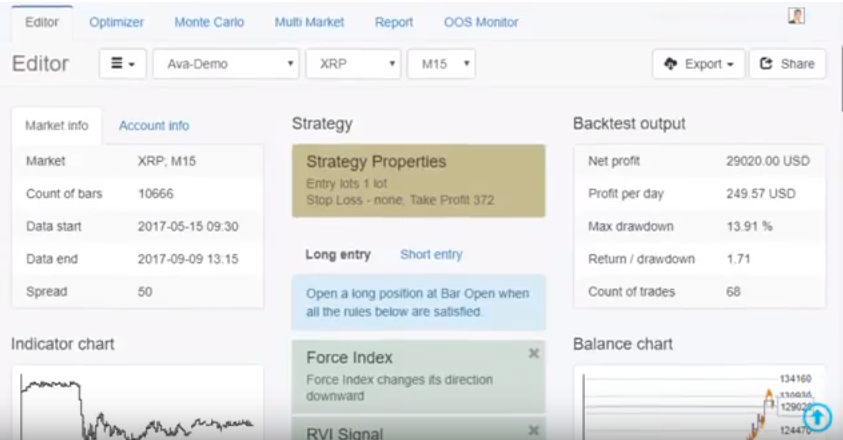
    When I go to this button over here that says Expert Advisor for MT4. And this one that says Expert Advisor for MT5 with one click I can export these strategies as Forex Expert Advisor. This is the very, very nice thing of EA Studio that with one click it exports the strategy as Expert Advisor.

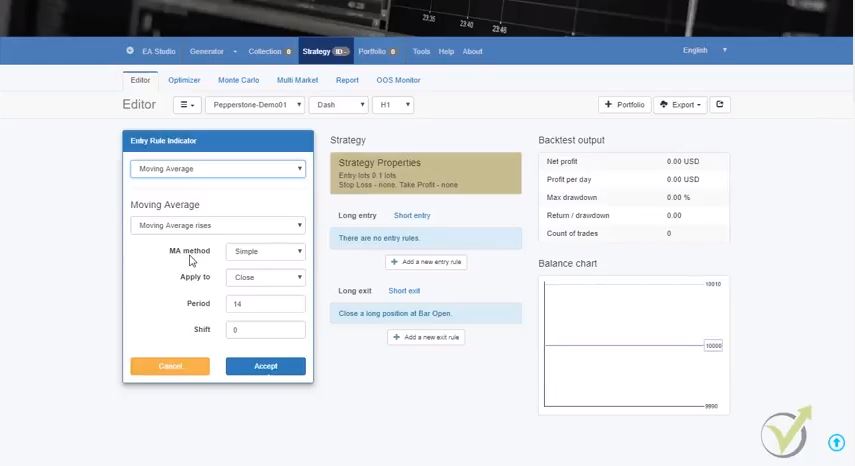
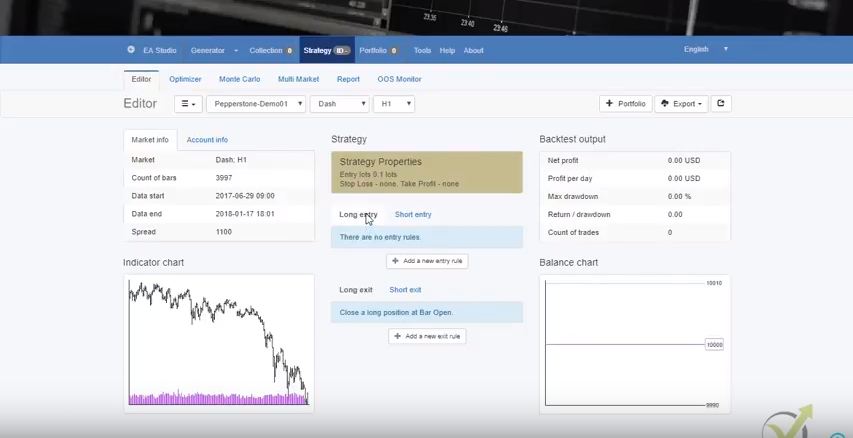
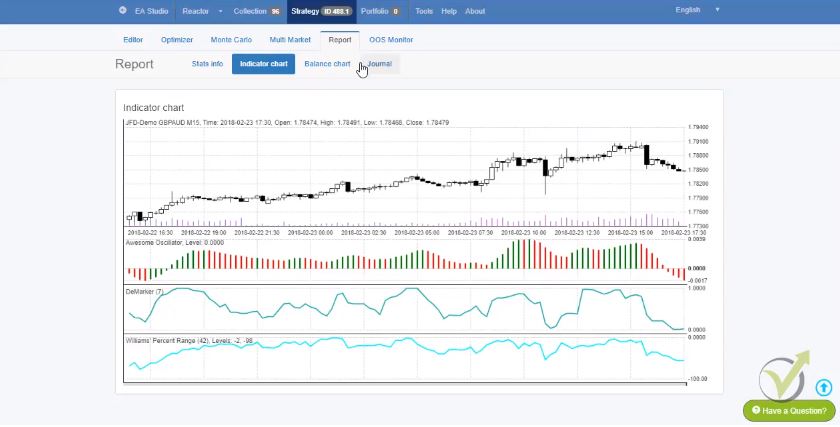
    If I click on it you can see what are:

    • the entry conditions;
    • the exit conditions;
    • the profit;
    • the indicator chart.

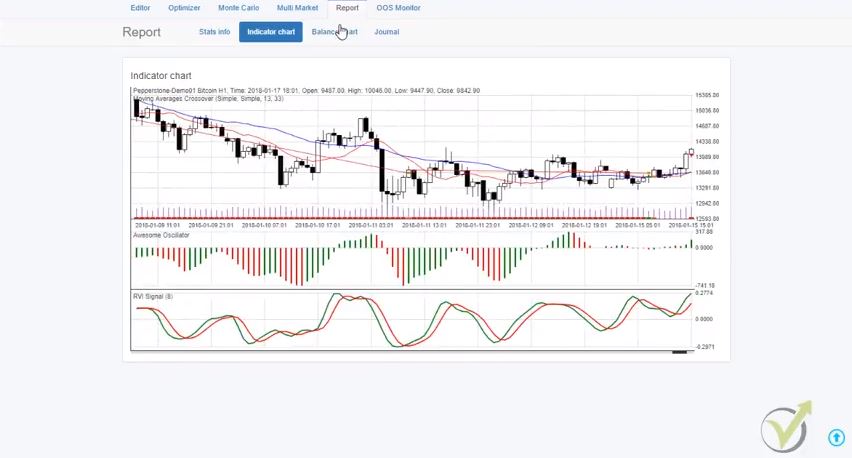
    You can zoom it if you want to see where exactly the trades happened:

    Forex-expert advisor-chart
    This is how where the trades were opened

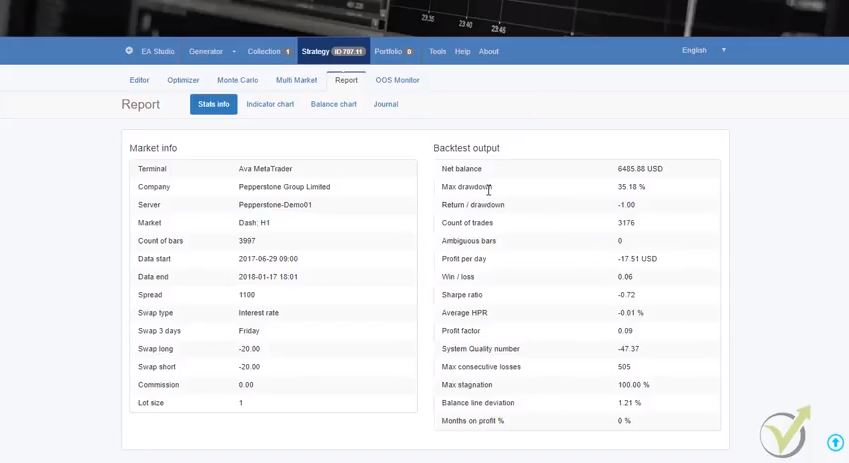
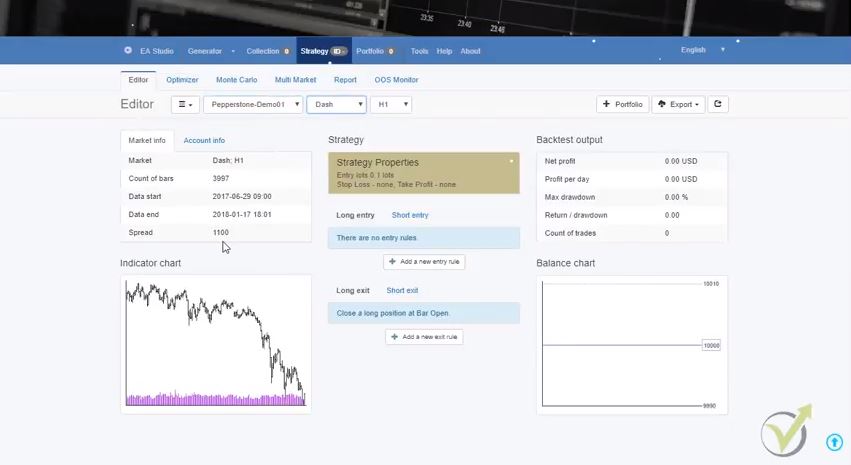
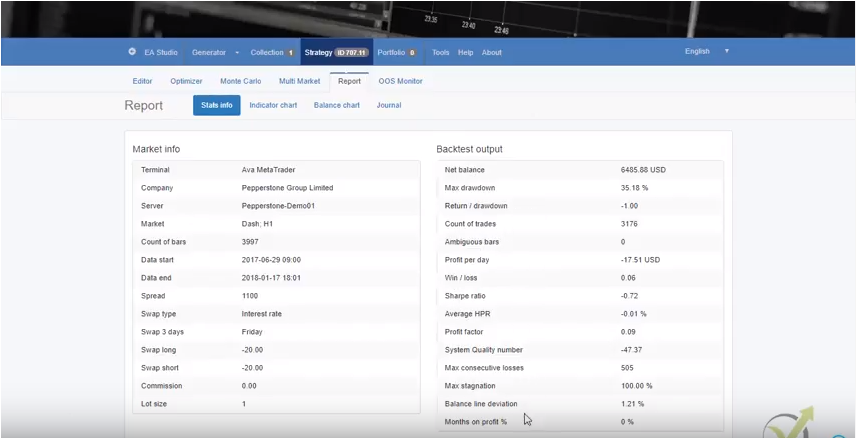
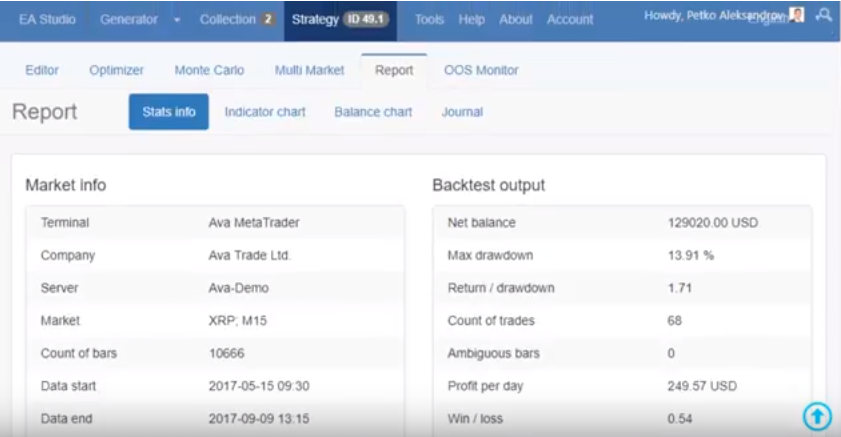
    Here is the balance chart for the Forex. And here in the beginning actually there is more statistics about the strategy profit per day, count of trades totally, win/loss ratio, sharper ratio etc, for the Forex Expert Advisor.

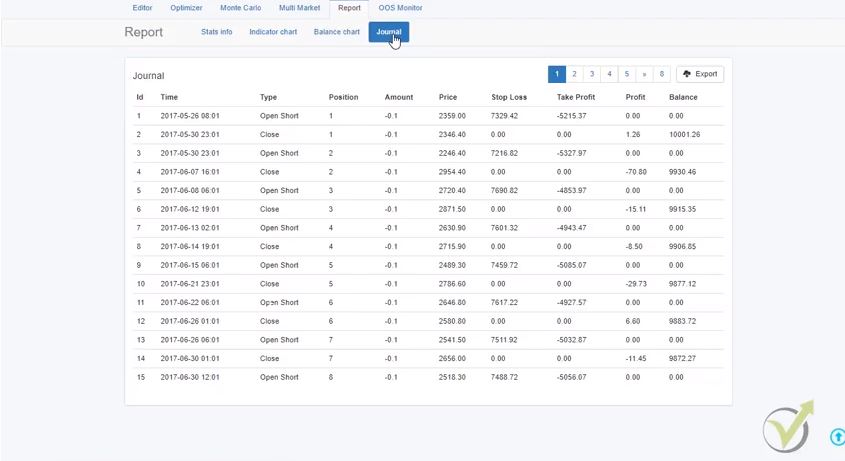
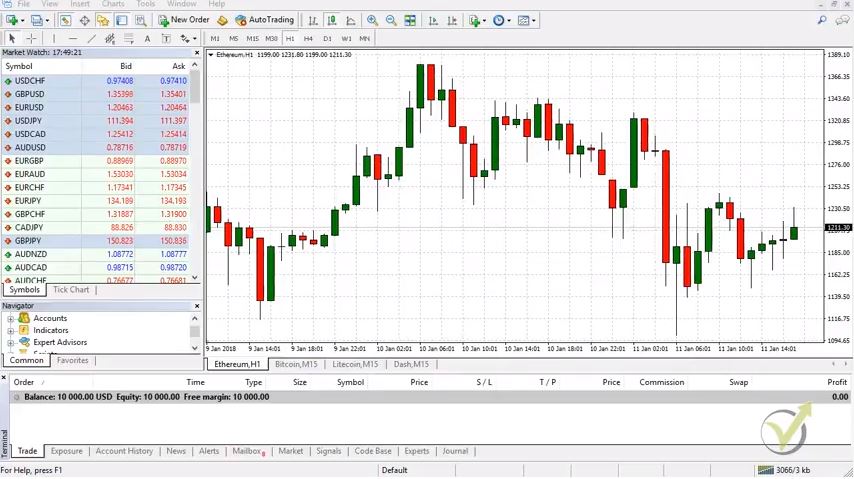
    If I go to Journal I just want to show you that we are within the trading hour. You see the first trade for example opened at 08:45 and it closed at 13:30. Then the next trade was open at 9:30 in the morning and it was closed 12:45. You see that all the trades are within the London trading session. This is what we were looking for.

    And let’s now switch to the EURGBP collection.

    You can see the strategies are over here with pretty nice profit lines actually. And only 14 strategies passed the validation and the Monte Carlo. This is very nice because from more than 100 000 strategies, only 14 are in our collection. So, it will be easier for me to filter these strategies. And one more thing I wanted to show you in Monte Carlo.

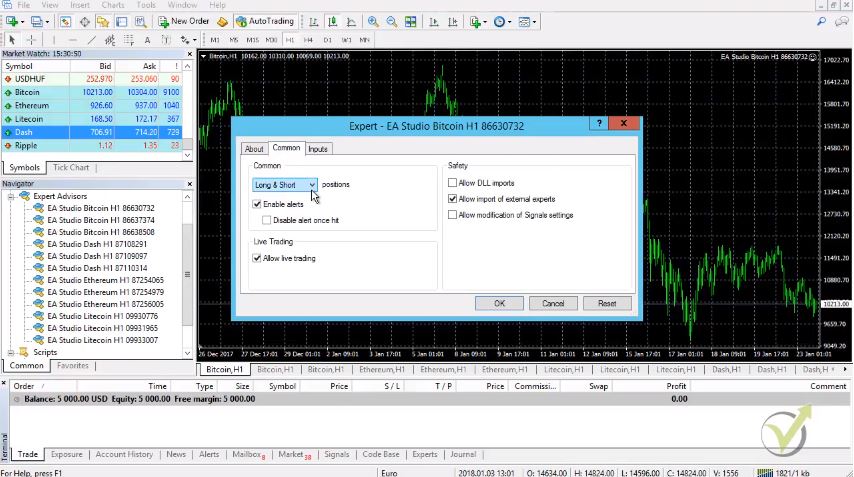
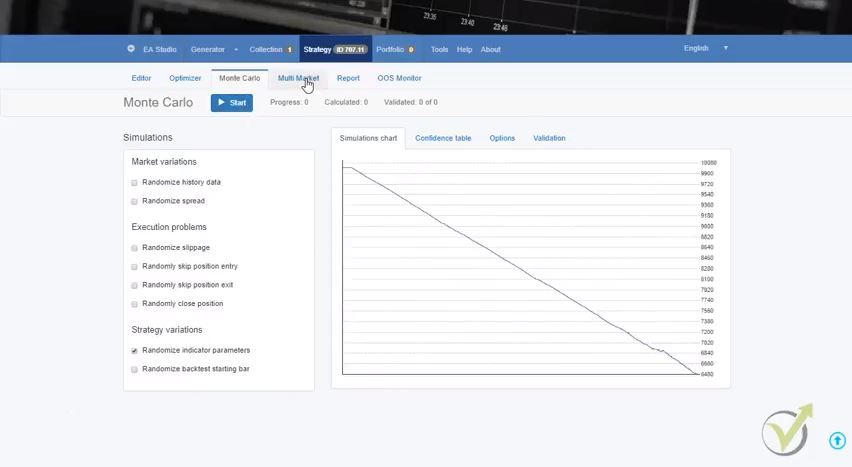
    If I click on the strategy Forex Expert Advisor, and I go again to Monte Carlo you will see here on the strategy variations the last one is the randomized indicator parameter. If I remove all of the previous ones and I select randomize indicator parameters, and I click on start the simulator here will try to break the strategy with different indicator parameters. Simply, it will make simulations with different parameters for each of the indicators. This is a very good indication if these strategies were over optimized:

    Expert Advisor robustness
    This is how we test the robustness of the strategy!

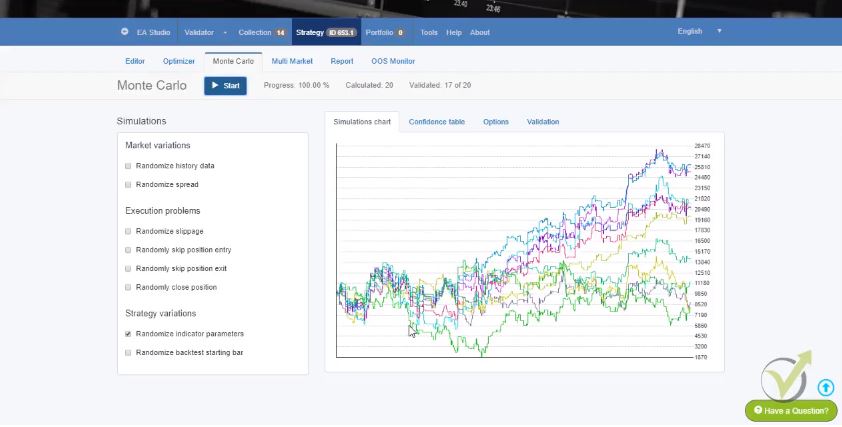
    You see I have some of the variations here going sideways, some of the simulations. But I don’t have any losing strategy that is going down.

    This normally happens with over optimized strategies when you run this simulation you will see here just a dramatic drop in the results for the Forex Expert Advisor.

    It means that the chosen parameters for the indicators were chosen in a best way in order to show a good profit line. But this is not what we are looking for. We are looking for the robust strategies.

    Let’s go back to the collection and here are the filters. I will need to select only 2 out of the 14. I will start again with the profit factor. Because it filters the strategies very well, let’s just increase it a little bit. With 1.4 I have 10 out of the 14, let’s increase it one more time. And I will have just 5 left, 5 strategies are into the collection. I will add just one more filter, let’s choose something else.

    For example, I can choose maximum stagnation. And see exactly if I choose the maximum stagnation of 30% it will filter out the other strategies. I just saw that they have a little bit more of stagnation. 

    That’s why I wanted to use the stagnation.

    The stagnation is this period for example here, where the profit reached a top and then it just goes down and then up. So the whole period where the Forex Expert Advisor is not making more profit than it reached the current moment it’s called stagnation.

    And you see with these 2 filters exactly I have the 2 strategies, I will just export them. And you see that by one click again I export them as Expert Advisors. You see that I even don’t look into each strategies, I don’t click on each parameter to look at the details about the parameters. Because really it’s not necessary to do it.

    We have tested this strategy builder EA Studio long, long time. And we saw that we don’t need to touch anything inside the strategy.

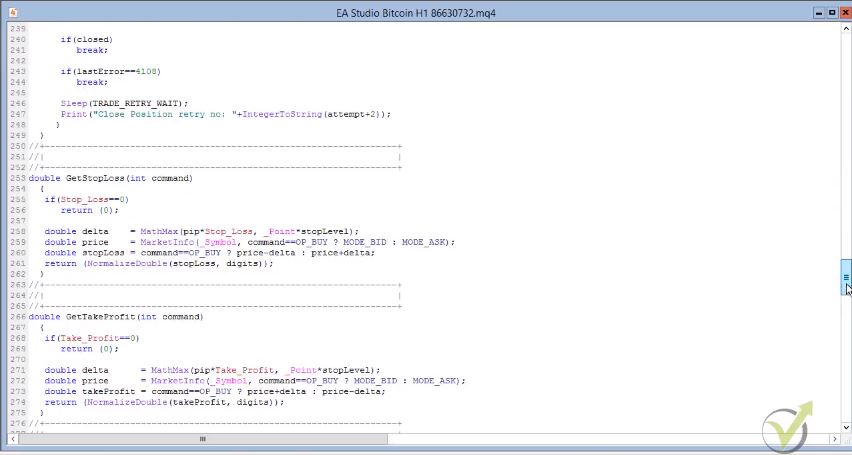
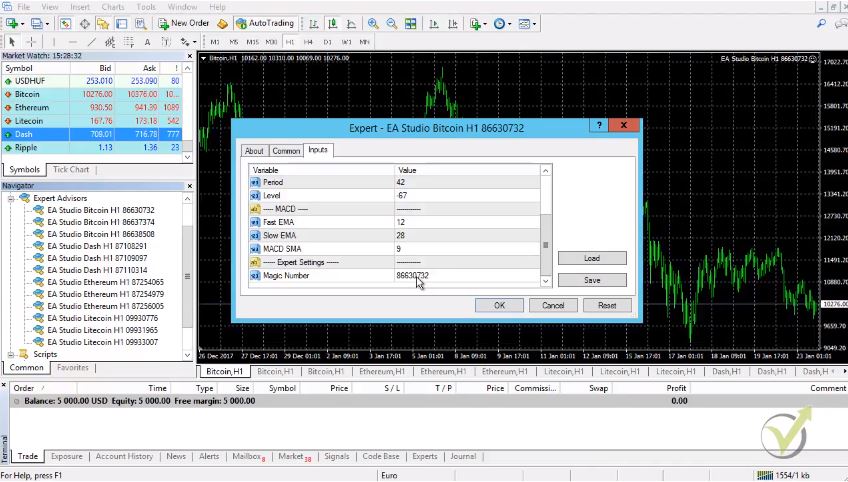
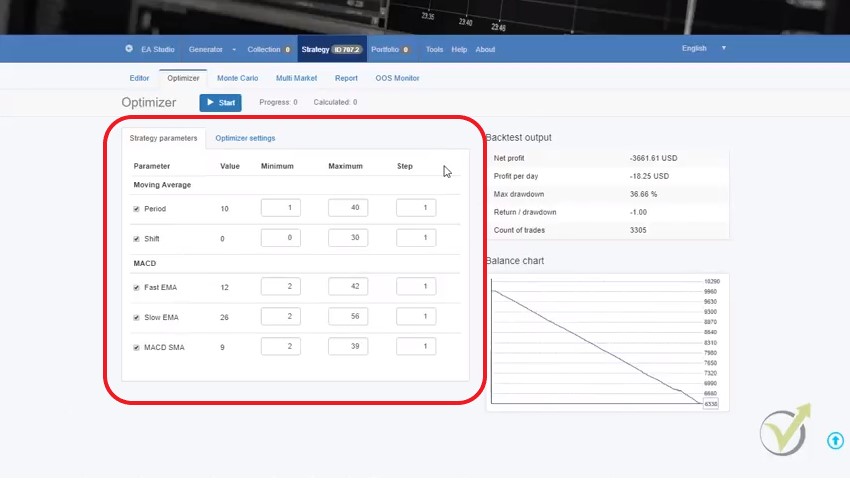
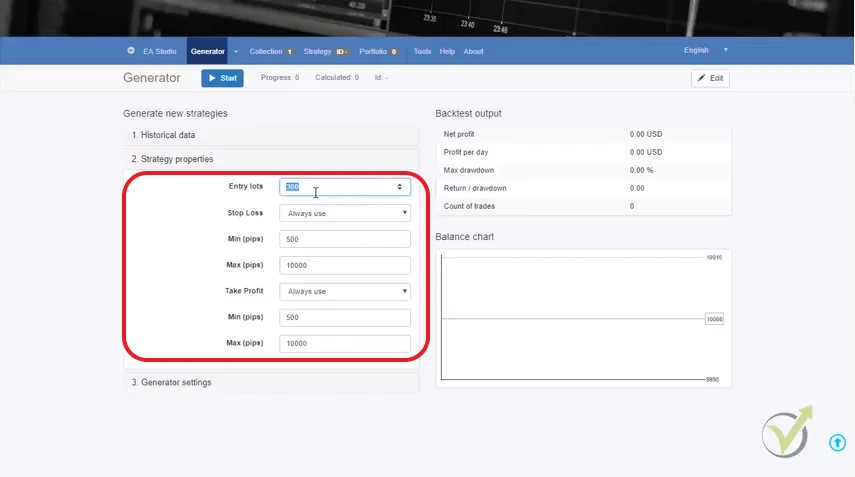
    The Stop Loss is here, the Take Profit is here for the Forex Expert Advisor:

    Forex strategy
    This from where we can modify the strategy

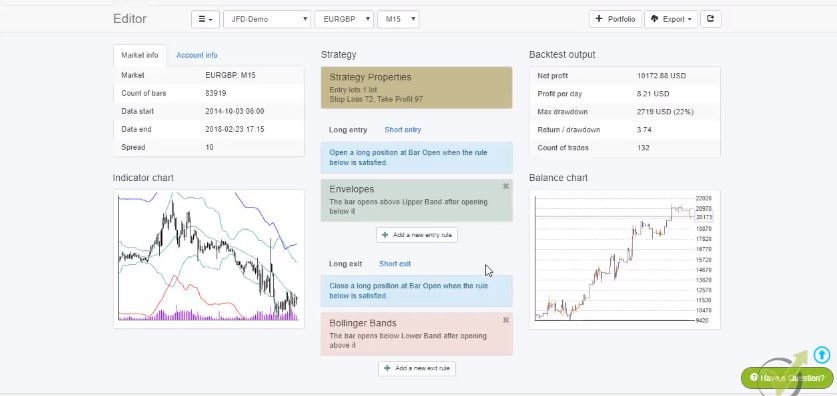
    the parameters are set exactly to show this profit line.

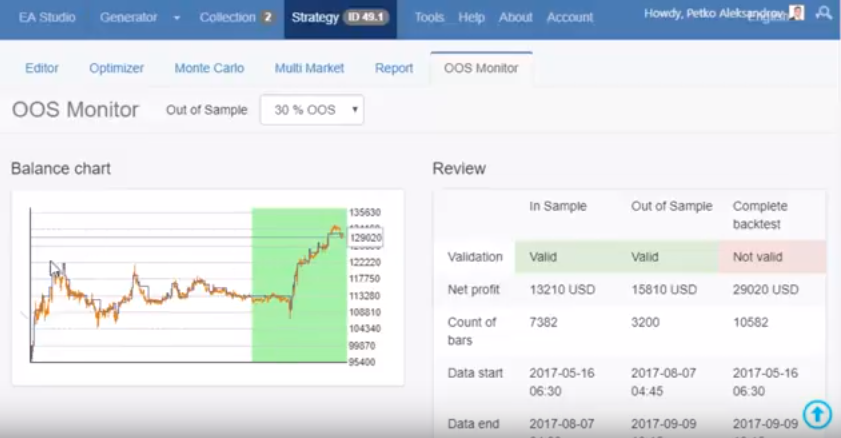
    And you will see later on in the London, New York & Tokyo Algorithmic trading course  I will show you that when we backtest it on Meta Trader 4 we will see the very same results which is the most important. And since the strategy went through the Monte Carlo and it passed the validation of the acceptance criteria we are all right.

    This is for the London market, I have the 4 strategies now downloaded.

    And I will continue in the London, New York & Tokyo Algorithmic trading course with the New York and Tokyo markets.

    The idea here is that we generate, filter and automate different strategies. And each one becomes a Forex Expert Advisor. We trade them on the specific time of the stock exchanges. This example was for the London hours.

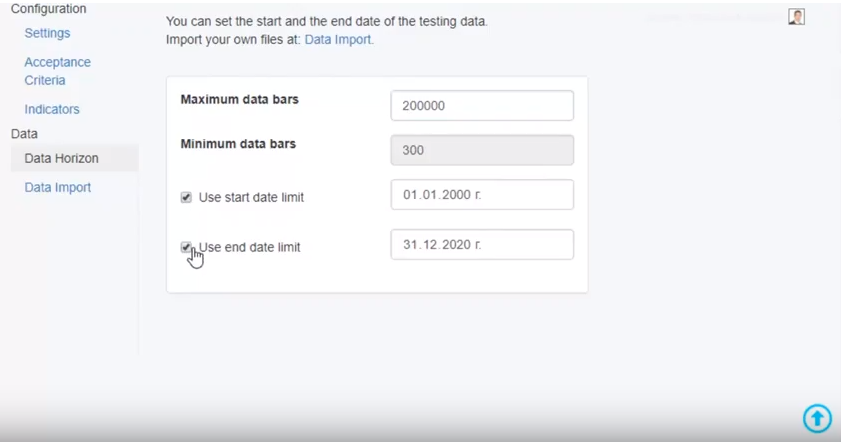
    If you decide to create your own strategies and trade with any Forex Expert Advisor, make sure to fir the hours in EA Studio – tools – data horizon. If you generate strategies on different trading hours that will not be according to this trading system.

    There are many websites where you can see the exact working hours for the three important stock exchanges. And convert them to your time local zone. More important is to make it exactly as your broker shows on the platform. Sometimes the brokers show different from your local time. Check it before starts generating EAs, anyway you will need to do it all over again.

    Another thing is that when you use this system for EA Studio. And after that you generate Forex Expert Advisor for trading 24 hours, make sure to remove the time zones from the settings.

    Thank you for reading. If you have any questions, you can always write in our support FORUM.

    For more Algorithmic trading courses please visit: https://eatradingacademy.com/courses/algorithmic-trading/

  • Cryptocurrency Expert Advisor – Trade with Crypto Robots

    Cryptocurrency Expert Advisor – Trade with Crypto Robots

    Cryptocurrency Expert Advisor Trading – Lecture from Basic Cryptocurrency Trading Course

    Cryptocurrency Expert Advisor trading, or Crypto Expert Advisor trading is the sweet desire for most of the traders during the last years.

    Are you looking for a free crypto Expert Advisor to download? Scroll to the bottom of the page and learn more about how to get a free Bitcoin Expert Advisor for MT4 and MT5.

    The volatility that came with the cryptocurrencies was unseen. The moves that the Bitcoin caused were unbelievable, and few traders succeeded in catching them.

    Many people lost money because they have joined the market too late. However, there is a professional approach to Cryptocurrency trading. This is trading with Crypto Expert Advisors.

    Basically, when trading with EAs, the traders eliminate the emotions that generally cause them to lose. These are fear and greed. And in cryptocurrency trading, there are emotions involved!

    Petko Aleksandrov is the Head Mentor in Forex Academy, and in this lecture, he will explain in detail the steps to use Expert Advisors in cryptocurrency trading. This lecture is part of his Basic Cryptocurrency trading course – from A to Z course:

    Hello dear traders, this is Petko Aleksandrov from Trading Academy, today is the 23rd of January 2018, and I have opened another demo account for cryptocurrency trading where I will show you how you need to place the Cryptocurrency Expert Advisors over the MetaTrader.

    You see recently while I was recording the Basic Cryptocurrency Trading Course – from A to Z, Pepperstone has added the Ripple as well as a trading asset:

    Cryptocurrency Expert Advisor Trading
    That is the platform Meta Trader where we can trade with EAs

    What do you need to do?

    I will leave it for you as a practice activity to create strategies if you want, of course, to do that with the Ripple for algorithmic trading.

    Just import the historical data, put it in EA Studio, generate strategies, select the top ones, and put them on a demo account for cryptocurrency trading.

    This way, you will practice how to do this for yourself. And if you want to do this, you can go to the EA Studio trial account. From there you can start a two weeks trial account and you can do this exercise for the Ripple. Or of course, during this period of time, you can generate as many strategies and export them as Expert Advisors for free, for two weeks:

    ea studio trail
    That is the login form.

    What we need to do now, guys is to place the Crypto Expert Advisors here in Meta Trader.

    How we do that?

    We go to File, open the data folder, and then click on MQL4. After that, you need to click on Experts, and here is the correct place where we need to place the Cryptocurrency Expert Advisor.

    You can see there are all the Expert Advisors and I have downloaded actually for MT4 and MT5. I will use now for this cryptocurrency trading course the MT4, and I will paste them in this folder.

    You see, now I have this MQL source file. This is the file where you know the code of the Crypto Expert Advisor.

    Let me open one, and you will see the system itself for this strategy.

    Here is the Stop Loss and Take Profit values, the indicator parameters. All the conditions for the exit, for entries, stop losses, take profits, everything that is the strategy as a code:

    This is the code of the Cryptocurrency Expert Advisor
    This is the code of the EA

    When I’m looking at this, to be honest with you, I don’t get a thing because I’m not a developer.

    Obviously, with the years, I have some idea I can change some things. I usually don’t touch anything here because I don’t want to mess up the code. And I don’t want to cause any troubles with the cryptocurrency Expert Advisor trading.

    What we need is the EX4 file.

    This is the compiled file. I will close this folder now. Then I will right-click to Expert Advisors, and I will click on refresh. This will force Meta Trader to compile the Expert Advisors. And if I click the plus you will see that these strategies were compiled.

    What I mean by compiled?

    I will go one more time to the same folder, open data folder I’m going to MQL4, I click on experts, and now you will see here that here are these EX4 files.

    Basically, this is the Crypto trading robot, and here is just the code, so when they are compiled, they are ready for cryptocurrency trading.

    Generally, if you purchase Crypto Expert Advisor over the market, they provide you only with the EX4 file, and they don’t give the code.

    And here, by using EA Studio software, you have access to the code. Once again, if you are not a professional developer, I don’t suggest you touch anything there.

    Opening the charts for Cryptocurrency Trading

    I close the folder and what I need to do now, is I need to open 12 windows or 12 charts for cryptocurrency trading:

    • Three are for Bitcoin;
    • and 3 for Ethereum;
    • 3 for Litecoin;
    • and 3 for the Dash.

    Right mouse and I click on the chart window, and one more time, I click on the chart window. You see, I can drag them to put them in order. And you see I have one Ethereum open. So I will open two more chart windows, chart window, and I will place them here, so they stand together.

    And Litecoin two more chart window, chart window. I am moving them right here next to the previous Litecoin. And then for the Dash, another two chart window, chart window.

    There is a small arrow here to right scroll, so you can use it if you have more charts to move to the left and the right. Now, I have already 3 for Bitcoin, 3 Ethereum, Litecoin, and the Dash.

    Now very important here is to make all time frames properly. It’s fundamentally important if you create a strategy for H1 cryptocurrency trading to put it on the H1 chart and not on M15 or any other time frame. Always keep that in mind.

    And here, of course, I can drop a line very quickly about trading manually, many people are using one in the same strategy for H1 chart, for M30 or M15.

    Why these Crypto Expert Advisors don’t work on the other frames?

    For the Cryptocurrency Expert Advisors, I have received so many questions about why these Crypto Expert Advisors don’t work on the other frames.

    Because they were created for H1, they work on H1. Don’t expect them to cryptocurrency trading profitably, or to be robust on the other time frames. Keep the same time frames.

    What we need to do before we place the Crypto Expert Advisor over the chart?

    enable the auto trading
    Make sure to enable the auto trading before trading

    We need to make green this auto-trading button. This allows for automated cryptocurrency Expert Advisor trading. After that, there are two options:

    1. one you double click on the Expert Advisor
    2. the second is to drag it over the chart, and I will show you on the next one.

    You see that already live trading is allowed. From inputs, you can see the inputs, the Stop Loss, the Take Profit, the parameters of the different indicators, and here is the magic number.

    Each Crypto Expert Advisor or each strategy exported from EA Studio comes with a dynamic magic number. It means that even you export hundreds of those, they will be with different magic numbers and we use these magic numbers later on to follow their performance. I will show you about it:

    Easy menu to control the Cryptocurrency Expert Advisor
    Easy menu to control the EA

    Click on OK, and you see that the Cryptocurrency Expert Advisor is already working. We have this smiley face which means that everything is alright and the Expert Advisor is already scanning the market for the cryptocurrency trading signals to enter:

    cryptocurrency trading smiley face
    You need to see the smiley face on your chart

    We go to the next one. Double click on it or you can drag it over the chart. And same thing here inputs I click on OK, and here it is, the same thing for the third one, guys. Click on OK and it will be working.

    The three of the Ethereum, it’s right over here and then the next one click double time OK, and then the third one-click twice OK.

    This is how we place them for cryptocurrency Expert Advisor trading

    It’s very easy, nothing hard. Just make sure to put the same time frames over the chart. If you have created strategies for M15 or M30, you should keep here M30 or M15. In other words, make sure that the time frames you have selected, match with this time frame over here.

    Last I need to put for the Dash I click a second time on it. Then I click on OK, here again. I click on OK and the last one I click on OK, I click a second time on it and I click on OK.

    Now we have the 12 Expert Advisors already in our demo cryptocurrency trading account, and they will start the trading.

    Changing the Crypto Expert Advisor

    If you want to change something in the Expert Advisor on the later stage in the inputs, the Stop Loss, the Take Profit you can right-click go to Expert Advisors, and you click on properties.

    The same menu comes up-you see here the Stop Loss, the Take Profit, the inputs, standard settings. From here actually, you can choose if you want to trade only short or only long if you wish to your Expert Advisor only to buy or only to sell:

    choose a direction
    You can select the direction of trading

    Pretty much that’s it. This is how we place the Cryptocurrency Expert Advisors over the chart.

    Each one of those Expert Advisors has a magic number.

    With these magic numbers, I will show you in the Basic Cryptocurrency trading course – from A to Z how we follow the performance of each Expert Advisor, and this is our system on algorithmic trading.

    We put many strategies, many Crypto Expert Advisors into a demo account and we select the top performers. The top EAs that are currently making a profit. After that, we can put them on a separate live account, or of course to another demo account if you want to practice it, which again I suggest you do first.

    I will explain in the course once I have some performance out of these Crypto Expert Advisors.

    And I will show you how to follow that performance and how to separate the top Expert Advisors into a separate cryptocurrency trading account.

    Enter your email address below to receive a free Bitcoin Expert Advisor for MT4 and MT5.

    Thank you very much for reading! For any questions, please write on our Forum. All of our cryptocurrency courses you can find here.

  • How to Create a Forex Robot without Programming in 2021

    How to Create a Forex Robot without Programming in 2021

    Do you want to create Forex EA without programming?

    Many traders get frustrated when they start looking for how to create trading robots in MT4. Do not worry, my name is Petko Aleksandrov, the Chief trader at EA Forex Academy, and in this article, I will share with you what is the easiest way to create Forex EA without programming.

    In the Academy, we use the Expert Advisor Studio. It is a strategy builder that we use to create Forex robots without programming skills. And thousands of our students are using it successfully.

    I have selected to use the cryptocurrencies because I wanted to show you that it is possible to do it not just for the Forex pairs.

    Before I show you how to create Forex EA without programming. I have to say that the most important first step is the Historical data. And you need to have reliable data before doing anything with Forex robots. We have a great FREE solution on our website that is called Forex Historical Data App.

    You can use this app or you can import the Historical data from your MetaTrader platform using the data from your broker. If you go to data import, you will see the two scripts that you can use for MT4 and MT5.

    This is the broker’s data from the server where you will be trading. For this example, I will trade with the Bitcoin, the Dash, the Ethereum, and the Litecoin. And now, if I go to the generator, I will have as a history data, data source, I have Pepperstone 01. And if I choose the drop-down menu, I have the Bitcoin, the Dash, the Ethereum and the Litecoin.

    Now I am ready to work with EA Studio

    How to create Forex Robot?

    • export historical data from your broker for the asset you want to trade
    • generate strategies with the data with predefined acceptance criteria
    • filter the strategies in the collection and select the best performers
    • export the strategy you wish to trade as a Forex Robot

    Forex robot is every strategy that is automated properly in order to open and close trades according to predefined rules. The strategy builders allow us to create Forex EA without programming as Forex robots without mistakes in the code. And this is one of the most common problems if you code the Forex robot by yourself or you hire a developer.

    What is the generator?

    create forex robot
    Generator outlook

    The generator is an automated process based on the history data we have imported in the strategy builder, which will generate strategies for us. And we can, after that, export each one of these strategies as a Forex robot. And place them on the trading platform, and they will trade automatically.

    I will go quickly over the menu in EA Studio.

    What will happen after the generator starts working?

    It will put the profitable strategies into a collection. Now, with the collection, we have many filters that we can add. And you will see just the filtered strategies. After that, you can analyze any of the Forex Robots in the Strategy Editor.

    The nice thing here is that if you have already some strategy, some existing strategy if you found any Forex robot over the internet, someone shares a video, and so on, you can immediately see if this Forex robot is working profitably or not. This is very important because this saves us so much time.

    Let me just quickly show you what I mean. For example, if I choose Pepperstone, let’s say randomly I take the Dash. This is the time frame on H1 hour. You will see here I have the history data from 2017-29 of June until today.

    I can add a Stop Loss and a Take Profit if I use them in my trading strategy. In other words, you add the entry and the exit conditions. You will see here is selected long entry. This means that we put entry conditions for buy:

    how to create a forex robot
    Strategy inputs.

    For example, let’s take randomly the moving average period of 21.

    How to create a Forex robot with different conditions for the indicators?

    For every indicator we can select different parameters – MA falls, MA risses, the bar opens above the MA, etc.

    If the bar opens above the moving average, it means it was below the moving average. And it will open above it. It means there is a cross of the moving average. And if I click on accept, I will be able to see what the result of this Forex robot is just using one indicator. Obviously it will be a disaster.

    Even I put more indicators, randomly chosen indicators. For example, let’s take the MACD, and I select the MACD line rises. I click on accept I see this strategy is still losing. And this is very important. Because if you have any strategy using indicators usually what people do, they put this strategy on a demo account.

    They test it for one month, two months until they realize the Forex robot is losing, and they start changing parameters. So, for example, they try with 15, and they work with 10. They look in YouTube people trying with different parameters for the indicators, and they change it, and change it and never actually having any profits or some good trade, some bad trade and they leave frustrated.

    So even if you know how to create a trading robot in MT4 ot MT5 but you do not have the right strategy, you would be still losing.

    The idea here is that you see the result immediately:

    how to create a trading robot in mt4
    Results show quickly

    Just at the moment, I know the strategy is losing, and I don’t want to use it. Here if you have any ready strategy, if you’re going to test the strategy, you put your entry conditions, you put your Stop Loss, you put your exit conditions, and you will see the results immediately.

    Now for every Forex robot, there is the optimizer:

    Optimizer menu
    Optimizer menu with steps for optimization

    This means that I can optimize strategy inputs before creating a Forex EA. And this means that the strategy builder will find better parameters for these indicators.

    The other tool is the Monte Carlo which is a test for robustness for each Forex robot:

    Mote Carlo tool
    Monte Carlo

    We have Multi-Market. So here we can test if this Forex robot is working on the other markets like the Bitcoin, the Ethereum, and the Litecoin.

    And here is the report of the Forex Robot:

    report for the Forex robot
    Report on the strategy

    When we create a Forex Robot with the strategy builder, we have a lot of statistics:

    • net balance
    • maximum drawdown
    • the most significant loss in percentage
    • return to drawdown ratio
    • count of trades
    • how many trades we have
    • ambiguous bars

    I’m not going into in-depth details about the strategy builder. This is a little bit advanced. And I have a couple of courses actually about algorithmic trading and how you need to use precisely the EA Studio. But here I want to show you a brief presentation. So you will have an idea at the end of the article what is algorithmic trading, what are the strategy builders, and how to create Forex Robot using them.

    One more time here, we have many tests for each strategy. And the last thing on the menu here is the portfolio.

    Portfolio trading is unique for EA studio.

    Something that is not available with the other strategy builders. Here you can trade many strategies in one Forex robot. Many strategies you can put it on the Meta Trader and they will trade for you automatically.

    If I go to the generator and this strategy that I had it, I will remove it from the collection. I will go back to the generator, and I will show you how I am using the generator to generate strategies for me.

    So for example, I will choose Pepperstone Bitcoin H1. This is on the H1 chart. And I will go to strategy properties. Here are the entry lots that we want to enter. Let’s say we want to go with 0.1.

    I can choose whether I want to use a Stop Loss or a Take Profit for the Forex robot:

    create forex ea without programming
    SL and TP for all generated Forex robots
    • “always use” this means I always want to have a Stop Loss and a Take Profit in the Forex robot.
    • may use” – I will leave it on the software to decide whether to use a Stop Loss or a Take Profit.
    • “do not use” Obviously I don’t want to use Stop Losses or Take Profits.

    Now I will choose always use and since the spread is $10 with the Bitcoin. I will need to write 10,000 pips and the point, just before the last two. And I will give it a little bit bigger range. The idea here is that I don’t want to limit the strategy builder with any criteria white it is creating forex robots for me.

    But to provide it with a huge range to find more strategies and robust Forex robots. Now, the generator settings are where we choose the working minutes. How long time the generator will generate strategies for us?

    Typically what I do to create Forex EA without programming

    I set the generator approximately 8-9 hours simply at the end of the working day I set it working. And in the morning, when I’m in the office, I have ready strategies, ready collections. Only the generator is working while I am sleeping. Isn’t that the best way to create a Forex robot?

    I will leave it, for example, to 500 minutes. And I will select Search best-this is the criteria that we want to arrange our strategies. The net balance is the most important, which strategy makes the most profit.

    In sample and Out of sample is a really great tool that simulated Demo testing and you can learn more about it from the guide. For the purpose of this lecture, I am not going to use it at the moment.

    The strategies fulfill the acceptance criteria – simple words the Forex Robot to have predefined limitations.

    What are the acceptance criteria when we create a Forex robot?

    Acceptance criteria
    Acceptance criteria for EA Studio

    We can add many things to the acceptance criteria. I like to use the most Profit Factor. It is calculated when we devide all the profits by all the losses. I always want to trade with strategies that have Profit facotr bigger than 1.2.

    And when I create Forex EA without programming with EA Studio, I set in the accpetance criteria PF>1.

    The next thing is the minimum net profit.

    Let’s say, for example, $100 and what minimum count of trades we would like to have 50. I will leave it this way. You can add some more criteria if you want the strategy and what this means? If I go back to the generator that it will show only strategies that fulfill the acceptance criteria.

    If I click on start, I can see the speed of the software, it’s quick, guys. For a few seconds I have many strategies calculated and already have some strategy into my collection as a Forex robot.

    I can choose which Forex Robot for MT4 to use for my trading from the Collection

    create forex ea without programming
    Filter records

    You see the first Forex robot made $750 and then we have the others going down. The longer I run the Generator the more strategies I will have and I will have a better chance to find a very nice and profitable Forex robot.

    I can add some filters – still, we have these acceptance criteria, the maximum balanced deviation, maximum consecutive losses, count of trades, equity drawdown, this is the thing I was set to 5%. Using the filters I will leave only ten trading strategies that have less than 5% equity drawdown during the whole period.

    Of course, you can add different filters, profit factor as well I prefer to stay at 1.2. I prefer to remain at 1.5 even and not only two, so I have a more significant profit factor. Having filters is the best way if you are a beginner and you don’t know how to create a trading robot in mt4.

    The other filter that I usually use here is a maximum of consecutive losses. I usually don’t want to have more than ten consecutive losses in the Forex robot.  For example, if I place 20, I will have more strategies into the collection 7 out of the 70, if I place ten they will call lower, and if I place 15 you will see that I have only 7, and if I put 5, for example, only one strategy will pass.

    I will leave it to 10, and with one click I will create Forex EA without programming from each of the 10 trading strategies.

    I will leave this generator working for the whole night, and tomorrow, I will see the final results. But if I decide to use any of the strategies I can easily export them as Forex robots for MT4 or MT5.

    And I will leave it for 500 minutes to work and to generate strategies for me. The Expert Advisor Studio just generated more than 11,000 strategies for about 5 minutes and I have 96 into the collection.

    If I click on each Forex Robot you can see the entry rules the Stop Loss and the Take Profit:

    Entry conditions for the Forex robot
    Control the strategy inputs

    In this Forex Robot, we have:

    • the awesome oscillator
    • the RVI signal
    • moving average crossover

    Just what I was showing you as an example. But here is an exit condition, and if I click over the chart, you can see the indicators. And you can see exactly where the trades happened, where was the entry, where was the exit for all of the periods:

    indicator chart
    Where the trades happened

    And for each strategy, you have the indicator chart, the balance chart, the equity, and you have the journal.

    Report for the Forex robot
    Report for the strategy

    Here are the actual trades that happened during the tested period. And we have all the statistics for the Forex robot.

    Net balance, maximum drawdown, return to drawdown ratio, count of trades, ambiguous bars, profit per day on an average basis, win to loss ratio, Sharpe ratio, and so on, so many things that I am not going into detail.

    But the idea here is that we do this automatically. The Expert Advisor Studio calculates for us the strategies. We need to set up the inputs that we want, the criteria that we want. And these strategies must be created over the same server where I will be trading. And they’re using the same historical data.

    The lovely thing with EA Studio since it’s a web-based program is that during the same time, while I am generating these strategies for the Bitcoin, I can open a new page and I will go again to EA studio. But the important thing here is to make it on a separate browser. Because this way, EA Studio works faster.

    I will just login in as well. And I will do the same generation for the other cryptocurrency Forex robot.

    How to create a trading robot in mt4 for Dash:

    dash strategy as a Forex robot
    Dash Forex robot generation

    Also, for the H1 chart and then I will go to strategy properties, here 0.1, and let’s see how much was the spread with the Dash. I go back to the generator. I always put the minimum as a spread, and here I give it a more significant range so that I will use this as a minimum as well for the Take Profit. The generator settings also 500 minutes here.

    Let’s see the acceptance criteria for this Forex robot. We said we want a minimum $100 of profit for our strategies, and that’s it pretty much. I click on Start, and now the generator will start creating strategies.

    Now I will open in one more browser another EA Studio, and I will run there for the Ethereum. And I will run as well for the Litecoin.

    So, I’m going to my account, log in, I go to the generator, and let’s see first how much was the spread. So, from here, I choose Pepperstone Demo 1, and here I choose Ethereum. The spread was 700, go to generator I choose the wanted cryptocurrency. I’m going to Ethereum.

    You see that this way I really do not need Expert Advisor Coder or anyone with IT skills to do the work for me. It is awesome!

    I select H1 as well, and I’m going to strategy properties, entry lot 0.1 again I will enter. I will put a minimum of 700 as I said this is the spread, another more significant number here and then 700 here. The acceptance criteria 500 minutes, let me see here I will put it again minimum net profit of $100, generator, and I click on start.

    And the last one I will open one more browser. I go to the EA studio. I will just quickly log in, and I am going to the generator, and first, let’s see again the spread, go-to the strategy I choose the broker server, and I choose the Litecoin. Here I have 500 as a spread. I’m going to the generator 500 is $5. Because this is in pips to make sure I am clear.

    How to create a Robot for Forex trading with the Litecoin:

    Litcoin strategy without forex programming
    Litecoin generation

    And I’m going to H1 again. Strategy properties, so the minimum is the spread here, is exactly like that. I will give a little bit a more significant range again. I will go to 0.1. The Forex robot properties here I will go for 500 minutes again and acceptance criteria I would like to have a minimum of $100.

    I am going to the generator, I click on start, and now I have these 4 generators as you can see working over here and I will leave them over the night.

    Tomorrow morning what I will have? I will have ready strategies into the collection, already hundreds of strategies; these are different strategies. What do we do after that? We select the best ones, and we place them on a demo account for trading, and after that, we follow their performance.

    I will show you how we follow the performance of the Expert Advisors, and we place on a separate live account only the best Expert Advisors.

    But I can afford to do that just because I know how to create MT4 robot that works great and I do it easily with EA Studio.

    This way, we automate the whole process, and you know how to create a trading robot in mt4 now.

    Anyway, this process would be impossible if we don’t have these strategy builders. Because even we have some strategies for manual trading, they are not so many. And their result it’s tough to be backtested.

    And actually, to automate this whole process takes so much time if I use, for example, developers because I was using this system for a long time, I was giving strategies to developers to automate them as Forex robot. Obviously this was a horrible process, it was taking so much time and so much money.

    Because one strategy, a straightforward strategy like this one to be automated by a developer that would cost somewhere around $200 to $300, depending on the entry conditions they charge you even more and they take so much money. Obviously, in the code of the Expert Advisor of the Forex robot, it’s possible to have mistakes.

    With the strategy builders, we eliminate the mistakes, and we are sure into the code. And obviously, this gives us the opportunity to trade a portfolio of different strategies.

    For example, what I will do after I create Expert Advisor without programming for each asset?

    I will select the best three strategies from Bitcoin, the best three strategies from Ethereum, the Lite, and the Dash. In other words, I will have 12 different strategies on four different cryptocurrencies, and I will place them in the same trading account, which will give me a good diversification of the risk.

    I will not put all the risk into one strategy, into one Forex robot, into one cryptocurrency, but I will divide the risk, I will diversify the risk.

    This is pretty much about it. There are free videos over the internet on how to use EA studio. There are free materials, so that’s why I’m not going into details.

    In the help of the EA Studio:

    tools in EA studio
    Tools in EA studio and information

    There is so much more information about each one section, I just showed you in this article the very basic, so you can have an idea what are the strategy builders, how we create strategies, hundreds of strategies, actually thousands of strategies. So now you know how to create MT4 Robot.

    I show in the Cryptocurrency Trading Course – from A to Z how I export the strategies and how I put them on Meta Trader for trading.

    So how to create an Expert Advisor without programming?

    • use strategy builders that will put your strategy together and export it as EA
    • use the generator which will show you new strategies even you do not have any
    • hire a developer to do it, but this will take you a lot of time and resources

    The last option is to learn to Forex robot programming, but this is not what I like to do. I am a trader, not an IT.

    If you have any questions, don’t hesitate to ask me in our FORUM.

    For more cryptocurrency trading courses, please visit:

    https://eatradingacademy.com/courses/cryptocurrency-trading/

    Want to create a Forex robot without programming? What about downloading our EA robot and try it out for free!

    There are three ways to create a Forex robot. One is to code it by yourself on MQL in MetaTrader. The second is to hire a developer to automate your strategy. The third is to use a Forex strategy builder and export the ready code.

    These are automated trading strategies. The rules for entry and exit are coded and ones the Robot is attached to the chart it opens and closes the trades automatically.

    When the traders use Forex robots they avoid the emotions in trading which is the main reason why many loose on the market. Also, the trader spends less time in front of the monitors.

    The best Forex robot is the one that is created by yourself over historical data of your broker. Robustness tests are recommendable before start trading.

  • Candlestick chart – Different Chart types and time frames

    Candlestick chart – Different Chart types and time frames

    Candlestick chart is the most useful way to look at the market.

    Candlestick chart is what Petko Aleksandrov – Head trader at EA Forex Academy, focuses on in this lecture: Hello dear traders, it is Petko Aleksandrov and I continue now with the different candlestick chart types that we have and the time frames.

    The first thing I will go to is the chart types, there are three basic chart types-this is the bar chart, the candlestick chart and the line chart.

    Candlestick chart screen
    Candlestick chart on H1

    If I just zoom in any of the cryptocurrency, let me make it a little bit bigger. The first and most common type of chart are the candlesticks or they call them as well Japanese candlesticks. They were developed during 18th century by Munehisa Homma. Who was a Japanese rise trader.

    And later on they were described in the book Japanese candlestick chart techniques by Steve Nison. I think he was who actually represented these candlesticks to the Western world. And they got really famous because they are very visual, much more visual than the bars and the line that I will show you.

    There are many trading strategies based on the candlestick chart, and they represent very well the market behavior. There are dozens of candlestick patterns that could be used in trading. And you can find many tables and pictures with those. They give us great signals when the price might reverse. The problem is that if you base your trading strategy on candlestick pattern, you might place most of the trades against the major direction of the price.

    What we have with the candlestick chart?

    Each one represents time period:

    • If I zoom it each candlestick represents one hour if we are on a hourly chart;
    • if we go to H4 each candlestick chart represents four hours;
    • and if I go to daily obviously each candlestick will represent daily chart.

    If I put the mouse on the closing of every bar or let’s take yesterday because we are on the current day, if I take yesterday and if I put it on the closing you will see that I have four values. This is:

    • the open
    • the high
    • the low
    • the close

    precise values
    Place the mouse on the closing of the bar.

    If I take this day for example there is a green body and there are two lines up and down. The body represents the distance between the opening and the close of the candlestick. And the lines represents the maximum the price. When during this day and the minimum the lowest level that the price reached during this day. If I put the mouse on the closing of the bar you will see that we have four values there.

    We have the opening, the high, the low and the closing price. And we have the volume which we actually do not use when it comes to trading with brokers because they show the volume of their clients and not the global volume.

    This bar is the distance between the opening and the close. So, this day opened at this level it went up and down, up and down and it closed at this level. It formed a positive day. Because it opened nearly at 1080 and it closed at 1140-1150 something. But it went up and down. And we can see how far it went down and how far it went up during this day.

    And after that we have another day that opens and the price goes up and down and another day, and another day, and you can see today the price opened nearly at 1258 and if it closed below this level it will form a red candlestick chart which means it’s a negative day.

    The very important things we have here with the candlesticks are the open, the closed, the high and the low of each candlestick chart.

    And if you’re on a daily chart each candlestick represents one day. If I go down to H1 again each one bar represents one hour. Now is 17:55 my time after five minutes a new bar will open H1 chart.

    These four values are the most important information we use in algorithmic trading.

    When we export Historical data from the broker, this is what we use. There are scripts to export Historical data available on our website for free. And you can use them. What you will see is that it is extremely easy to export these 4 values for each bar for the last 2 years for example. Yes, this is huge file, but with the scripts it can be done in seconds.

    Anyway, when we generate, optimize or test strategies with Strategy builders, we use this 4 values. And this is the only thing we have in order to see if a strategy was profitable in the past. Of course, this causes some issues because we do not know what exactly happened inside the bar. When we are looking at the candlestick chart you, we see the body. But we do not know where the price went first. There is no way to use the lower time frames to draw us what happened in the higher time frame candlestick chart.

    Lets have the example for H1. Lets have any strategy on H1 chart. What we are able to see are the four values of this bar – the open, the high, the low and the close. We do not know what happened inside this bar, even we use the M1 chart for this one hour. Yes, we have it and we can see what happened. But when we use Expert Advisors, we can not put it this way in the code.

    What is the solution?

    We use different time frames in the strategy builders. This means that if we are trading on H1 chart, we can set the Expert Advisor to check the lower time frames if the price goes in our direction. The other way around is possible. If we are looking to trade on M1 candlestick chart, we can set the EA to check the higher time frames. Such three strategies we have in our course Forex trading strategies from a professional trader + 5 Robots.

    The other type of charts is the bar chart

    It’s the very same thing here we have these vertical lines that represent the one hour. They show where the price went to the maximum and to the lowest point during this hour. And they show where the bar was open and where was closed:

    bar chart type
    Bar chart

    You can see there are the vertical lines. And then we have these short horizontal lines on left side of the vertical line. We have small horizontal line which represents the opening. And we have the small horizontal line on the right side which represents the closing. As you can see it’s not really visual which bar is positive and which bar is negative. If you get used with that you will know. I mean by looking at these lines, I can say vertical and horizontal lines I know very clearly which ones are positive and which ones are negative.

    There are as well many strategies created over the bar chart. The interesting thing is that all of those could be applied. If we have the candlestick chart. It really does not matter which one you will use for a strategy based on it. Because it represents the very same thing, as what your eyes see.

    The most useful way for every trader is the way that he is used to. I am sure that if I have started from the beginning looking and bar charts, it would be much easier to me till the moment. And I would be still using it. However, I am sure that I would have used with the candlestick chart much faster than the other way around.

    The main thing is that with the bar chart we do not recognize at a first view which bars are positive and which are negative.

    Something that is extremely visual with the candlestick chart. There are the different colors. If you make it white and black, you will see if immediately. Most common colors are green and red (green for positive, and black for negative), white and black (or empty which is again black if the background black).

    But simply, guys, with the candlestick chart it is much more visual just from the first side even you are beginner trader it’s easy to understand which bar is negative and which bar is positive.

    And the third type we have the line chart:

    Candlestick chart as a line
    Line chart

    Normally the line is just connecting the closing of each bar that we see on the candlesticks or on the bars actually. It’s connecting the closing of these bars and it’s forming the line. Obviously here we have much less information. We see where the prices at what level, we see the movement. But we don’t see exactly at what hour where was the price, where were the negative and the positive hours. And it’s really hard actually to do any trading with line chart. That’s why the most common ones are the bars and the candlestick chart.

    The line chart gives a bit of illusion.

    Actually this line connect different points on the chart. Normally that is the closing of the predefined time. If we are on Daily, the line chart would connect the closing of each day. Or the price at which the day closed. And if we are on hourly chart it would connect the closing of each hours.

    Same illusion comes with the indicators that are represented as lines. All indicators represent some formula. And there is a value as a result from the formula. So, for each bar there is a price again (different from the current). The indicators are simply lines connecting these points. This is very important to be known when we do algorithmic trading. Many traders do not understand how exactly the Expert Advisors are working exactly for this reason.

    Obviously, there are other types of chart.

    There are two lines that are representing the bid and ask price. 

    This type of chart is available with some of the brokers, but it does not help a lot. One of the lines is the bid price, and the other one is the ask price. So, you basically will see two parallel lines that move up and down. It will not be very useful to the trader. Because it is just the very same thing as the normal line chart. But still much further from the candlestick chart as information.

    There are Renko charts which ignore actually the time. We have some great strategies as well with the Renko chart. The idea with the Renko chart is that they represent only the price. So, If an assets stays in a range of 20 pips for example, and you have set the Renko chart to have a new bar at every new 20 pips, you will not see any new bar opening until the price breaks these 20 pips. Anyway, this type of trading is totally different. Very different indicators, price action techniques are applied.

    The strategies which are used with Renko charts are normally called “boxes”. These are the strategies where we are looking for new bar or box to open in order to enter into a trade. Pending orders are very useful in this kind of strategies. We have a great system using Renko charts, and it is in our “to do” list to put it into a course.

    But the most common one is the candlestick chart. It’s much more visual and it’s much easier to be used.

    This is pretty much about the different chart types. It’s your choice which one you want to use. And it really depends on the strategy that we are using with the Expert Advisors, with the robots when we do algorithmic trading. It doesn’t really matter what chart type you use. Because simply we put the trading robot over the chart. And it trades according to the entry and exit conditions. It has inside the code and it doesn’t matter what is the type chart but I will talk about the Expert Advisors in the Basic Cryptocurrency trading course – from A to Z. Also, the course is included in our PACKAGES.

    For more cryptocurrency trading courses, please visit : https://eatradingacademy.com/tracks/cryptocurrency-trading/.

    Thank you for reading and let me know if you have any questions at [email protected] or write in our FORUM  on our website.

  • Scam Brokers – How to recognize them?

    Scam Brokers – How to recognize them?

    Scam brokers – the darkness in trading.

    Scam brokers is what we want to protect our students from. They have been for many years around and they have scammed many people. Something we can not change, but what we can do is to protect the new traders avoid the scam brokers.

    This article is part from one of our courses, and it helps the new students avoid the Scam Brokers. Hello dear traders, this is Petko Aleksandrov from EA Forex Academy and I start with our first lecture about the scam brokers.

    Basically, I will just talk a little bit about the selection of the broker.

    The first thing you need to do, guys, is to choose your broker and for the purpose of the Ethereum trading course + 99 algorithmic trading robots I have to choose Pepperstone, this is a very huge international broker. Just to make it clear, guys, here we are not connected to any broker and we don’t suggest you use any brokers or don’t take it as a recommendation at all. Just for the purpose of this course, I had to choose one broker.

    Of course, I’m always choosing the legit brokers because there are so many scam brokers, I will talk a little bit about it. Basically this is the trading platform that we are using Meta Trader:

    Scam brokers also use MT
    Meta Trader platform

    The first thing you need to do is to choose your broker which provides Meta Trader, because Meta Trader is the only trusted algorithmic trading platform and here you will be able to attach as many Expert Advisors as you wish that you will receive from the course.

    Basically how it’s working?

    The broker is providing us the Meta Trader for free, we don’t pay for the service of Meta Trader and by this platform we have access to the market through the broker with the Forex, with the stocks, indexes. Everything that the broker offers and here you can see we have as well the Bitcoin, the Ethereum, the Dash and the Litecoin.

    What we are focusing in this course is:

    • How to select the broker and avoid the Scam brokers
    • the Ethereum as a trading asset;
    • I will show you how I’m creating the strategies;
    • how I’m creating Expert Advisors;
    • and I will provide you in the course with the 99 Expert Advisors that I will create.

    At the end of the day you will be able to select only the best performers.

    Simply one more time the broker is providing us the Meta Trader, we use this trading platform to place here the Expert Advisors and they will trade for us and we will only follow the statistics and I will show you every single step.

    The first thing again I say is to choose the broker. First of all, I would like to share with you one article that we have on our websites. So, our website is eaforexacademy.com. We have plenty of information there, guys if you want to read it. And as well, in the FORUM, recently this is a very new forum for 2017 and we have more people coming in and there are some actually very experienced traders that you can learn from:

    How to recognize topic
    Find the topic in our forum

    You’re very welcome to register in the forum, it’s absolutely free just share your experience there, share your thoughts, share your questions. Actually we will answer you as soon as possible a little bit even quicker than the dashboard. But no matter you are writing on the dashboard, you are dropping us an email on [email protected] or you write in the forum you will always receive the answer very quick by 24 hours. Don’t hesitate to drop any questions.

    What I am focusing is on this article here “How to recognize the scam brokers” I have even some comments from two hours that I didn’t have the chance to read yet, but what we are talking about here is how to recognize the scam brokers it was written by one of my colleagues – Svet.

    But basically, he is explaining how you need to recognize the scam brokers, what you need to know in order to recognize the scam brokers. Just very quickly over here, so you can read it in details if you wish:

    Detailed information
    Go over the points carefully to make sure you will avoid the brokers.

    But the thing is that if you register for a demo account or a live account with any of the scam brokers:

    1. you will receive a call immediately. Simply, after you leave your details there, they will call you immediately. The first call you will receive is from the so called Account Manager or Specialist. Automated Robot with success rate to 80-90%, they will promise you.They will promise you many things that the professional trader will do the education for you for free, for a very small commission.
    2. the minimum deposit they will ask you is $250 but because there is a huge competition even among these Scam brokers, guys, some of them will go down to $100 for a minimum of opening the account. They will ask you for your debit or credit card details over the phone. Make sure never give that over the phone. It’s totally illegal.

    After they take your money you will receive a call from their Compliance Department to ask for the documents, after that it’s very hard to make a charge back. And after that you will receive a call from the professional trader or so called manager a Senior Account Manager and he will start talking about the markets, he will make some profits into your account but those are not realistic, guys.

    These guys don’t have an idea what the market is and they’re just pure sales!

    They will just sell you what you need to hear, what you want to hear. Don’t trust this, don’t trust anybody over the phone, but yourself trust a knowledge that you gain. Very quickly here about the scam brokers, if you wish to know more details just read this article. There are actually people writing under that suffered already from these scam brokers, unfortunately too many nowadays.

    But of course there are legit brokers that you can use and as well if you have troubles finding the broker just drop us an email at [email protected] and we will send you some names.:

    Here to assist you
    Drop us mail to assist you.

    But again don’t take it like a recommendation or any suggestions. We just really want to protect our students from the scam brokers. We have already thousands of students that we have protected from the scam brokers, this makes me very happy and I really wish to continue doing this, because the scam brokers are some disaster really recently they will just take your money without anything to be able to be done.

    The first thing choose your broker very carefully, and ignore all the scam brokers.

    Ff you have questions write us an email, we will send you some name. For the purpose of this course I have chosen Pepperstone, once again we are not connected to this broker, we do not suggest you or we do not recommend you using it. It’s your personal choice which one you want to use.

    Here I have opened one demo account with $50,000 and I will just talk for the demo account in the one lecture of the course. One more time simply said the broker is the company that will provide you the Meta Trader, you will be able to deposit some money in there and you will be able to trade all of these assets and by using Meta Trader we have the possibility to trade algorithmically by trading Expert Advisors or trading robots, this is the slang word-robot, the normal word is Expert Advisor.

    As you can see here I have couple of accounts with Pepperstone, so if I have here two demo accounts, one real account in the middle but I always suggest you, to start trading with the demo account. Take your time, don’t hurry to place real money because it’s your money that you can lose, take it easy, take your time and start practicing with a demo account. So you can see I have opened a demo account with $50,000, and I will show you in the next lecture actually how you can open one.

    I hope this was useful to you to recognize and ignore the Scam brokers. It is very important to choose the good broker before starts trading.

    Thank you for reading. If you are interested in more cryptocurrency trading courses you can find them here on our website: https://eatradingacademy.com/tracks/cryptocurrency-trading/

  • Test trading strategies: Avoid Demo Trading

    Test trading strategies: Avoid Demo Trading

    Test trading strategies – learn how to avoid testing on Demo account

    Test trading strategies could be much more useful than everyone thinks. It is not just a method to see how a trading strategy performed for a predefined period of time. It is much more! In this article, Petko Aleksandrov will teach you how to replace testing on Demo account with backtesting in 1 minute and have the same results. This is a free lecture from the course Ethereum trading course + 99 Algorithmic Trading Robots.

    Hello dear traders, this is Petko Aleksandrov and today is the 7th of December 2017, the generator is ready and I have in the collection 100 strategies for H1 chart and as well I have 100 strategies for H4 chart.

    What I will do now?

    I will test trading strategies for the period of the last month.

    backtesting trading strategies software
    Redefine the period for backtesting

    I will go to tools and from data horizon I will include the last one month. I will just remove the tick which disables to use the end date limit. And this will include the last one month. One more time, I have created the collection of strategies for the Ethereum on H1 and H4 but without using the last one month.

    Now when I click on recalculate you can see here I have 10 strategies on each page and I have 10 pages. Watch carefully what will happen now. I click on recalculate and EA Studio recalculates how many of those strategies continue to be on the profitable side

    And you can see something very interesting actually that some of the strategies have made a great profit during the last month.

    This is the totally same thing, guys if I keep these 100 strategies on a demo account. Test trading strategies could not be easier!

    You see I have done it just with one click or couple of clicks to add the last one month. But one click recalculates I am including the last one month. And you see how the date is yesterday. Basically now I have 99 strategies that were profitable as well during the last one month. And very important this shows how EA studio is creating actually robust strategies.

    Simply, I will do the same thing for H4 chart, I’m going to tools, you can see the date here is 4th of November:

    recalculate the strategies
    One-click and test the EAs for one month

    I’m going to tools and I will click on data import, actually data horizon. Here I as well remove this tick and this way I am including the last one month. And when I click on recalculate you will see what will happen. Let’s see how many strategies will pass the test, all of the strategies – this is just fantastic.

    Normally, what I see is that 70, 60, sometimes 50, sometimes 30 really depends on the asset that we choose, how long time I have run the generator. But in this case, I have run it for a long time. Basically, I have many trading strategies that showed a great profit. And even including the last one-month history data they still show a profit.

    What I’m doing now, guys?

    put exact dataes
    Check if you want to use dates

    I need to select from the two collections a total of 99 strategies. Probably I will choose like 50 from one and 49 from the other.

    Why I can not test more than 100 trading strategies?

    Because the maximum in Meta Trader is 99. And that’s why actually I choose to add in the course 99 strategies, just like my Bitcoin course. This is the maximum in Meta Trader. Obviously, I can provide you with hundreds of strategies. But you need to load it in two Meta Traders. Not really necessary to do 100, actually 99 is more than enough, guys, for you to choose the top performance out of the 99.

    I went to the tenth page where are the strategies with less profit. And you can see that these strategies during the last month they remained profitable but they went on a loss. I will start removing these strategies. And I will just simply leave the ones that had a good profit as well during the last month. And not having this drawdown. Probably these strategies were a little bit over-optimized. EA Studio just found very good parameters while testing trading strategies:

    test trading strategies shows losses
    The backtesting shows losses. Something we want to avoid.

    When I just tested them now for the last one month they showed some losses. And we want to avoid having such strategies into our collection. You can see the test trading strategies has some drawdown here but not really huge. I can see like $80-$90 not really huge drawdown. You can see there is one here but then it recovered. And now again and now it starts to recover.

    I will remove the others which are with worse profit lines at the end.

    I will just go to eight-page and I will start removing strategies from here. Basically, what you see, is that I`m not going into each strategy to look into the indicators. I have done that many times and I have concluded that actually EA Studio works well, does its job. And I don’t need to analyze it and to change something in the strategies.

    This is why I’m using this professional software to rely on it. And it proved to me obviously that it creates profitable strategies. And it does test trading strategies very well. I don’t need to spend time on each strategy to change somethings. But most important is that I will lose time, guys. And time recently in trading is very precious especially with the cryptocurrencies, we need to be very quick, we need to move fast, we need to create strategies very quickly if we don’t want to actually miss these volatile moves that are happening on the market.

    I keep removing the strategies, simply one more time all I care about is the net profit. And this is the profit line of each strategy, and if it’s losing recently during the last one month that I have tested it over I am removing the strategy. And if you have any questions about how I’m selecting the strategies you’re welcome to ask me in our Trading Forum.

    But one more time the most important thing we care about is the profit line shown while we test trading strategies.

    We don’t want to have huge drawdowns. Huge drawdowns like huge stagnation, like for example here you see drawdown:

    Stagnation period
    Stagnation periods are something want to avoid.

    As you can see it is for a short period of time then it recovered. But if it was like that during the whole period and then it recovered I don’t want to have such strategy that it will stay a long time into stagnation.

    This is called stagnation while we test trading strategies. The period when the strategy is not doing profit but it’s actually losing it`s called stagnation.

    Let’s continue a lower, you can see here is such a great profit line, guys, very stable even including the last one month. You can see here drawdown and then the profit line just goes sideways. I will remove this one. Let me just have a look how many I have left 55. So, I will remove 5 more strategies. These ones are losing recently and this one as well. And I will do the same with H1 chart, and then I will remove one more strategy from the two.

    Totally I will remain with 99 strategies. One more from here, let me just have a look this one. But not really losing too much recently, let me go back to the last page. I will remove this strategy that I left earlier. But obviously the others are having better profits.

    Now I have into the collection 50 strategies, that are having nice profit lines. They are having net profit more than $500 but actually I’m not looking really at the net profit and the profit per day. Because for the purpose of this course I have selected 1 trading lot while I test trading strategies.

    Which with the Ethereum is a small amount.

    Again I say in my courses I don’t want to suggest any trading volume. I don’t want to suggest any starting amount. It’s your choice. I have just opened a huge demo account and it’s really no matter how much. Obviously, if I put 10 trading lots here I will have $29 per day and I will have a net profit of $5530. And actually $32,30:

    profit per day
    Profit per day and statistics

    Really no matter here while we do test trading strategies, don’t look too much in the net profit and the profit per day because what we care about is a stable profit line and after that when you start trading on a demo, when you see the profits, the losses because some of the strategies will be profiting, some will be losing, you will decide for yourself with how much you want to start the trading.

    Probably you want to start first with a small trading account, with a couple of Expert Advisors. Because this is the idea from all the Expert Advisors:

    1. we create them;
    2. we test them;
    3. test them one more time for one month;
    4. and then we test them one more time on the demo and we place the top performer.

    You will decide on how much you want to start and what trading lot you want to use.

    Now I am going to H1 strategies and I will need to select another 50 out of the 99. Obviously I will not select, but I will exclude I will just remove these losing recent strategies. You can see the strategies, so they stay above 100 000 still profitable. But there were losses during the last month during I did test trading strategies.

    And I want to remove these strategies. Because this is the test of the last one month that I’m doing. And you can see how nicely it shows the strategies that are losing recently. I better do this thing here instead of doing it into the demo account or worse to place these strategies on a live account. And they will just start losing according to the latest data.

    Because, what you need to understand, is that these strategies doesn’t mean they are not profitable.

    They are not profitable just simply with the recent historical data of the last one month. And this is very normal with cryptocurrencies. Because they are more and more volatile. And what I was saying is that we need to use the strategies that are showing profit recently.

    And actually by placing the 99 on the demo account, what I will show you and selecting the top performers at the current moment is the only way that we can see while we test trading strategies are those that are making profit according to the latest history data.

    According to the latest movements and market conditions. I keep removing here because you can see these strategies are simply having losses recently. Now here a little bit things are changing and improving. So, on the sixth page I see some strategies that are having not such huge loss recently but still losing, so I’ll just keep on removing these strategies:

    Filter the EAs
    Filtering the strategies

    Also, this one I don’t want to have it as well, this I will remove. And what we have here let’s go to the fifth page, actually this is at 50 strategies. You can see these strategies recently they’re just going up and down, up and some down but not really huge drawdowns at the end. There are some but this is actually very normal move and drawdown in a strategy.

    Simply on H4 diversify the risk between H1 and H4.

    If H4 continues doing better for you, for example as it shows on the profit lines here, simply the top performers will be on H4 and you will use H4, so I want to give you the choice here if you want to trade on H1 or on H4. And obviously, you will see a lot of movements there, you will see how the Expert Advisors are changing and how actually some are having more profits than they had during the test of the trading strategies, some are having losses more than they were having before.

    So, our job will be to monitor.

    This one, you can see huge period of time is going down and I will remove it. I have here 49 strategies for the H1 chart I will download this collection to make sure not to lose it or to delete some strategy by mistake and as well I will download the collection for H4 charts:

    test trading strategies
    Download the strategies as EAs.

    Now, what I will do after I am done with the test trading strategies?

    I will export the strategies and I will place them on the demo account but you can see it how I`m doing that in the Ethereum trading course + 99 Algorithmic trading robotswhich you can find on our website!

    Thank you very much for reading! If you have any questions you can always ask me in our FORUM, where we have a special topic about the Ethereum course which is called “The Ethereum trading course is live”

    If you are interested in more cryptocurrency courses you can visit: https://eatradingacademy.com/tracks/cryptocurrency-trading/

  • Learn to Trade – Identify the Trend and Have a Strategy

    Learn to Trade – Identify the Trend and Have a Strategy

    Today I will talk about how important it is to learn to trade before you risk real money on the market. In the Academy, we’ve noticed that more than 95% of the people that come and buy our courses have lost money and after that, they realize they need to learn to trade.

    Take time to learn to trade

    Trading is like everything else. Riding a bicycle, driving a car, you need to learn to do it before you start doing it. Unfortunately, most people jump into trading without any idea. Just what they heard on the news, or maybe some friend told them that the Bitcoin is rising and they want to buy Bitcoins whether or not it’s the wrong moment, wrong money management, so many things can go wrong. You really need to know what you’re doing.

    You need to learn to trade. Don’t hurry to risk money because this is money that you worked hard for I believe. Spend time to take online courses like what we have in the Academy or read books.

    On YouTube, there are also many free videos that you can learn from.

    There are lots of YouTube videos to learn about Forex trading

    And in this lecture, I just wanted to let you know how important it is to learn to trade before you risk real money. It’s the number 1 thing you need to do. Don’t skip it. You will never regret it if you learn to trade before risking any real money.

    Learn to trade – professional trading education is a must before participating in the markets

    Now, I will show you what means the trends with Bitcoin, how we identify it, and why we are looking at the current moment actually only to buy the Bitcoin because simply it’s going up. Many students turn to the academy because they want to learn to trade. And we do our best to provide professional education before the student starts trading with real money.

    If I go to the daily chart in MetaTrader you can see that it reached record highs and we actually had one very good example that I wanted to show you. You can see it in the course Bitcoin trading robot course – Cryptocurrency never losing formula.

    learn to trade with the huge trend
    Daily chart for the Bitcoin

    What means trend and how we identify it

    In simple words, this is a Dow theory. It was created a century ago and it’s common until the moment and it’s very useful. We use it a lot in the Trading Academy and it’s useful as for the Forex, as for the cryptocurrencies. It was created initially for the stocks, a long time before there was internet even. But these theories and indicators, most of those things were created long, long time ago when everyone wanted to learn to trade. And the basics of trading were laid down.

    But some of those are applicable to nowadays and of course by having the Expert Advisors, the automated strategies, it’s easy to combine them to trade fully automatic or semi automatically, just what we are doing in this course.

    The trend for Bitcoin is very strong up

    And how we identify by Dow theory. We have that we are in an uptrend when we are having series of higher highs and higher lows. Actually, I have explained this already in one of my other courses Bitcoin trading-the never losing formula. And pretty much I will just go over it one more time here for the new. For those who don’t have the previous course and want to learn to trade with this system.

    But anyway, you can go over it just to make sure you’re not missing anything. Basically we are having series of higher highs and higher lows. Let me put it this triangle over here. This is one high here, actually we have another high, let me just take another triangle. You can see here was another high.

    Simply the price formed kind of top, kind of high over here. Another one over here and then we have another one over here. I will put it as well over there. You can see one here, once was formed here and then there were new highs here.

    higher highs
    Higher highs with the Bitcoin

    All of these, guys, these highs forming series of higher highs. Meaning that one is higher than the next one. And this one that I will show you just right now is higher than the previous one.

    It is a series of higher highs and we have two more highs.

    You can see one here and then we have another one at the end. And just today and the previous days, actually yesterday on Monday the price formed this huge gap as you can see here. Which normally identifies really strong movement that is coming up. But that’s a little bit more about the gaps. I’m not going to talk about that now.

    Here we can say that we have a high even not finished because it can be much higher. I don’t know where it will go, nobody knows. Bitcoin is just surprising us daily and that’s why we are focusing on it. And that’s why we are trading on it. What we have as well is we have series of higher lows. In order to learn to trade, you need to learn to identify those.

    Let me put another triangles here. I’m not going to show all of those but you can easily see-we have one here. Don’t pay attention, guys, to the form of the triangle that I’m having. I’m just putting in randomly doesn’t really matter. I just want to focus your attention on the highest highs and the highest lows.

    So, one more time I will pick the shape of a triangle and I will place it over here.

    You see the series of higher highs and then we have series higher lows.

    This identifies that we are in an uptrend and since we are on uptrend, we are looking only to buy the Bitcoin. And we will use the strategy that I will show you in the Bitcoin robot trading course. The Expert Advisor actually that you will receive in this course in order to open for us the trade automatically.

    That’s quite a difference from my previous course where we are using counter trend lines in order to enter. And you need to spend a lot of time in front of the computer and actually to follow it. It’s pretty nice strategy I’m still using it of course and combine with the never losing system works great. And I always suggest that method to as a way to learn to trade. Because it gives the best entries on the market.

    The idea here is that with this course I want to do it semi automatically. I want to show you how it could be done and it’s very easy. Because the Expert Advisor will open the trade for us, and then we will handle it, and then we will manage the trades. And opening trades with EAs is the easiest way to learn to trade. Because we see how it needs to be done

    We don’t need to stay in front of the computer to look when to enter. The Expert Advisor will do this for us. I will explain you exactly what is behind the Expert Advisor, what is strategy there. And combine with this nice trend at the moment that we are having. It’s a really great opportunity. I just recorded a couple of hours ago this nice, nice example here, where I had another $210 as a profit, very easily.

    You can watch the trend on daily or on a weekly.

    learn to trade n weekly
    The weekly chart confirms the trend

    Of course  you will see one huge top here, another one here, one bottom here. And this one can be considered as one huge top. You can basically do it like that. It’s this one is another top and then you have, let me try to move it.

    This is another top and this is another top. Here we have one bottom, second bottom and actually there is no another one. You can see the recent weeks, guys, this recent month period how volatile is a Bitcoin, a great time to learn to trade.

    You can see the candles and the bars are just huge compared to all these weeks. Because these bars over here are another week. But during this time actually Bitcoin was not so volatile.

    The volatility actually made me create this course, guys, for the Bitcoin.

    Because it’s a great opportunity there in the market, we need to take it, and it is easy to learn to trade with it. Very simple when there are easy money to take don’t hesitate to take them and to trade.

    And a lot of people are saying that this is a balloon that will crash, it will go down, I don’t care if it does. Well done! I will sell it and I will show you how we are selling it. If at the next moment it’s not very interesting anymore I will record courses for the thing that is interesting.

    For the thing that actually is volatile because there is always something on the market to be traded and there is always something on the market that you can make profits of even when you learn to trade. At the current moment this is the Bitcoin, we are doing it and I’m sure you can do it as well.

    Make sure you learn to trade it and if you have any questions, guys, never hesitate to ask in the Forum

    The opposite thing, just quickly at the end if the price reverse and it forms a series of lower highs and lower lows we will be looking than to sell the Bitcoin because this would be a downtrend. We are having this thing over here quite quickly, you can see two series of lower highs and lower lows. But let me just find the good downtrend that we had with a Bitcoin. I will need to zoom out a little bit to make it faster.

    there is the down trend
    How a down trend looks.

    What’s the right here, you can see this high was lower than this one. Then we had another lower low, another lower high formed, another lower low formed and so on and so on. If there is another period like that of the Bitcoin it`s a great opportunity to sell it. Because you can see it lost more than 50% of this value during this time in September 2014.

    If it happens again, guys, there is a strategy, very same strategy you just need to change the Expert Advisor to sell instead of to buy and there you can go even on the short side, on the selling side and that’s the beauty by using Meta Trader, by using Expert Advisor, and by using this kind of brokers where you can buy and sell and you’re actually trading on the value of the asset. This is the proper way to learn to trade on the markets.

    We continue the article with the setup for the system from the Manual trading course and what exactly you need to learn to trade with it.

    In order to show you how exactly we execute the trades and what exactly we do I will show you one example now with the previous counter trend line that we had and it was from this top over here. This way it will be easier for you to learn to trade it.

    Make sure it is exactly on the top and I’m going down to H1 when I’m executing the trades and placing the buy stops. So, one more time when you’re on the H1 make sure you have placed exactly the counter trend line. You need to go back a little bit in time and start. You can see what is the difference. Because on a daily you cannot put it precisely and when you go to H1 make sure you do it precisely. And this was the recent top that I will be using over here.

    Let’s see which one is higher. So, the high of the negative bar is 4674 and this one is with 4674.98. So, 78.98 very close, I need to put it on the higher one. This was by recent high. And I will show you what was the execution of this trade exactly. At this moment I have the important levels, I don’t have any important level here and what I have is the price getting close to my counter trend line.

    Here is the entry.

    learn to trade at the right moment
    The entry is very visual. Clear chart.

    Every day I placing a buy stop above the counter trend line. Because I don’t know at which moment this volatility will come. When I see the price getting close to the counter trend line I put a buy stop and with the time I just move it lower, lower but keeping it above the counter trend line. My entry was 4010, let me put it exactly. And I will put it actually with the green color, so you will know that this is my buy stop at this moment.

    Right here I believe it was nearly on these bars right here I have placed my buy stop, I have dragged lower to 4010 and simply with this buy stop I have placed my Take Profit at the level of 4220, so it’s right over here. I’ll put it exactly as a number, so you will know exactly where is it. This is the simple system, guys.

    When the price is getting close to your counter trend line and there is no any important support or resistance level over there every day I am placing a buy stop and I’m actually dragging it lower until the moment the volatility comes because I don’t know when this will happen and I cannot stay in front of the screen to wait for it, and most probably I will miss it. That’s why I’m using the buy stop. And in order to learn to trade, it is reconcilable for you to use them too.

    And for the new traders what is a buy stop?

    buy stop menu option
    Buy stop menu

    I will show it very quickly when you click right button on the trading there is a new order. This is the type of the order:

    • it could be the market execution. Market execution is if you want to enter in the market at the moment;
    • it could be a pending order. Pending order is if you want to place a buy limit, sell limit, buy stop and sell stop.

    Simply, in this system we are going to use a buy stop.

    This actually means that you need to place a higher price than the current one. At least I need to enter here 4200 you select the volume, stop loss, we don`t use in this system and the Take Profit we have at $210 higher. It would be $4410.

    For example if I choose to place it above 4470, above my counter trend line currently and above my important resistance level I will place my Take Profit at the level of 4680, $210 higher.

    Probably, you are wondering why there is no stop loss,and this is normal because many mentors will tell you to learn to trade with a SL. And probably you wonder  what would have happened if I entered here and the price go negative? 

    And this is the thing that I will show you in the course, guys.

    In the course I will change your trading, you will see a formula mathematically proved that you don’t need to use the stop loss but you will use only a Take Profit. And I will prove it to you with a formula with pure mathematical calculations that you will end up always on the profit or worst case scenario you will end up on break even.

    It will change your trading forever! Learn to trade it!

    And I will show you something that will totally change your trading, totally will change your thinking about the markets and you will understand how actually the big institutions and big players are trading without the stop loss, and how they end up always on profit or worst case scenario again I repeat break even.

    This means that you will be either on 0, either on a small profit or you will be at $200 of profit of 1 lot. And of course if you are trading with 0.1 this would be $20, so it depends on your capital and if you are trading of course with 10 lots then you should be ending with $2000 of profit.

    If you want to enroll into the courses you can find them in the section Cryptocurrency trading on our website.

    Thank you for reading! You can expect our new article very soon. If you have questions please write in our Forum.

  • What is a Pip in Cryptocurrency Trading

    What is a Pip in Cryptocurrency Trading

    What is Pip? The difference between Bitcoin pips and points

    What is a Pip in crypto trading? This is one of the questions I get from the students very often.

    Pip, short for percentage in point, is a unit of measure used in the trading of currencies, cryptocurrencies, and other financial instruments. In the context of Bitcoin trading, a pip is a unit of measurement that represents the smallest change in value that a Bitcoin can experience.

    Hello dear traders, my name is Petko Aleksandrov from EA Trading Academy, and in this lecture, I will make it clear what is a pip and what is a point. But I will talk about Bitcoin pips and points.

    I had many students asking me is what is pip, is this in points, how many points is the spread, the swap, and I want to make it clear for everybody.

    Therefore probably I will update some of the courses that I have ready, but the difficulty here comes with the cryptocurrencies mostly because these are the ones with a huge spread, and some brokers are having after the second or the third digit.

    So most people do not understand what is a pip in cryptocurrency trading because they do not look at the price in detail. And Pip Bitcoin is harder because Bitcoin is expensive.

    How to calculate Bitcoin pips?

    One of the tools that traders use to calculate the value of a pip is a pip calculator. A Bitcoin pip calculator is a tool that allows traders to determine the value of a pip in terms of the currency that they are trading. For example, a trader who is trading Bitcoin against the US dollar would use a Bitcoin pip calculator to determine the value of a pip in terms of USD.

    Calculating the value of a pip can be particularly important for traders who are using leverage to trade Bitcoin. Leverage allows traders to trade larger amounts of Bitcoin than they would be able to trade without it, but it also increases the risk of losses. By calculating the value of a pip, traders can determine the amount of profit or loss that they can expect from a trade and make informed decisions about whether or not to enter a trade.

    In addition to calculating the value of a pip, traders may also need to calculate the value of a point. A point is a unit of measure that is similar to a pip, but it is used in the context of trading instruments that have a higher degree of price precision. For example, some Bitcoin exchanges quote the price of Bitcoin to five decimal places, in which case a point would be equal to 0.00001 BTC.

    But I will explain that in detail below in the post.

    • 2 digits after the crypto decimal comma that is a Bitcoin pip
    • 3 digits, that is a point

    Also, for the currencies, most of the brokers have five digits, some with four still, but anyway, I want to make it clear what is a crypto pip for everybody.

    To make it clear what is crypto pip, we need to know what digit is?

    If you have a price of 12345, this means you have 0 digits. And we are talking about the digits after the decimal comma.  So, let’s say this is stock. And the price is 12345, and there is nothing after that, there is no .05 or 0.5 nothing. It is a whole number, meaning digits are 0, pip is 1, the point is one as well.

    When there is nothing after a point, so if there is no point at all, there are no digits. Said what it is after the point, after the comma or whatever you call it is called digit and in this case, the Bitcoin pips equal to the point.

    what is pip in the price

    The next example is when you have “.3”, for example, after the number. Usually, nowadays, you will not see such prices with currencies, with cryptocurrencies, or with stocks and commodities.

    This is because, on the online trading platforms, we have a minimal difference between the bid and the ask prices (the buy and the sell prices). Not like in the bank, when we exchange currencies for a vocation, you pay a lot for that huge difference.

    Try asking someone in the bank, “What is Pip?”. They do not know. They do not know that there could be such a small difference between the bid and the ask prices.

    Now, if you have already trading experience, you know what I am talking about. But if you do not have, let’s have some more examples so you will have a better idea about it.

    You already have one digit, so basically, this is your digit.

    And in this case, you have pip 0.1, and you have point 0.1. So, when you have only one digit after the point this means that the pip and the point are equal.

    pips an points

    The next case is when you have two digits after the point, so 120.12,

    Now the pip equals the point.

    what is pip in JPY

    This is the most common case for Bitcoin pips:

    bitcoin crypto pips

    As you can see the crypto Pip equals the points because there are just 2 digits after the decimal comma.

    And the next case is when you have three digits after the point. This comes typically for the USDJPY at the moment or any of the JPY pairs. We have three digits, and here comes the difference between the pip and the point.

    So, 12 pips and 3 points-this is how we say, we pronounce the price as 120.12, we usually do not mean the point, but this is the smallest change you can see on the price. Here already we have three digits, we have pip of 0.1, so 12 pips and the point is simply the last one.

    Here already, what is pip? It is ten times bigger than the point.

    three digits

    The next example what I will show you is when we have four digits, let’s say this is the price of EURUSD, it doesn’t matter what example I would take, but it is a currency. You will see four digits after the point and here basically, you do not have a point because the point is equal to the pip.

    Here at 1.2345, you have your pip as 45, and point is as well 45.

    The point is here, but it does not make any difference from what is a pip.

    four digits

    And the next line is now what you see with most of the brokers where we have pips, and the last one is the point.

    In the old days, guys, all the brokers were till the fourth one, till the fourth digit, and the pip was equal to the point. Of course, at that time the crypto Pip was not there to confuse the traders.

    And now because there are so many brokers on the market and because of the huge competition over there most of them started providing spread lower than one pip.

    And because there was nothing before lower than one pip, they created the point.

    nowadays digits

    Now often, you will see brokers providing you spread 12345 points. Which of course is good for everybody that is on the trading side, because you are paying less spread. Right here, when you have five digits, the price is 1.2345 pips and 4 points, but we usually do not say the 4 points when you pronounce the price. But the points are there and

    The pip is ten times bigger than the points.

    An easy way to remember it is when you have three digits and five digits are where you have the pip ten times bigger than the point and when you have two, and you have 4, you are having pip same as a point.

    You can say there are no points, or you can say that pip is the same as the point. I hope it is clear.

    And for the Bitcoin pips, if there are 3 digits behind the crypto price only then we will have a point. But if there are just 2, that is a Pip Bitcoin.

    I do not think you will find a broker nowadays that will show you a one-digit price or without digit price, but I just made it this way, so it will be easier for you to understand me.

    And the next question is about the spread, the swap, the Stop Loss, and the Take Profit.

    what is pip is spread, SL and TP

    If you have spread and swap, usually the spread and the swap are in points or USD or any other currency.

    For example, you can see some of the brokers for the cryptocurrency trading provide swap negative of $25, and there are no points to calculate there, or you can see it as well in points, but the spread nowadays is mostly in points.

    Of course, there are brokers with a considerable spread. Simply you can stay away from these brokers.

    So what is the pip in cryptocurrency trading broker? It is the measurement of spread and swap

    And the Stop Loss and the Take Profit it’s generally in pips, could be in points as well but especially the software that we are using, for example, EA Studio works with pips and FSB Pro works with points.

    This is how you should work with such pieces of software if you are, and this is how the prices of the stocks, of the cryptocurrencies, of the regular currencies are basically structured.

    I hope it is clear what is Pip in Cryptocurrency trading and you already know how to calculate Bitcoin pips, guys, thank you very much for reading.

    If you are interested in the Cryptocurrency algorithmic trading course and you want to know more about cryptocurrencies, you can find it on our website. All our cryptocurrency courses you can find in the section cryptocurrency trading.

    In summary, a pip is a unit of measure used in the trading of financial instruments, including Bitcoin, that represents the smallest change in value that the instrument can experience. A Bitcoin pip calculator is a tool that traders can use to calculate the value of a pip in terms of the currency that they are trading, and a point is a similar unit of measure that is used in the context of instruments with a higher degree of price precision.

    Last but not least, check out our article about pips in forex trading if you are curious to learn a bit about this topic.

    Pip stands for a point in percentage. This is how traders measure the change of any asset or currency pair. A smaller movement than the pip is the point.

    The currency prices normally are with 5 digits after the decimal comma. The 5th digit is the point and this is the smallest movement measured in the price. The Pips are the 3rd and the 4rt digits.

    This depends on the broker or the exchange that offers the cryptocurrency. Most providers offer 3 digits after the decimal comma. The first 2 are the pips and the last one is the point.

    If we divide the exchange rate by 0.0001 we will see what is the value of 1 pip in cryptocurrency trading. In other words, this is the smallest movement possible.

  • Bitcoin trading with 99 EAs – How to follow the results

    Bitcoin trading with 99 EAs – How to follow the results

    Bitcoin trading has become most popular after everyone saw that it is not one way ticket to the heaven.

    Bitcoin trading is suitable for nowadays market behavior because people can benefit from selling it. The Bitcoin showed that is just a currency. In this article part of the Bitcoin trading algorithmic course from Petko Aleksandrov, you will learn how to trade with 99 Robots for the Bitcoin. And how to follow their performance.

    Hello dear traders, it is Petko Aleksandrov from EA Forex Academy. And I am going to share with you the results from the demo account. Where we have placed 99 robots the last week.

    I have waited like one week, I think a little bit longer even. You can see that currently I’m having $306 as a profit. There are many open positions and you can see as well that I have $103 000.

    This demo account have made more than $3000 and currently I have some more profits that are not closed.


    bitcoin trading results
    Bitcoin trading results

    The idea here, guys, is that this whole portfolio as you can see it’s making profit. These 99 Expert Advisors are currently making profit. But what I want to do, is I want to take the top 10 performers. Out of this 99 and to place them on a separate live account.

    Because obviously during this period of time there were some losses as well. And I will show it to you now how we follow their performance. I want to place only the top 10, the top Bitcoin trading performers on different accounts.

    In order to follow that we go to you one website that it’s called FX blue. And keep in mind, guys, we’re not connected to any of the websites. We use it just to follow their performance of the Expert Advisors. There are many things in this website.

    So, what I do?

    bitcoin stats
    Website that we are not connected to

    I click on FX Blue and here is the username and the password. I have already registered for the demo account but I will show you how you need to register. You see here is the button register. The first one for the account synchronization and since I am going to Meta Trader 4. If you go to Meta Trader 5 for example, and I will suggest you, guys, to stick with Meta Trader 4.

    Because Meta Trader 5 a lot of mistakes there, still not fixed. We’ve receive some reports about mistakes on Meta Trader 5 and you can read much more about it over Internet.

    But personally me our team is focusing on Meta Trader 4 when it comes to Bitcoin trading.

    When I click on register you will see here there is broker server. You need to select the server of the demo account because some brokers have several servers. You select the server, you write down the account number. And the read-only password that you receive when you register.

    Basically this is the investors password and then you write down your e-mail. You agree with the terms and conditions, nothing really special there and you click on register. And your account, your demo account will be connected to this website. When I click on login you will be into the account synchronization.

    After that I click on statistics, you see here is the exactly the dates. Because I really don’t remember when exactly I place it but we have history of 10 days. I have monthly return of 7.3% of our weekly return of 1.7 %, profit factor 1.24. And here I had the floating profit which is $300 and here is your balance and equity. So, what we care about is the strategy.

    I click on strategy and here you see the performance of the 99 Expert Advisor, guys. There is so many statistics here that you can follow for your Bitcoin trading or any other asset:

    • number of trades for all Expert Advisors
    • gross profit
    • gross loss
    • net profit for the Bitcoin trading
    • profit factor
    • winners
    • losers
    • how many and how long time they went.

    You can see here, there is:

    • the longest
    • the shortest
    • the best rate
    • the worst trade

    there are so many statistics here, guys.

    You can look in details-there is average profit, there are consecutive losses, consecutive profits. And it is only strategy, there is so many other ones, like the trading hours. You can see during which hours you are making most profits, on which hours you are losing and so on, and so on. Days, weeks, direction up and down.

    I can bet you, guys, that when it is going up making profit, it is. And when it is going down, it is making a loss, simply this is the Bitcoin trading at the moment.

    Lets go back to the strategy and what we focus, guys, is the Net profit.

    I click on Net profit and I arrange the Expert Advisors in a way that I will see the ones that are making profit on the top. And the ones that are making losses at the current moment. I want to place in my live account only the ones that are making profit at the current moment. I want you to remember that:


    Bitcoin trading results
    Results from the Bitcoin trading

    At the current moment, because this is the only realistic thing that we have there is no past performance that can guarantee you actually future performance. I said that in the disclaimer in the beginning as well. But there are people that are focusing so much, so much in back testing. They do so many back tests, they pay money to companies to provide history data.

    And they take this tick data, tick data, there is no such thing in Meta Trader. Even in the tester you can see that there is a tick data. But just remember from me tick data in Meta Trader is illusion, there is no such a thing,

    The only thing is the open price and all of our Expert Advisors.

    Just to give you a quick look what I’m talking about in Expert Advisor. If I go to strategy tester each Expert Advisor you can test it for a current period of time. And with model you can choose 3 options- every tick, control points and open prices only. This is the only realistic thing that you can get from Meta Trader. Tick data is illusion one more time I repeat and I’m not going into details. Just don’t waste time to do tick data history back testing and especially to buy such history data.


    Bitcoin methods
    Methods to backtest a strategy

    So, I continue now. Let’s go back to the website, just to open it from the other page. And what we have you can see here, you can see the profit factor of the first Expert Advisor, guys, it’s 12. This is really nice.

    It made 281 profit and it had just $21 of loss.

    It’s really, really nice Expert Advisor at the current moment that is catching this huge volatility at the Bitcoin trading. At the moment you can see just reaching new tops, guys, 10 911 and it’s going up.

    You see, what we are doing here, we are not trying to predict anything. We are not going to tremble, is it going to go more further up, is it going to go lower.

    What we do now?

    I will show you how to take the 10 top Bitcoin trading Expert Advisors from the 99. So, we have one, two, three, four, five, six, seven, eight, nine, ten. The Expert Advisor ending on 773 is the tenth one.


    Results in trading
    The best EAs for Bitcoin trading

    So, what is the idea here, guys?

    The idea is that I want to trade the top 10 Expert Advisors that are making profit at the current moment. Doesn’t mean that the others are not profitable. Just these 10 are making much more profit than the other 89.

    And I will just keep refreshing that. For example tomorrow at the same time if I see that Expert Advisor 884 went here and this one came down I will remove this one from the trading account, from the live account. And I will replace it with the one below, the one that took its place. It could be that 2-3 will go down, 2-3 will go up.

    We always keep on the live account the top 10 performers, the top Bitcoin trading Expert Advisors. And it will change all the time. This is the work that you need to do during the day. To have a look at it, to see which one change places, which one on the top and to replace them. You don’t spend the whole day, guys, the Expert Advisors are trading for you.

    You just need to follow their performance.

    And basically you can do it the way you want.

    This is just an example for the top 10 Bitcoin trading strategies for this course. But here I will leave it a door open for you. It’s your choice whether you want to trade the top 10. It’s your choice you want to trade the best one. For example, the second, the third comes on first place you will remove the best one. And you will replace it with the other one.

    In this way we are trading, one more time I say, the Expert Advisors that are currently at the present moment making profits, guys. And not that ones that show better back test and so on, and so on.

    Yes, we use the back test, we use it to create the strategies, we use it as I showed you to test so many strategies for the last 1 month, to see which one are keeping making profits. And finally we are doing one more huge test by placing these 99 Expert Advisors on a demo account. 

    We choose only the top Bitcoin trading Expert Advisors, you can choose the top 1, top 2, top 3, top 5, top 10, top 20, if you wish, doesn’t matter.

    The question is that we have so many Expert Advisors, you have so many Expert Advisors already 99. You can place the top performers on a live account. Actually I will suggest you, guys, to do this on another demo account. Just open one more demo account and for example start with 3 and place them on a demo account. Follow their performance, see which one will change places. If you need to change the second for example with the 51, you replace them, see how it’s going. If you find it profitable I’ll be very happy for that, guys.

    And this is the way, guys, that we found in the Academy to make profits. If you get used to that, and if you succeed to make profits really, really I will be very happy from that. This is the powerful tool actually of EA Studio that we can create so many Expert Advisors.

    If any of those Experts Advisors starts losing you have so many to replace it.

    This is how we solve the problem, you can read all over internet, comments, reviews- “I have bought one Expert Advisor, it worked for some time and starts losing”, you will see this thousands time as a comment. And this is normal because the Expert Advisor didn’t start to lose, guys. I want to make it clear here. It’s not the Expert Advisor starts to lose.

    The Expert Advisor for the Bitcoin trading has a code with the entry condition. And it’s entering every time with the same entry conditions.

    What changed, is the market. This is very important, you can see how the market is changing. And this is what is changing, not the Expert Advisor. That’s why we have hundreds of Expert Advisors if any starts to lose we replace it with new one and the problem is solved. Very, very easy.

    Of course, guys, took me years to come up with this conclusion. I’m happy I came up with this conclusion and I’m happy sharing with everybody. And really hope you will, guys, succeed to make profits.

    Let’s move on what we have, I want to take the top 10 Bitcoin trading experts. Take a pen and a paper and write down the number of the Expert. So, the number is 33685704. Of course, you don’t need to do it right now, guys, when you’re watching.

    But you need to do it after that when you have your statistics and when you actually you are practicing that. It’s easier to write it down on a piece of paper. Because now I will go back to the Meta Trader. I’m going to File and then I click on Open data folder and I am going to MQL4, then I’m going to Experts.

    You know already that all the Expert Advisors are in this folder, so what I do?

    Expert Advisors
    Easy way to place the EAs in Meta Trader

    I right click, and I will create one folder that says top 10, for example. If you decide to trade only the top 3 performers you will name it like that. It is up to you.

    What I will do now? I press CTRL + F, I write the number 33685704, in order to find the best Bitcoin trading robot so far,  here it is.

    easy to find with Magic number
    Press CTR+F to find the strategy with the Magic number

    I click on copy and I will close this search box and I will place this Expert Advisor in this folder. Simply, this way by the search box, by the number you can find. Anyway, it will be really hard for me to look in the 99 Expert Advisors where exactly is this top performer that is making currently such great profits with profit factor 12.9.

    Profit factor 12.9 for Bitcoin trading is something you will see very rarely.

    I’m going to the next one, so it is 34274793. And again I’m going to the Meta Trader and I press CTRL + F and I write it down. So, it’s 342274793, here it is. I’d copy that one as well make sure to copy, not to cut it. Because if you cut it, actually you will remove it and it will continue trading on your demo account. I place it over here and this is the way that I select the top performers out of the 99.

    When I have the 10 here, I will copy all of these and I will place them in the separate account. The same way that I have already showed you for the 99. I’m not going to do it right now. Because I don’t want to get boring with the video, to do it one and the same 10 Expert Advisors. But basically this is the thing we are doing. I will just summarize it.

    What we did we connect it our demo account with fxblue.com. One more time we’re not connected to this website with any reason. Just a lot of statistics here that we can use and that are very useful. We are focusing on the Net profit, we arranged the Expert Advisors, the strategies by the Net profit. Because this is at the end of the day the most important and

    then I’m taking the top 10 Bitcoin trading strategies.

    I find them in the folder where are the old Experts and I will place these Expert Advisors in the live account.

    One more time, I suggest you open a separate demo account and practice this method for Bitcoin trading for some period of time like one month, two months, three months. Basically, you will get used with that and just go to the live account when you feel comfortable, when you feel safe and when you feel ready.

    The question, guys, is that by using these Expert Advisors, by following the statistics and selecting the top performers what we do, is we avoid the emotions.

    Because, guys, so many people are losing money nowadays with these cryptocurrencies, because they trade it manually. They just buy it somewhere and it’s so hard to predict what will happen. You can see what a drop we have just in one hour, actually this is in 30 minutes time with the Bitcoin.

    Imagine you have bought it here somewhere, you say for example to yourself OK if the Bitcoin goes to 10 400 I will buy it, you buy it, you place yours top. Can you handle $400 at this moment with a loss? Probably you can but if you have bought 10 Bitcoins here, 10 lots for example, you need to have a stop loss bigger than $400 into your account. And basically it can drop much lower at any moment.

    Of course, it’s going up now, guys. It really we don’t care what’s going on there, we don’t care, I don’t care. For example yesterday the Bitcoin went above $10 000, so comments, so many news, so many talks and talks about it. And people just jump to it without any idea what they are doing.

    This is what we don’t care about, we don’t care if the price is 10 000, if it will go to 20 000 or if it will fall to 5000. Because we are following this system and we follow the Bitcoin trading Expert Advisors. They are trading we are just replacing them with the ones that are currently making profit.

    So we avoid the emotions.


    avoid emotions
    This is the idea in Bitcoin trading with EAs

    There are 2 emotions that will make you lose if you do Bitcoin trading manually.

    • One, is the fear. For example, if you are here on the profit, let’s say you bought the Bitcoin before going to 10 000, now it’s to 10 900 and you are afraid that you will lose this profit and you will close your position or if you bought it for example here and it dropped for 30 minutes with $400 believe me you will get afraid that you will lose and it will go lower. So, people close their positions because they are afraid, they will lose.
    • And the opposite way the people become greedy when they make profit, they want more and more, so they buy more and more and at one moment when there is a loss like that they get afraid, they close everything and they realize that they are on loss.

    I don’t want to get into details about the emotions, but this is how it’s working. I’ve seen it so many times, I have experienced that, guys, to be honest with you long time ago,

    That’s why I realized that it’s so much easier with the algorithmic trading,

    because there is no emotions involved and when there is no emotions involved it’s so much easier.

    Of course, it’s a hard job to be done everything we are doing but it’s easier because we don’t tremble in front of the screen to wonder, to predict what will happen because nobody actually can predict what will happen, guys. If you read some expectations and predictions don’t trust that. Trust your eyes, trust what you see, trust the statistic you see and this is the only way that you can be sure in something in your own knowledge and in your own statistics and Expert Advisors performance that I’m showing you at the moment.

    You will have these 99 Bitcoin trading Expert Advisors and I really hope that you will manage to do it.

    You just keep on practicing. It is a lot of questions all the time how much capital you need to start, guys, really don’t drop me these questions because I will never suggest you starting capital. I probably I said that’s already in the course, I will maybe say it another time and I will repeat it.

    It is up to you, make sure to trade with small lot, so you can start for example with 0.01 because at the end of the day, guys, this is your money, you’re risking, it’s your responsibility and you need to prepare yourself, you need to have a good system.

    I do believe this is a good system for Bitcoin trading because we have already tested it,

    I’m showing you how it’s making profits and trade with it small percentage of it.

    We can see here for example, if I’m trading with 0.10 lot and I have 99 Experts, obviously the maximum that can be opened is 9.9 lots. There I need to have at least account of $15 000 or $20 000, just here I have opened a huge account of $100 000, this is a demo account, so it’s not really matter.

    The idea is that you trade a small percentage, guys, you can see from the 100 000, 97 000 is free. I’m trading with a very small percentage of the whole account and what you need to do, is just simply the same.

    Bitcoin trading results
    Results are more important at the end

    Trade with a very small percentage from your account and actually when you trade the top 1, the top 3, top 5, the top 10 up to you, you will have a very small lot. So for example, if you want to trade with 1 whole lot. You better trade with 0.1 with 10 Experts or if you want to trade all in all with 0.1. For example, you open a small trading account and all you want to risk is 0.1, you can trade with the top 10 Bitcoin trading Expert Advisors with 0.01, so you will have totally 0.1.

    I hope it’s clear and this is the whole idea, guys, here. The whole it is that we diversify the risk on many, many Expert Advisors and strategies and not only over one. Because if one is losing at the current moment, the others at the same time will be making profits and this is how we limit the risk and this is how we achieve this result for such a short period of time by following these statistics you will see even better results.

    Again, guys, be careful, take your time, don’t be in a hurry.

    That’s really a great system that I’m sharing with you at the moment, just make sure to learn it and to practice it before you go to live account. Just drop these top performers on a separate demo account and practice it.

    OK guys, thank you very much for reading. If you have any questions drop me an e-mail at [email protected] and I will be always there to answer you.

    If you wish to enroll into the course you can find it here on our website: Bitcoin Algorithmic trading course + 99 Expert Advisors

    For more cryptocurrency trading courses, please visit : https://eatradingacademy.com/tracks/cryptocurrency-trading/

    Have a great day and always keep Bitcoin trading safe!

  • Forex trading software we use – Cryptocurrency algorithmic trading course

    Forex trading software we use – Cryptocurrency algorithmic trading course

    Forex trading software – algorithmic trading is much easier nowadays!

    Forex trading software and its features are the topics of this article. I am Petko Aleksandrov from EA Forex Academy, and  I would like to give you a little bit more information about the Expert Advisor Studio.

    forex trading software login
    Login to EA Studio

    This is the Forex trading software that we use in the Academy. The other one is the FSB PRO –  where you also have 14 days free trial.

    Basically, the difference between the two is that Forex Strategy Builder Professional works with custom indicators as well. It has higher time frames as filters. For example, if you trade on M5, you can have M15, H1, H4 as filters to enter into the position, and as well Forex Strategy Builder needs to be installed on your computer to use it.

    EA Studio is web-based. It means that you can use it from any browser, work so well with Chrome, and also you can use it on a couple of windows, so you can run 3, 4, 5 generators or reactors at the same time. And an Expert Advisor Studio as well works with the indicators from Meta Trader 4 only with those, that why it’s quite faster. Said the strategies, the code for the strategies it’s much more simple.

    The other thing is that we have this powerful tool here, the reactor, which makes all of the processes automatically, but I will explain in detail a little bit later. The thing here is you have another 15 days free trial for EA Studio. You can register as I have explained in the previous lecture.

    what is the software
    Preview of the trading software

    What is Forex Trading Software?

    Let’s make it from the beginning, so we used Forex trading software to create strategies that are automated,  which have rules to enter like long entry, long exit. What are the rules to enter in an extended position, what are the rules to exist in an extended position, and you can see the result immediately. And we can export these strategies as Expert Advisors with this Forex trading software. So, we don’t need to pay for developers.

    If you pay to any IT company or any developer like a freelancer, it takes a lot of time, guys, it cost a lot of money as well!

    I have done that already. It was a very horrible process for me. I was working for this risk company as an institutional trader. And one of my jobs as well as to communicate with the developers to automate the strategies that we were using. Basically, we were sending these strategies to them manual explanations, so they were trying to do it automatically.

    code behind it
    The code behind the strategy

    It was taking so long time nearly 2, 3, 4 weeks and the cost of this is quite expensive as well. A usual Expert Advisor with 2, 3, 4 entry conditions are somewhere between $200 to $500, and it’s full of mistakes. At the end of the day, when we were trying to use this software for trading, obviously, there were a lot of errors.

    We avoid now the whole process with this developers’ thing, which I had a bad experience with. And what this Forex trading software does is to export the ready strategies with one click, which is fantastic, really quick.

    How does this Forex trading software work?

    Let’s say you choose a strategy somewhere from the internet. You like the strategy, nice name, nice Profit shown over there. And there are some entry conditions, some exit conditions. They show you what the Stop Loss is, what is the Take Profit when you should enter and so on, and so on.

    And what do you do?

    You learn this system, and you start testing it. On a demo account usually. After sometimes you see that the system is not so stable something is missing, you should try another thing. You should add some indicators and so on and so on. If you use this system over here, the one that you choose from the internet you can add your entry conditions over here.

    Let’s say we are having this system where the moving averages are crossing, which is very, very famous. And we have two moving averages with a period of 12 and 26. You click on accept, and this is the fantastic thing here with the Forex trading software.

    You see the result immediately.

    immediate results
    Results are shown immediately

    Let’s say your system is having Stop Loss of 30 pips and Take Profit of 90 pips, so it’s 3 to 1. And you see the result immediately. So, this is what I’m talking about.

    When you test the strategy manually, first of all, you don’t know what is the result. Because they show huge profits, but you don’t see the exact results with the time. Right here, with every change you do for the entry or the exit condition. You see it immediately on the balance chart and as well every change you do to any of the indicators. Let’s change, for example fast moving average to 20, you click on accept, you can see another horrible result.

    Just now, I took an imaginary system, I put an entry condition, I put Stop Loss and Take Profit, and I saw the results. I didn’t spend weeks to test this strategy to realize that it’s losing strategy. And this result it’s very real as you saw at the beginning of the course. Where I’m explaining how to import the Historical data for the Forex trading software, you should understand that if you backtest it on Meta Trader, you will receive the same result over there.

    This is the thing if you want to make your strategy automatically. If you have an existing strategy simply you can put the rules over here:

    • the entry rules
    • the exit rules
    • the Stop Loss
    • the Take Profit

    You can add few entries, and you will see the result immediately. On the indicated chart, you can see where the trades were executed, where they were closed. You can see here we have this short trade after two moving average cross.

    This is up the indicated chart you can see as well the Journal. Here are the orders that were executed, the positions, and you can see exactly the prices and the Profit. And you can compare it as well with Meta Trader. But if you have imported your history data correctly, it should match 100%.

    And the other one is the Stats info provided by the Forex Trading Software.

    stats for the Forex trading software
    Detailed statistics are vital in trading

    You can see precisely in detail how many counts of trades you had, how much was drawn down, how much the average Profit per day, and so on, and so on. And this is very, very important as well. Because if you test the strategy, manually you’re not testing 24 hours every day. You will check it a few times during the day. You will open a couple of trades, and you will make a conclusion that is not 100% correct.

    Simply because you’re not in front of the computer all the time. I’m talking here, of course, about the strategies that are not connected with any trading hours. What I mean is that by this software simply we save a lot of time about testing the strategies. And about exporting them as Expert Advisor, so you don’t need to pay to any IT developer.

    The next thing in the Forex trading software is the generator. A generator is a powerful tool from EA Studio, which generates strategies for you. Let me log in, and I will show you what I mean. It has two different options. One is the generator, and the other thing is the reactor, the validator is quite different.

    The generator uses the predefined data source that you uploaded.

    You select a symbol that you wish to trade. Let’s use, for example the cryptocurrencies because this is what we are doing over here and you choose:

    • the selected period
    • the period you want to trade
    • the time frame that you wish to trade.
    Forex trading software inputs
    Redefine the rules for the strategy

    Here you define:

    • what strategies you want to have
    • how much should be the Stop Loss
    • how much should be the Take Profit
    • do you want to use Stop Loss at all or not, or you want to use only Take Profit for example
    • what settings you would like to have, so working minutes you can set it even as long as you wish.

    I usually set it for nearly 8 hours, so I do it over the night. Let’s say I do it for 500 minutes, how you want to select your strategies.

    Obviously, the net balance is the thing that we want to have more and out of sample, or in of example you can use this tool as well.

    Here you can choose:

    • acceptance criteria, so basically this is how would you like to have your strategies selected
    • how many counts of trades you want to have
    • the maximum ambiguous bar
    • the minimum net Profit and the generator will create plans for you that only fit this acceptance criterion.
    acceptance criteria
    Acceptance criteria for the software

    And when I click start, you can see how quickly this generator is working. These are the calculated strategies. This is like really, really unbelievable in the beginning when you see it. But with the time you can get used to it. And it will generate these strategies only the ones that fulfill the rules that I had set over here. Let’s stop it now. I will not wait until the end. And I have chosen the collections that I have chosen over here from by course.

    Let’s choose this strategy, the Ripple strategy on M15. Once you have generated a strategy, guys, what you do?

    ripple strategy
    Ripple strategy for Expert Advisor

    You go through the Monte Carlo. You go through the optimizer. So the optimizer is the tool where you can optimize your strategy. Be very careful with that because if you don’t have enough historical data, you should not optimize your strategy. And also, if you have these EAs if you wish to trade with these EAs or any EAs, it’s very recommendable for you to optimize the strategy for your broker over the history data of your broker.

    This is essentially important when you buy an Expert Advisor to optimize it. You can do this as well with Meta Trader 4 or 5. But the optimizer and the back tester there is not really reliable. I’m not going to talk about that right now. You can find a lot on the internet for it.

    Said if you want to optimize your strategy, you can do it with the Forex trading software. It’s terrific to do it when you have a lot of historical data. And as well it’s good to use steps higher or rounded numbers for the indicators when you’re optimizing. You will avoid over-optimization.

    Does that mean over-optimization, guys?

    If I optimize this strategy, I will see a better profit line over here. But this is because the Forex trading software will find an input for the indicators that fit the best this period. As I said in this course, I’m not using massive historical data. Because I wanted to do it from your point of view when you don’t have a lot of historical data. To optimize it you need to collect more historical data. Leave your Meta Trader running 24/7. And it will generate for you more historical data with the time going.

    After that, you can optimize it, or once again, I say if you buy an Expert Advisor if you receive a ready Expert Advisor, which was created for the different broker, you need to optimize it for your broker. Make sure it works with your broker. Because really, every broker shows so many different prices every day, you cannot imagine that.

    The next thing with the Forex trading software is the Monte Carlo. This is a very important thing as well.

    monte carlo simulations
    Simulations tests with the Monte Carlo

    Here you can do simulations about market variations, about randomize history data, a randomize spread. If you have a vast spread, it’s very good to test this one. If you have execution problems as well with your broker or strategy variations again to avoid the over-optimization. And you need to see whether this strategy fulfills the Monte Carlo, how many tests you want. From over here you can choose how many tests.

    You can have the validation how the minimum count of trades as well for the Monte Carlo. This is the confidence table, the simulation chart is the one over here. With a lot of tools, with the Monte Carlo, the idea is that if you use the Monte Carlo, it will only try to break your strategy before you run it on the Meta Trader. This is the robustness test we have in the Forex trading software.

    The Multi-Market, guys, is very interesting. Something that causes a lot of arguments between traders of algorithmic trading. I’m not a massive fan of it, and I will explain to you why. Because when you use it, Multi-Market, this is like a test if this strategy that you were having will be trading as well on the other markets. But at the end of the day, this strategy was not created for the different market.

    So, why should it work over there?

    Multi Markets trading
    Testing may market for a second

    This is a huge question we have. But it’s perfect when you have, for example the currencies and you have created a strategy for EURUSD. And you have like 5, 6, 7 other currencies, it’s good to see if this strategy will perform well on some of the others. But if it loses on all of the others, there is probably something wrong with this strategy. But I again say probably maybe there is no. So, we need to find out, and it’s a lot of tools over here you can use to find that out.

    I will show you now. For example, if I click start, you see this strategy works with the Ripple, with the Bitcoin, and the Ethereum is losing. But again, I say this doesn’t bother me because this strategy was not created for these two.

    Simply, you can ignore that when you are testing different markets because, for me, the cryptocurrencies each one is a totally different market. It’s a totally different market, it’s like you compare gold and soybeans. Or Gold and Cable, so nothing in common. Each cryptocurrency is different, the creation is different, prices are totally different nowadays, so it’s a totally different market. Keep that in mind.

    Anyway, Multi Market is a very nice tool in the Forex trading software, so if you have a strategy that performs well on the other market, go and use it on the other market as well. I hope that’s clear.

    So, the next thing we have, guys, the report. You can see the report of each strategy as I showed you here this is:

    statistics for the strategy
    The complete report for each strategy
    • the Stats info
    • the Indicator chart
    • the Balance chart
    • the Journal.

    And what is the OOS Monitor?

    OOS trading system
    OOS is a useful tool in backtesting

    This is something really interesting and nice, something that caused a lot of arguments as well. The idea here is that you can select this green period, and you can test your strategy only over this period over here. I am explaining it very simply. You can see what the result will be after that.

    So for example, if you use this Forex trading software you can divide your period of historical data on three pieces, you can test it on 66% and leave 33% not going like the 30% which is the case over here, and you would see how your strategy performs after that. There are a lot of ways to use that, I’m not going into details now. After our generator creates strategies they go-to collection you can see here all of the collections, you can see the most important information we need, and you can download the whole collection.

    After that, when you import more history data, you upload your collection again, and you can recalculate it with the newest historical data, and you don’t need to run a generator again.

    The next thing, guys, is the reactor-this is the thing from 2017, and that changed the Forex trading software EA Studio quite a lot, and I can say a good job to the developers of Forex software company!

    Reactor process
    A reactor goes through all of the levels automatically

    Said guys, the reactor does the whole thing that I explained to you automatically.

    What you see here is the history data, or you define it again as with a generator, you put your strategy properties, your acceptance criteria with the generator settings. And then, you select whether you want to use optimization. Let’s say we have a vast historical data and you want to use the optimization. After that, you can use as well all data validation, the OOS that I showed you.

    You want to use the Monte Carlo as well, and you want to use the Multi Market as well as I said works well when you have normal currency. You can see all the selected tools that you want to use are right over here. When you click start, guys, what happens is that the generators start calculating strategies. The ones that will pass the validation they will go to the optimizer.

    The ones that will pass the optimization validation they will go to all data validation, they will go through Monte Carlo, to Multi Market and at the end of the day in your collection, you will have only the robust strategies, the ones that passed all these tests and this happens fully automatically, which is nice, guys. This thing, this reactor saves the so much time because it does all automatically, and this is the thing that most of the traders now prefer the Forex trading software EA Studio from FSB because only it saves a lot of time, but at the end of the day the two software are quite different, it depends really what kind of strategies you are trading and what kind of strategy you want to export as Expert Advisors.

    The third thing here is the Validator. What does this thing do?

    forex trading software validator
    Drop any previous work and validate it

    The validator you can see here what does it say, drop files here or click to upload, upload collections, experts, or portfolio experts. If you have collection, let’s say from two months ago you can simply drop it over here you can drop Expert Advisors you’ve created with the Forex trading software a year ago or a whole folders even and when you click to start the validator will validate for you again with the fresh historical data only the ones that are performing, that are passing the validation.

    And you don’t need to do everything over and over again. Once you have your collections, save them in folders, put them in order, put your work in order very important, guys, and after then you need to recalculate those with the validator. This is pretty much about it.

    You have the tools over here for the Forex trading software.

    working hours
    Working hours for the strategies

    You have the settings, the working hour is a new tool from the middle of 2017, only here you can predefine the trading section if your broker is working only till 11:45 and it opens let’s say at 00:30 minutes after that you should put that thing here. If you want to close your trades on Friday at 11:00 a.m. London time, let’s say you can set it from here. And from here, you choose what Account currency you would like to have, what Initial account you want to trade with, what is a Leverage, so try to make it as similar as possible to your trading account with your broker.

    Here are the Acceptance criteria, which I have explained to you. You can use a lot of tools from over here, so you can choose the maximum drawdown you want to have. How many percents, so you should like to have strategies with no more than 10 to 20% of drawdown and so on and so on. Here you can choose what indicators you want to have.

    , you can generate strategies with the Forex trading software only with some indicators that you like and you don’t want to use all of the indicators, so from here, you need to unpick them. And about the data- this is the data horizon how many maximum bars you would like to have in your final test, the maximum you can have it’s 200 000 with EA Studio, which is pretty much enough.

    Trading hours for the strategies!

    control the period
    Redefine the tested period

    And from here you can use as well Use start a date limit and Use end date limit if you wish or the best thing is you use the whole date available, and from data, import is from where you import your historical data and from here you can download the EA Studio Data Export script for Meta Trader 4 or Meta Trader 5 depends which one you are using.

    This is pretty much about this Forex trading software, guys, a really professional tool to export Expert Advisors, to create strategies, to generate strategies and as you know the whole idea in the Academy and the whole idea actually is that we create many Expert Advisors, we create hundreds of strategies, we test them, but we test them first over here with all of the tools.

    The one that passes all these validations we passed on a demo account.

    And after that, we select only the best performers to trade on the live account. If at any moment one of these best performers starts to lose, we replace it with another strategy that is already generated, tested, optimized, and so on. And this way, we are not limited by the strategy we are having. We have hundreds of those, and it’s easy to do it all.

    You need to organize your work to follow the strategies, in order not to do it all over again. But to always trade the best strategies that you have.

    More detailed explanations for the Forex trading software you can find in the course Forex Strategy Course – with 12 Expert Advisors

    Thank you very much for reading, let me know if you have any questions  about the Forex trading software at our support Forum