After months of testing various Dark EAs, both free and paid versions, I decided to give Dark Venus another serious look. I’d tested this free expert advisor in the past, but with everything I’ve learned from trading the Dark EA family recently, I went back and ran dozens of backtests with different configurations until I found settings that genuinely look promising.
Here’s what makes this review different: I’m not sharing just one setup. I’m providing four complete configurations, two optimized for larger $10,000 accounts and two specifically designed for smaller $200 accounts. All settings will be freely available, and I’ll walk through exactly what I changed and why.
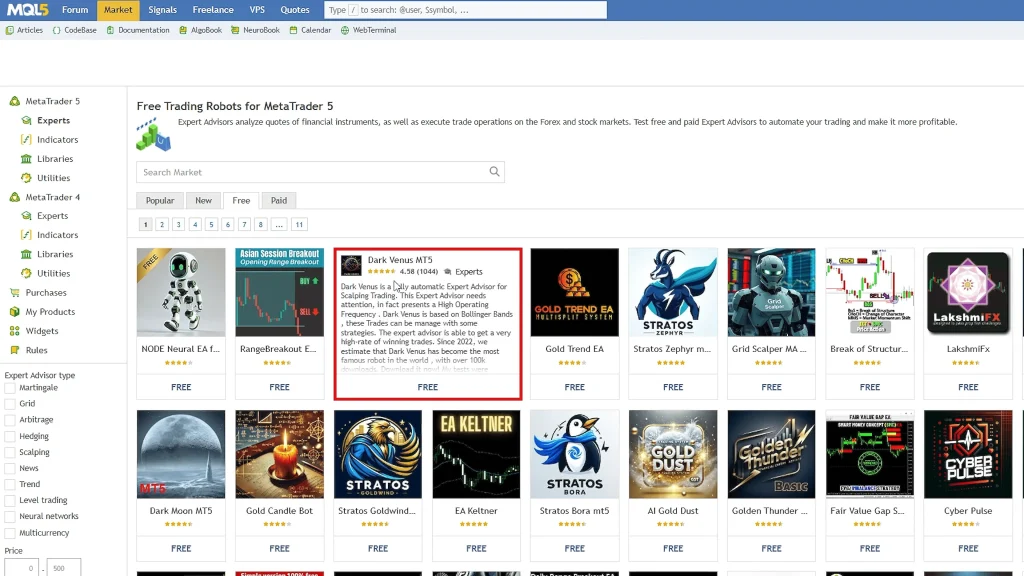
Dark Venus remains one of the top-rated free EAs on the MQL5 marketplace, consistently sitting in the top three spots. But does it actually perform, or is it just popular? Let me show you the backtest results and explain the setup process step by step.
Why Dark Venus Deserves Another Chance
The Dark EA family has produced consistent results for me across multiple systems. Dark Moon, Dark Nova, Dark Algo, I’ve tested them all with varying degrees of success. That track record made me think: perhaps Dark Venus, despite being free, deserves a more thorough examination with refined settings.
Most traders download an EA, run it with default settings, and either celebrate immediate success or abandon it after disappointing results. That’s not testing, that’s gambling. Real testing means systematic experimentation with parameters, understanding what each setting controls, and finding configurations that match your account size and risk tolerance.
I spent countless hours running backtests, adjusting variables, and comparing results. The four configurations I’m sharing represent the best combinations I found for different account types and risk preferences.
Getting Started: Download and Installation
Dark Venus is completely free on the MQL5 marketplace. Here’s the installation process:
- Open MetaTrader and navigate to the Market tab
- Click on “Experts” then select “Free.”
- Find Dark Venus (it’s typically in the top three rated free EAs)
- Click download (you’ll need to be logged into your MQL5 account)
- The EA appears in your Navigator panel under Expert Advisors
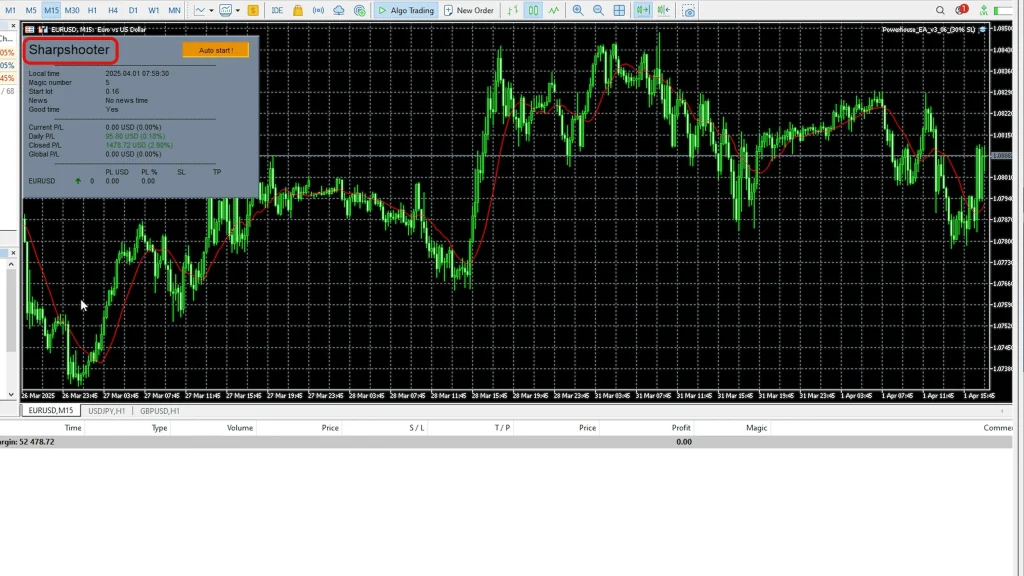
Before attaching Dark Venus to any charts, there’s one crucial step many traders skip, enable algo trading in MetaTrader. Without this enabled, the EA won’t execute any trades. Look for the “Algo Trading” button in your toolbar and make sure it’s activated.
Broker Selection: Why AAP for EUR/GBP
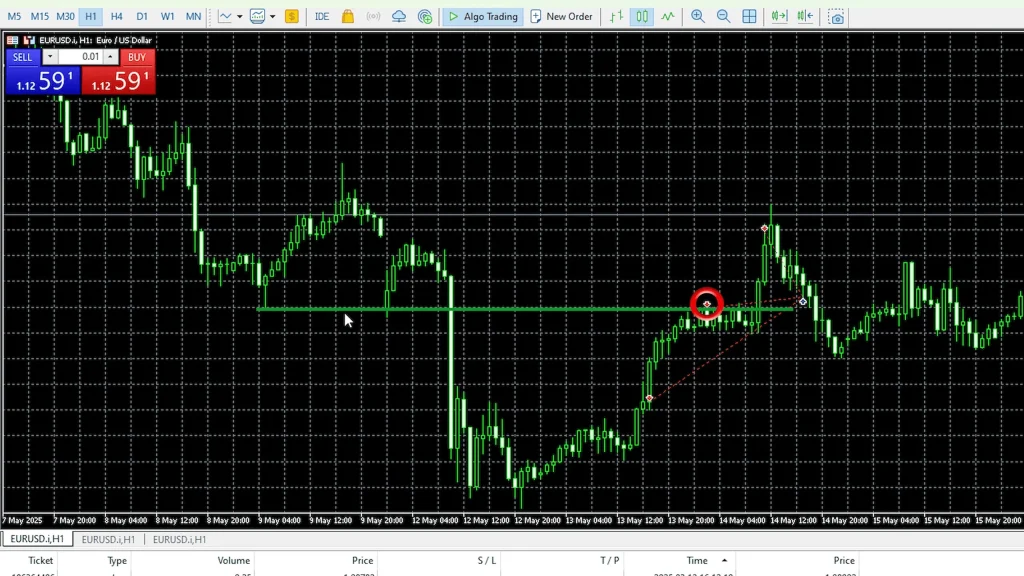
Dark Venus trades EUR/GBP on the M15 timeframe. That specific currency pair and timeframe combination is important; changing either could produce entirely different results from what I’m showing here.
I’m using AAP (Australian Accounting Principles broker) for two primary reasons:
- Regulation and safety: AAP is heavily regulated in Australia, which means deposits and withdrawals are secure. You’re not wondering if your money will disappear overnight.
- Trading conditions: EUR/GBP is a minor pair with wider spreads than majors like EUR/USD. AAP offers some of the tightest spreads in the industry, which directly impacts profitability when you’re targeting specific pip amounts.
For grid-based systems like Dark Venus, every pip of spread eats into your edge. Using a broker with 3-pip spreads versus one with 1-pip spreads can mean the difference between profitable and break-even performance.
The Four Configurations Explained
I created four distinct setups to accommodate different account sizes and risk appetites. Let me break down each one and show you the backtest results.
Configuration 1: $10,000 Account with Fixed Lots
Test parameters:
- Account size: $10,000
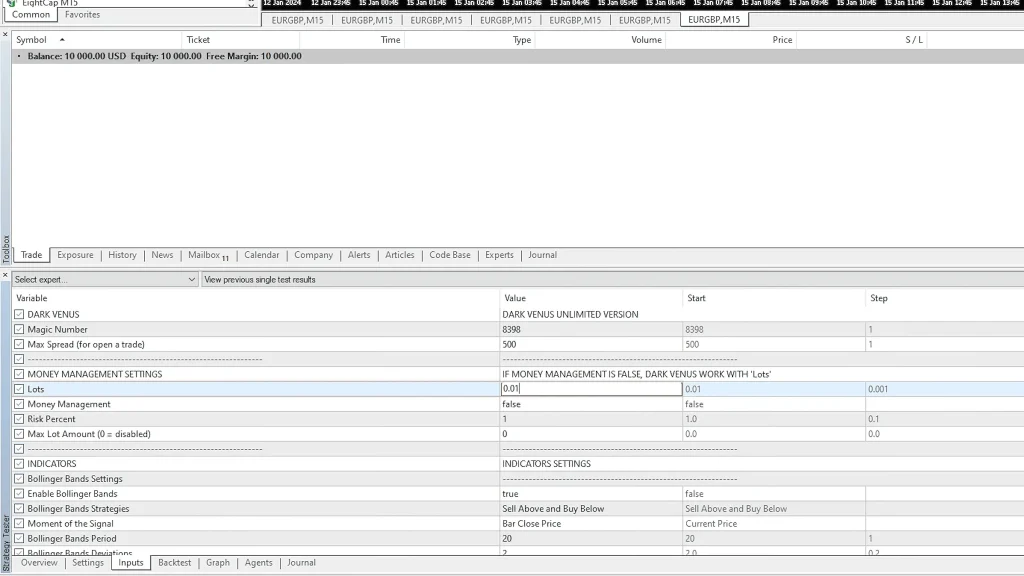
- Lot size: 0.4 lots (fixed)
- Timeframe: M15
- Testing period: January 1, 2024, to January 26, 2025
- Leverage: 1:100
- Modeling: Every tick
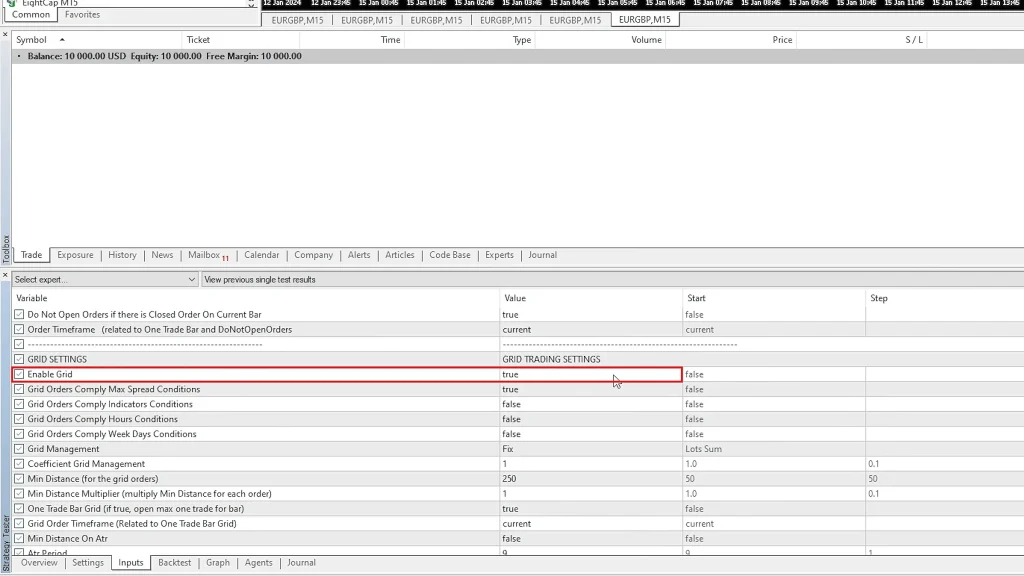
Key setting changes from default:
- Take profit: Increased from 50 to 100
- Grid mode: Changed from martingale to fixed
- Lot sizing: Fixed at 0.4 lots
Backtest results:
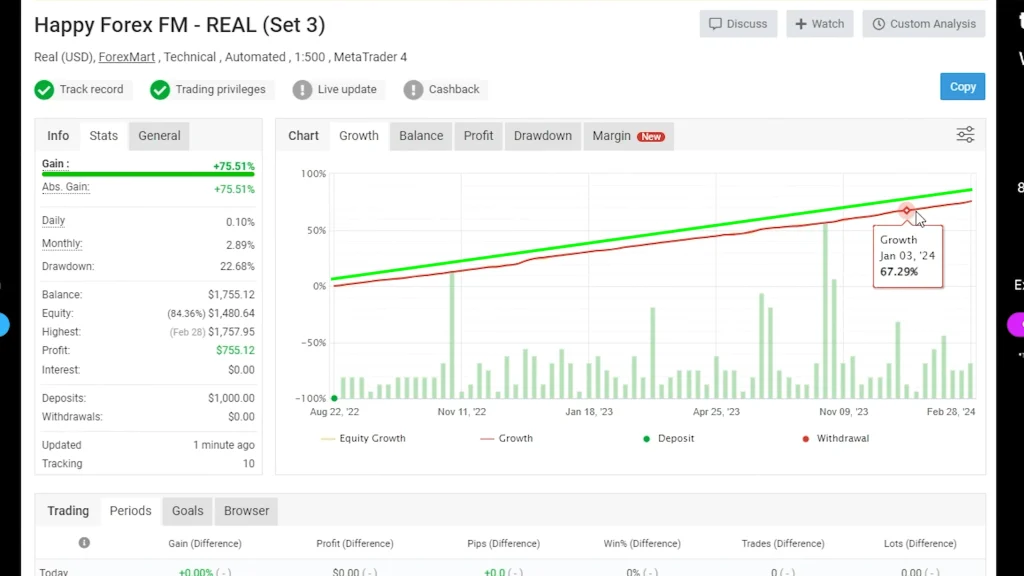
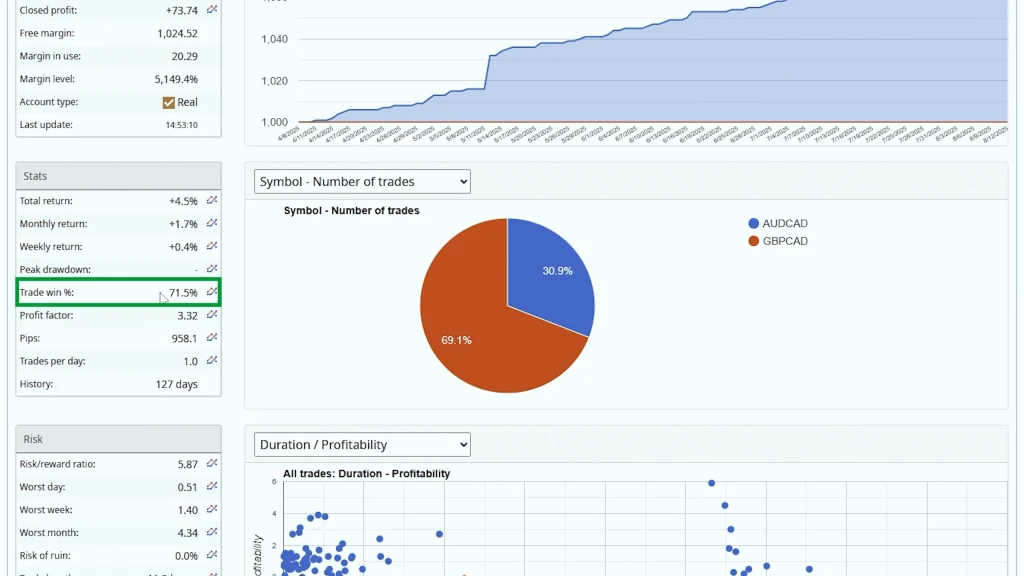
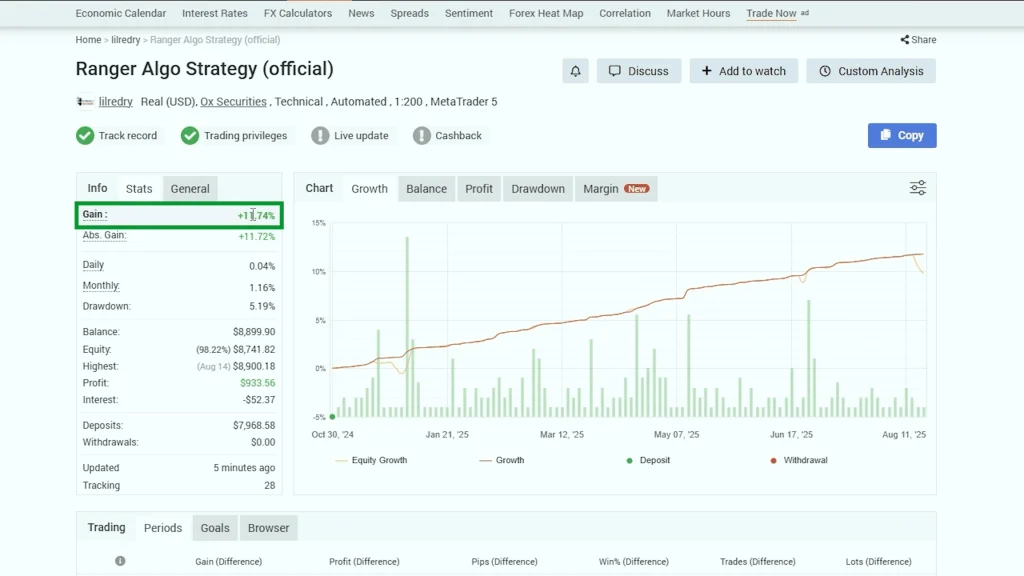
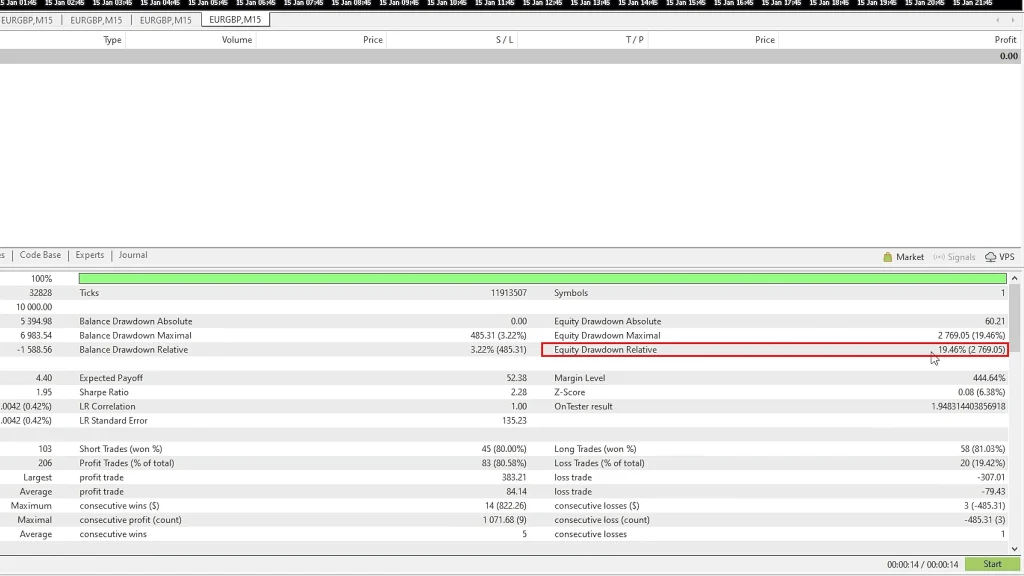
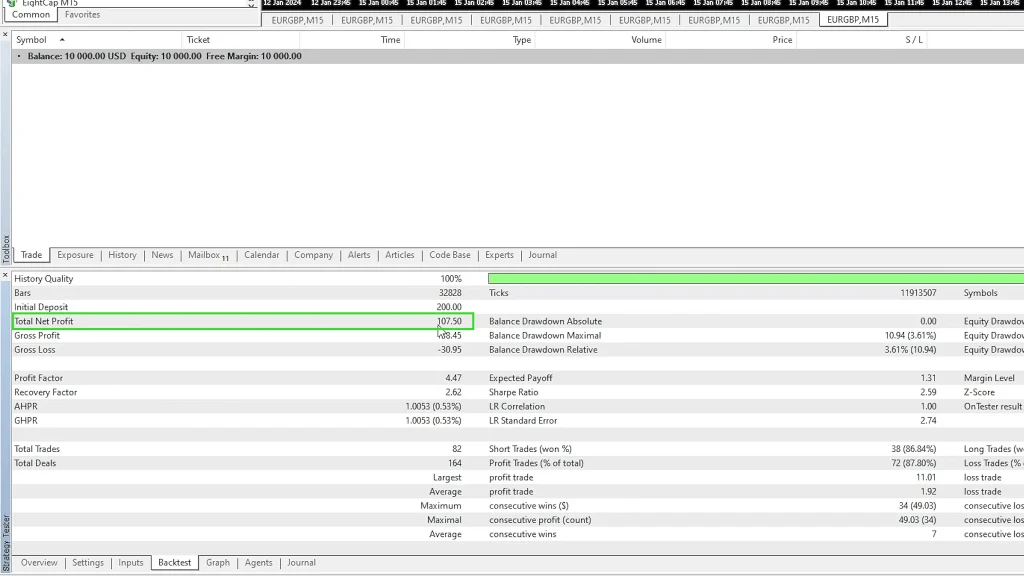
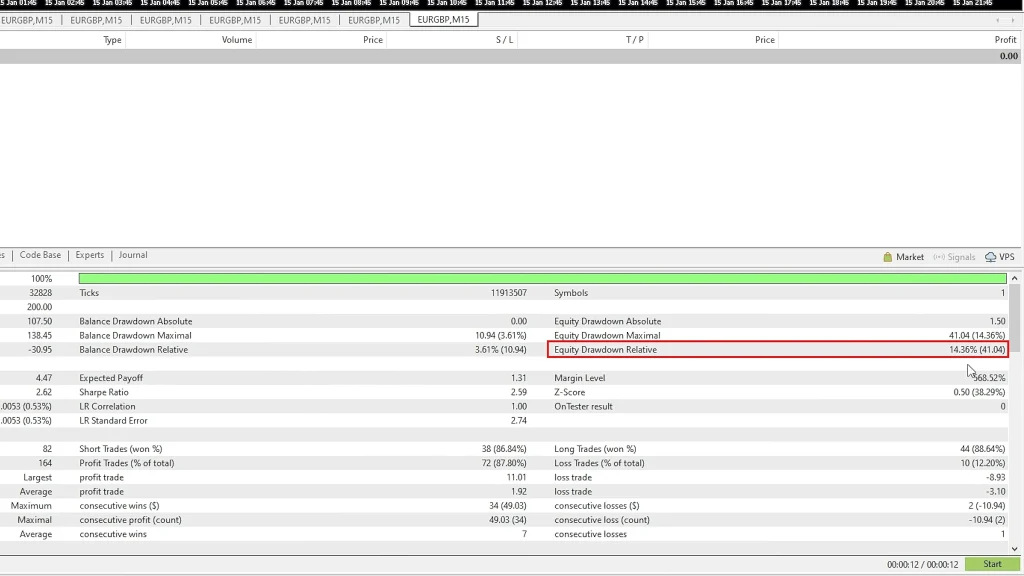
- Net profit: $5,394 (53.94%)
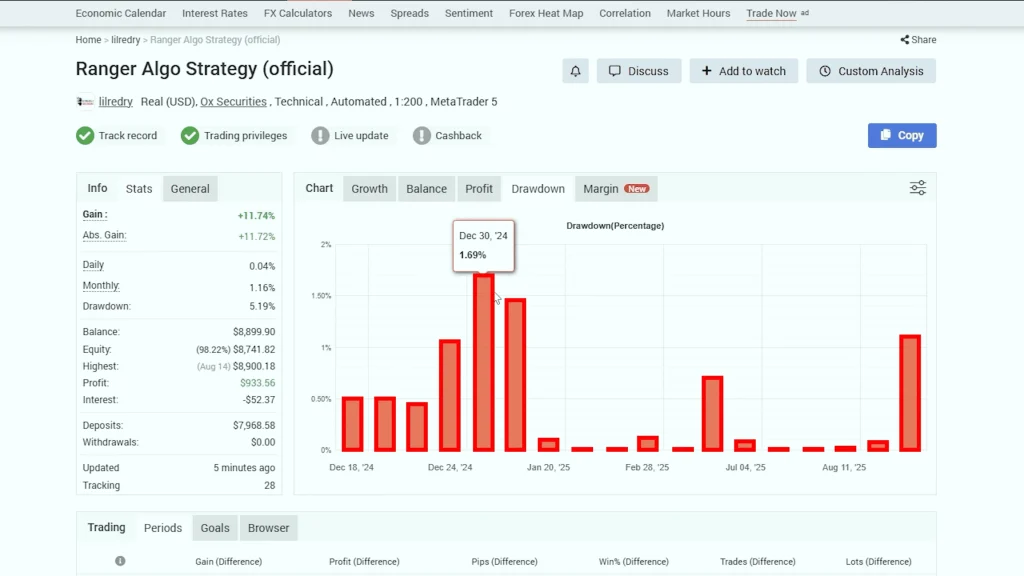
- Maximum drawdown: Under 20%
- Equity curve: Smooth with occasional small drawdowns

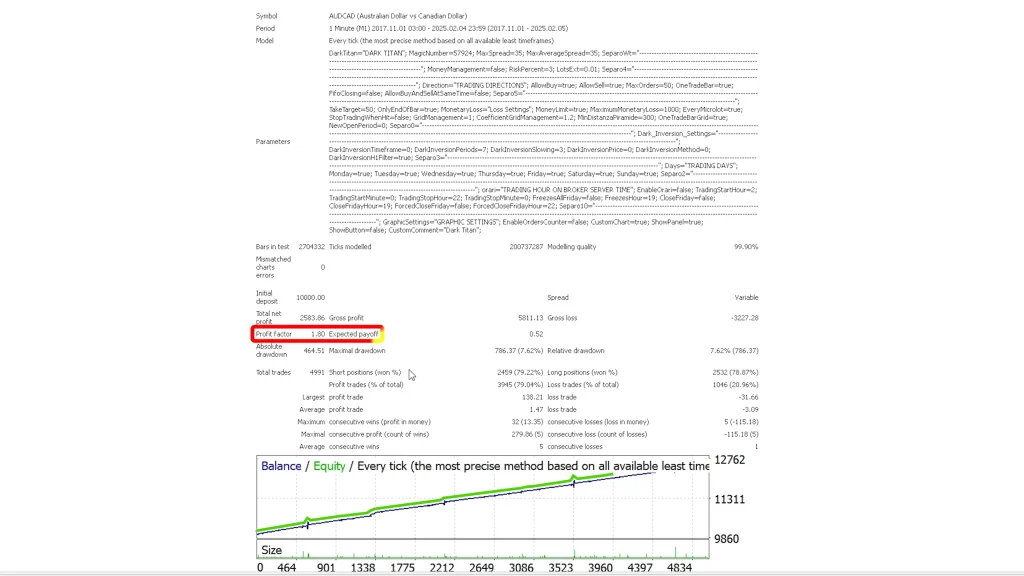
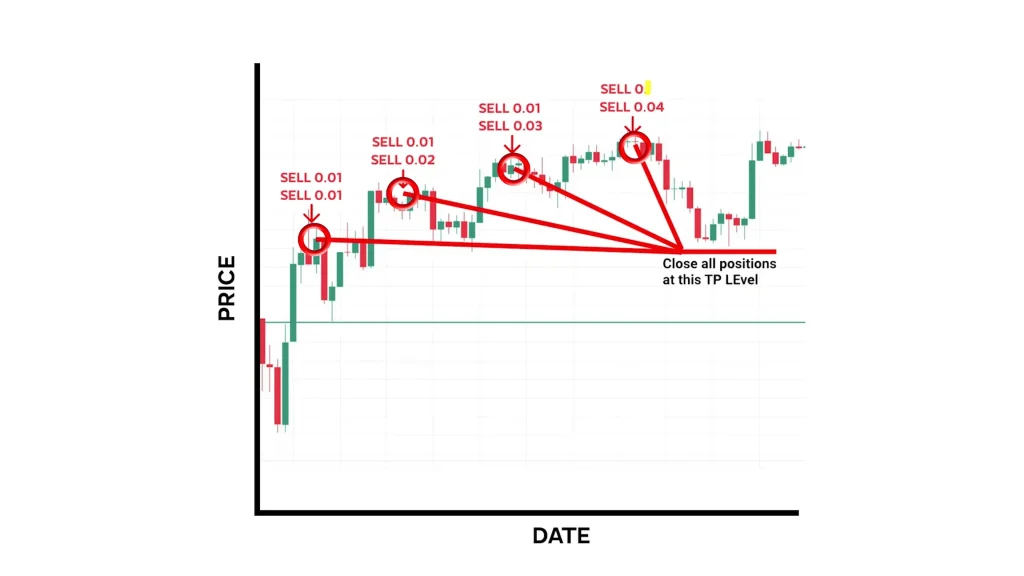
The critical change here was disabling the martingale. By default, Dark Venus uses martingale position sizing where each grid level doubles the lot size. That’s 0.01, then 0.02, then 0.04, then 0.08, exponential growth that can destroy accounts during adverse moves.
Switching to a fixed grid means every position uses the same 0.4 lots regardless of grid level. It’s still adding to losing positions (which carries inherent risk), but without the catastrophic exposure martingale creates.
Configuration 2: $10,000 Account with 3% Risk
Test parameters:
- Account size: $10,000
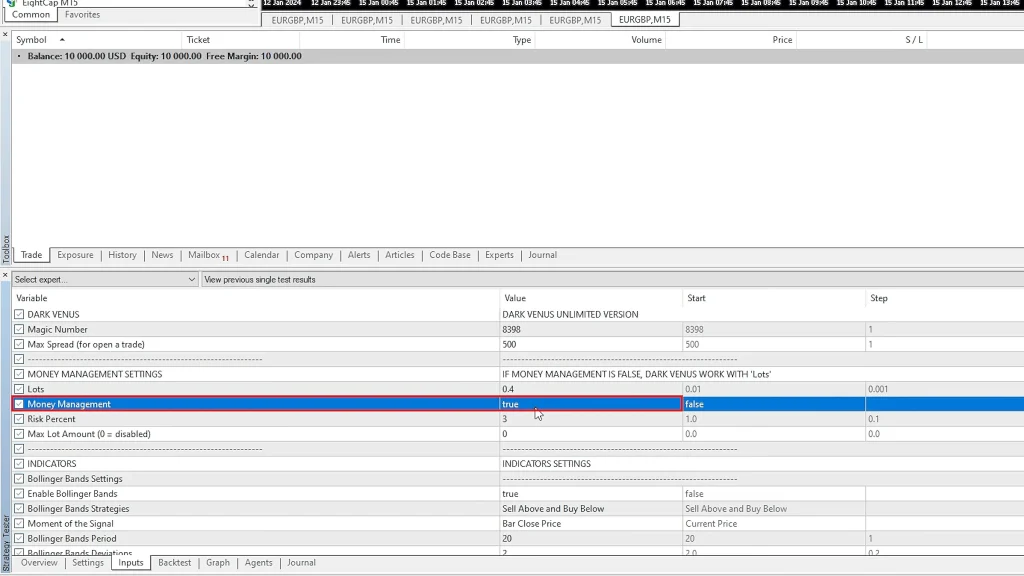
- Money management: Enabled at 3% risk
- Other settings: Similar to Configuration 1
Key differences:
- Dynamic position sizing based on account equity
- Risk percentage: 3% per trade sequence
Backtest results:
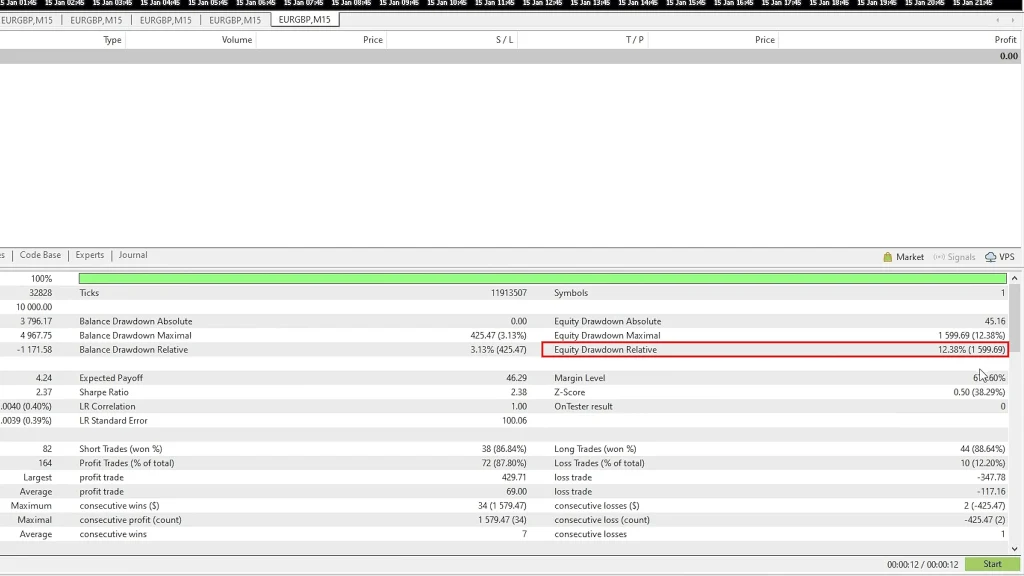
- Net profit: ~$3,800 (38%)
- Maximum drawdown: ~12%
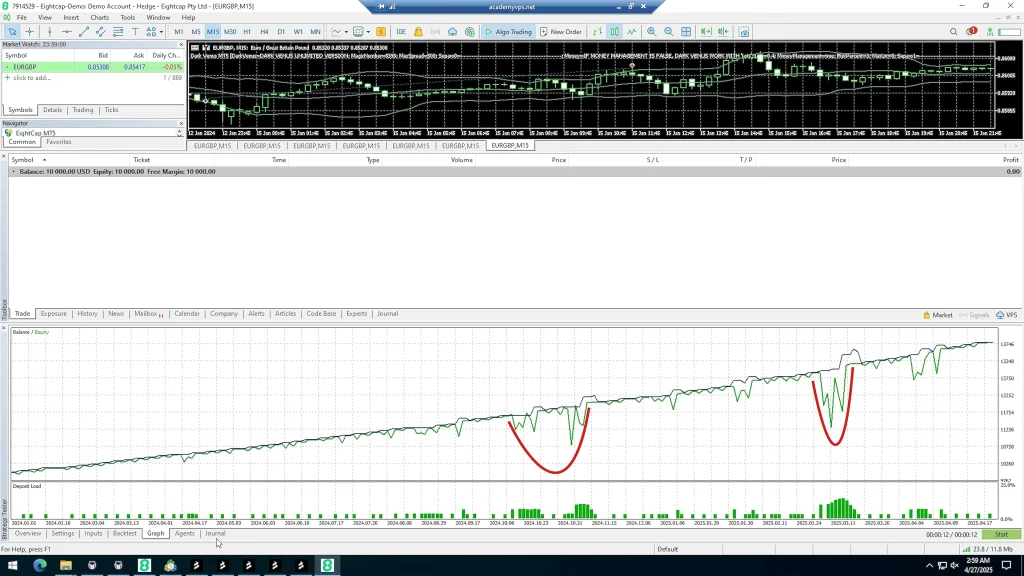
- Equity curve: Notably smoother than the fixed lot version
This configuration sacrifices some profit potential in exchange for significantly lower drawdown. The 12% maximum drawdown versus nearly 20% represents a meaningful reduction in risk exposure.
Which is better? That depends on your goals. Higher returns with higher risk, or moderate returns with exceptional stability? Neither answer is wrong; it’s about matching the EA to your personal risk tolerance.
Configuration 3: $200 Account with Fixed Lots
Test parameters:
- Account size: $200
- Lot size: 0.01 lots (minimum)
- Settings: Based on Configuration 1 but scaled down
Backtest results:
- Net profit: ~$134 (67%)
- Maximum drawdown: ~23%

The 67% return looks impressive, but notice the drawdown increased to 23%. On smaller accounts, fixed lot sizing creates proportionally higher risk since you can’t scale positions down further than broker minimums.

This configuration works if you’re starting with limited capital and accept higher relative volatility. Just understand that 23% drawdown on a $200 account is $46, not catastrophic in absolute terms, but it feels significant when you’re watching your small account fluctuate.
Configuration 4: $200 Account with 3% Risk
Test parameters:
- Account size: $200
- Money management: Enabled at 3% risk
- Settings: Risk-based version for small accounts
Backtest results:
- Net profit: ~$100 (50%)
- Maximum drawdown: ~14%
Again, we see the pattern, enabling percentage-based risk management reduces both returns and drawdown. For small accounts where every dollar counts, that 14% maximum drawdown might be worth accepting 50% returns instead of 67%.
Critical Setting Changes That Made the Difference
Let me explain the specific adjustments I made and why they matter:
Take Profit Adjustment (50 → 100)
Increasing the take profit from 50 to 100 pips allows winning trades more room to run. The tradeoff is you’re exposed longer, but the backtest results show this change improved overall profitability.
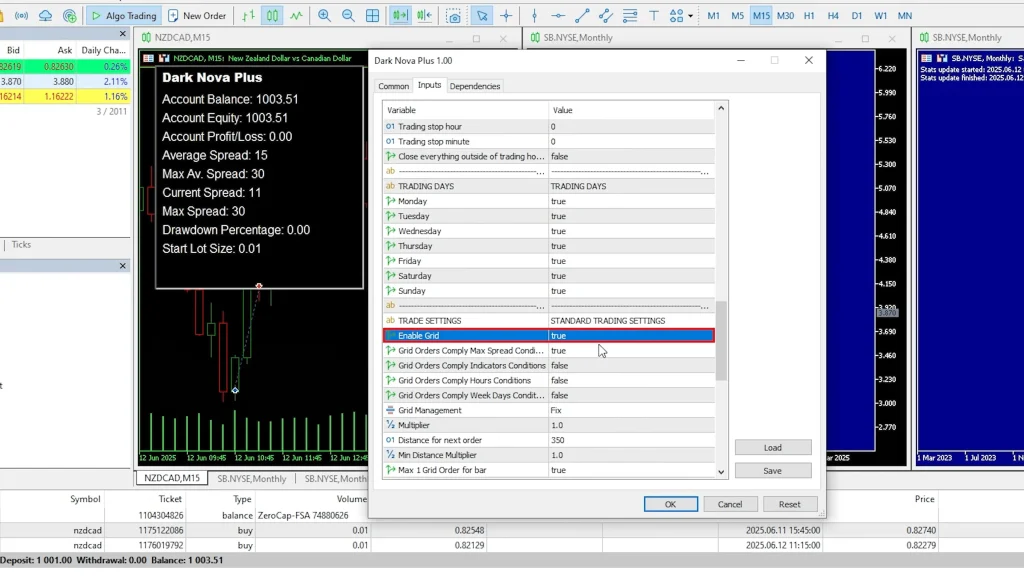
Grid Mode (Martingale → Fixed)
This is the single most important safety modification. Martingale grid systems are profitable until they’re not; then they’re catastrophic. Fixed grid maintains consistent position sizing, which caps your maximum exposure even during extended drawdowns.
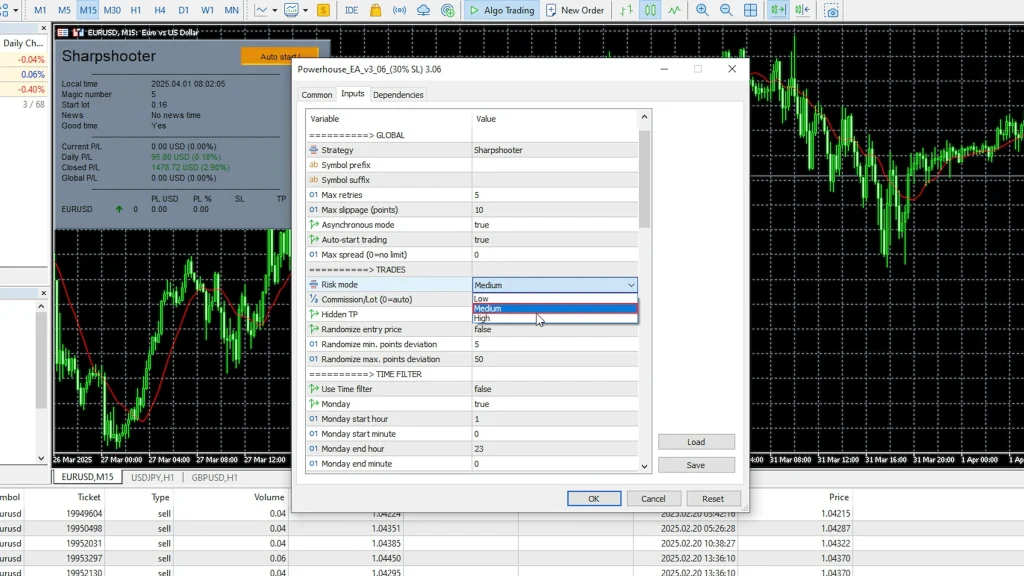
Money Management Toggle
Enabling percentage-based risk (3% in my configurations) creates dynamic position sizing. As your account grows, position sizes increase proportionally. As it shrinks during drawdowns, positions decrease automatically. This built-in risk management prevents overleveraging.
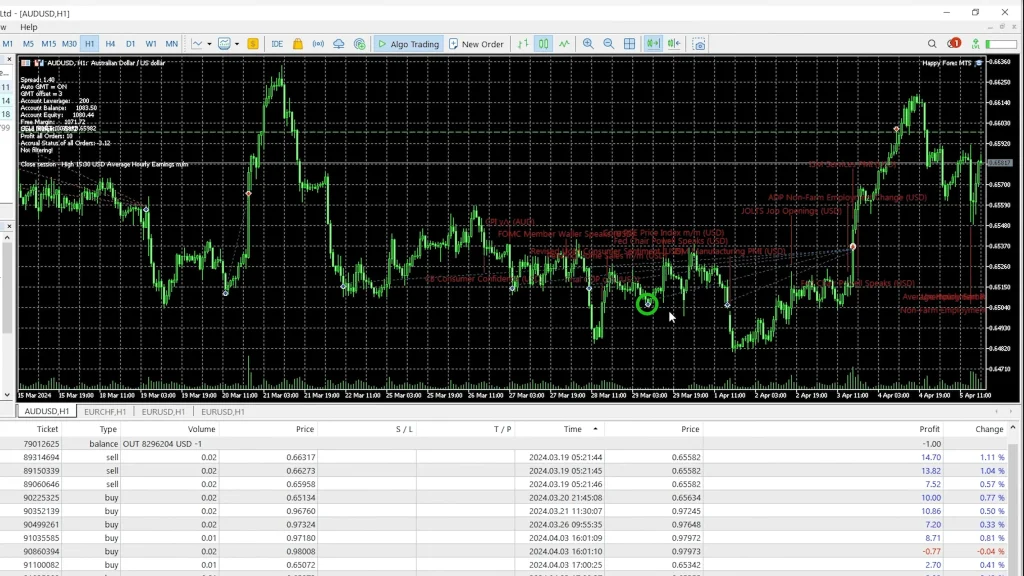
Setting Up the Four Charts
Here’s the practical workflow for running all four configurations simultaneously:
- Open four EUR/GBP M15 charts in MetaTrader
- Hide unnecessary symbols from Market Watch (saves system resources)
- Attach Dark Venus EA to each chart
- Load the appropriate set file for each chart
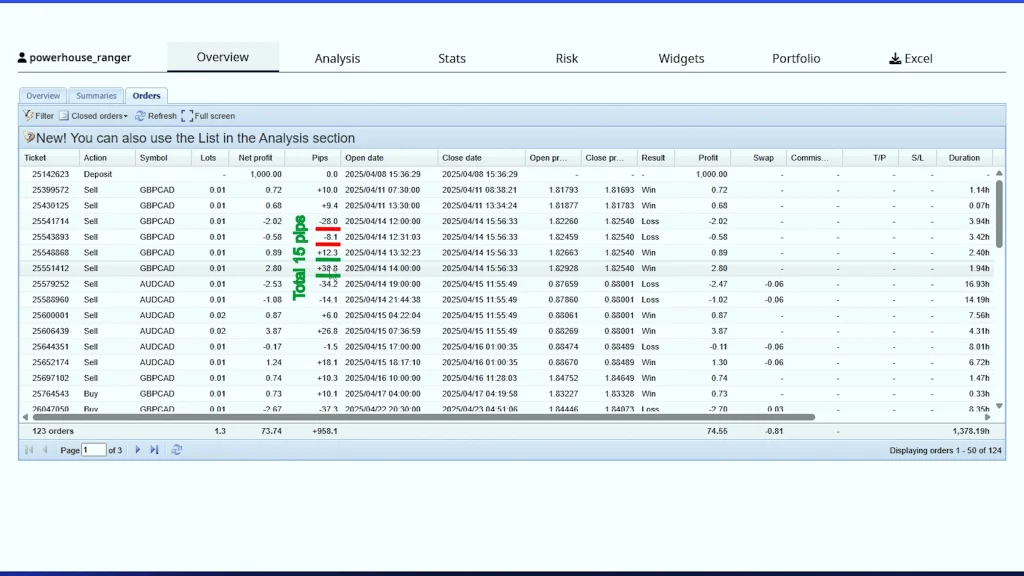
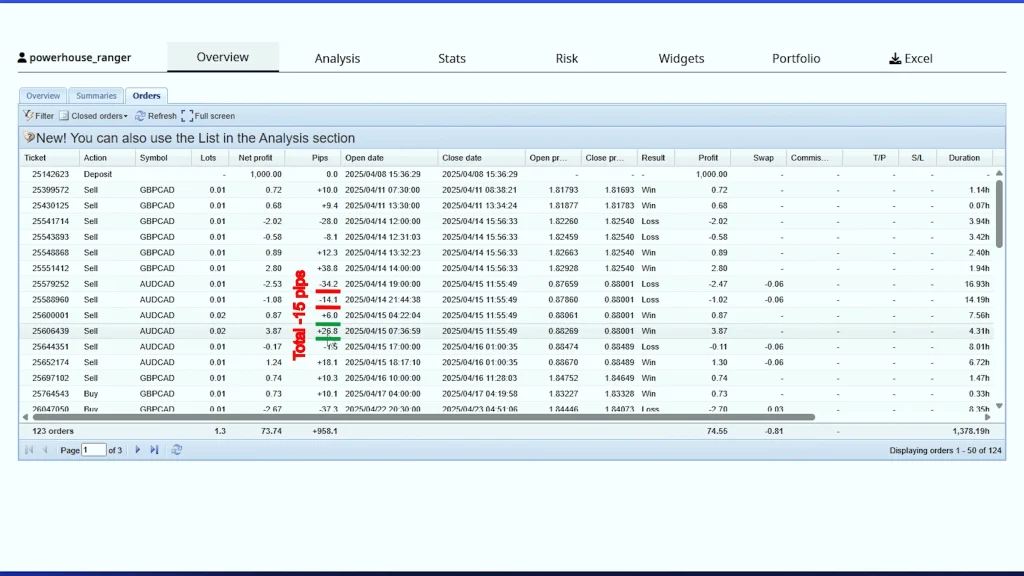
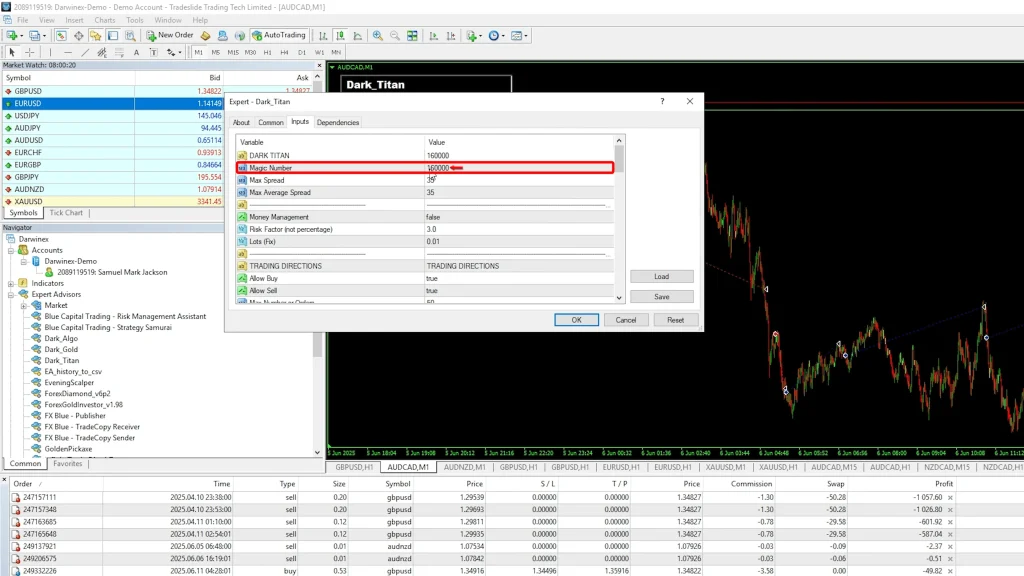
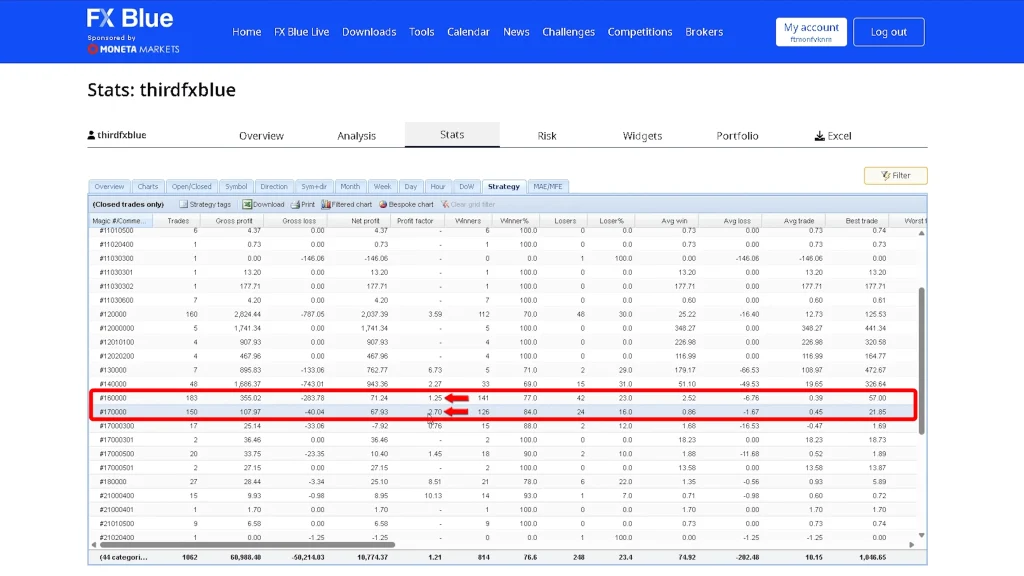
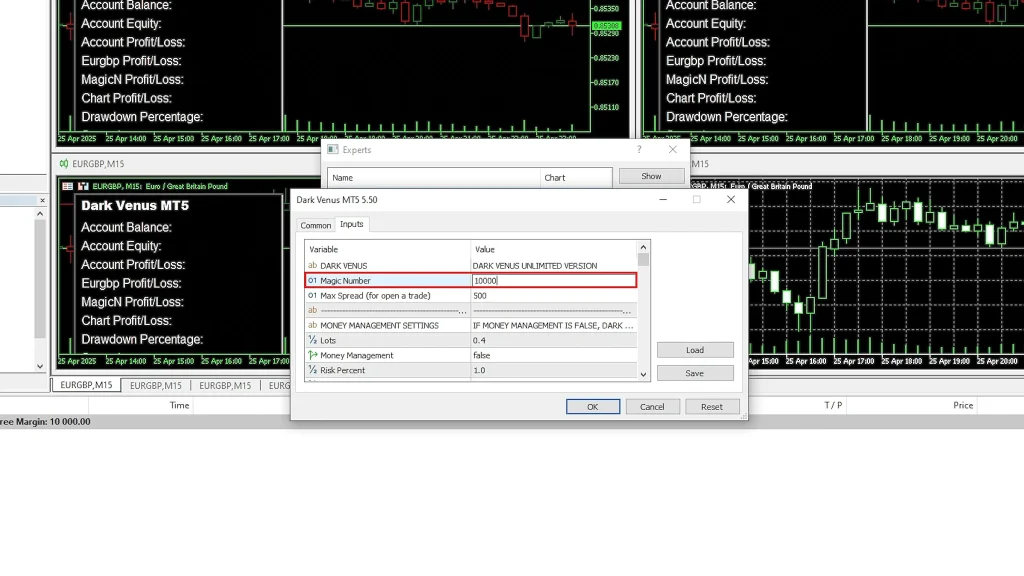
- Assign unique magic numbers to track performance separately
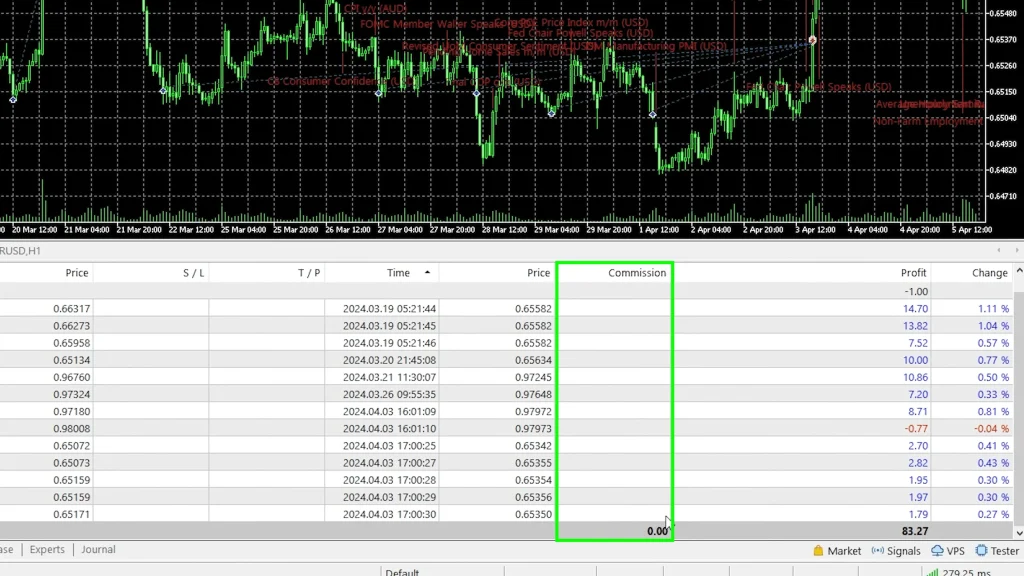
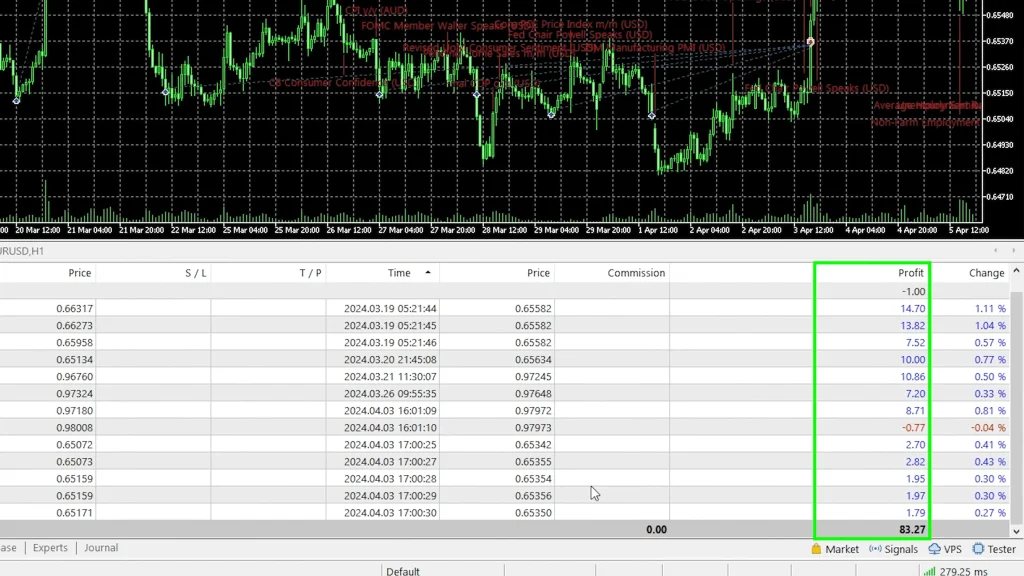
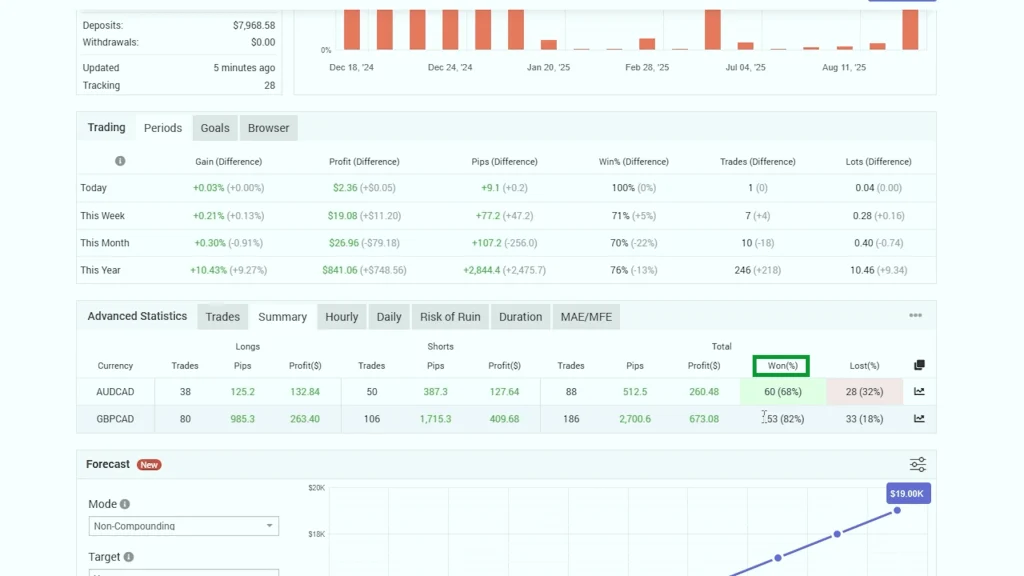
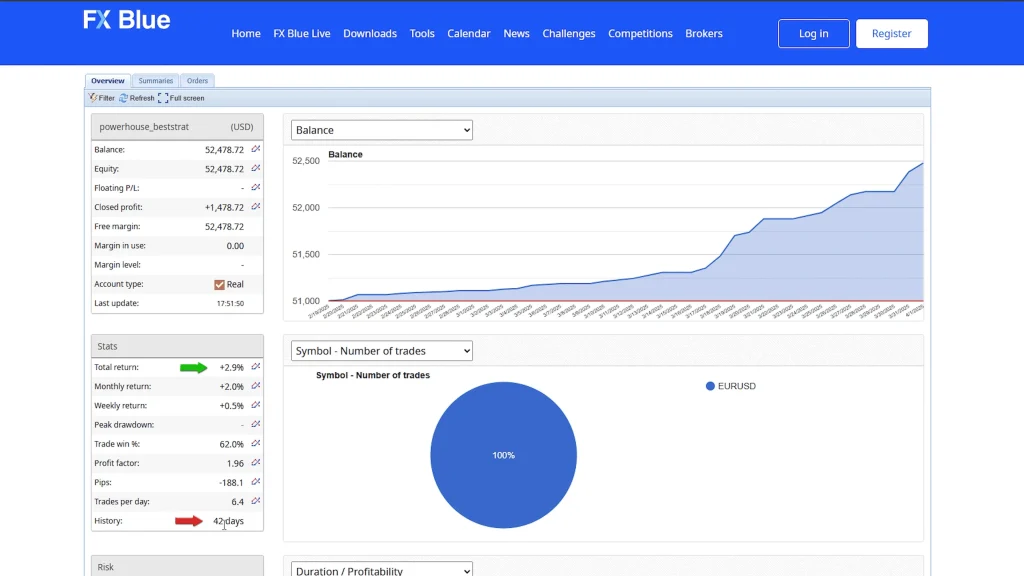
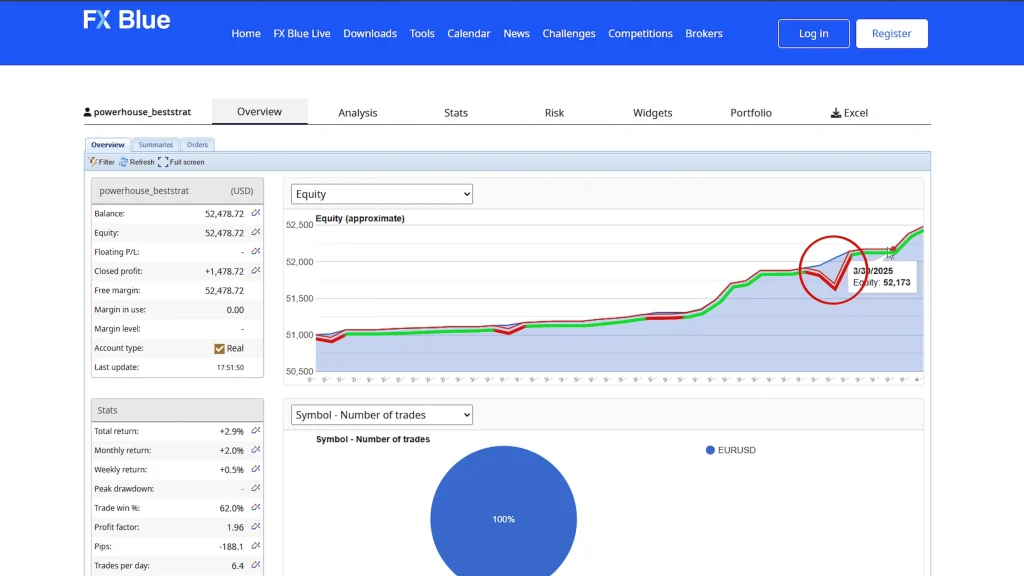
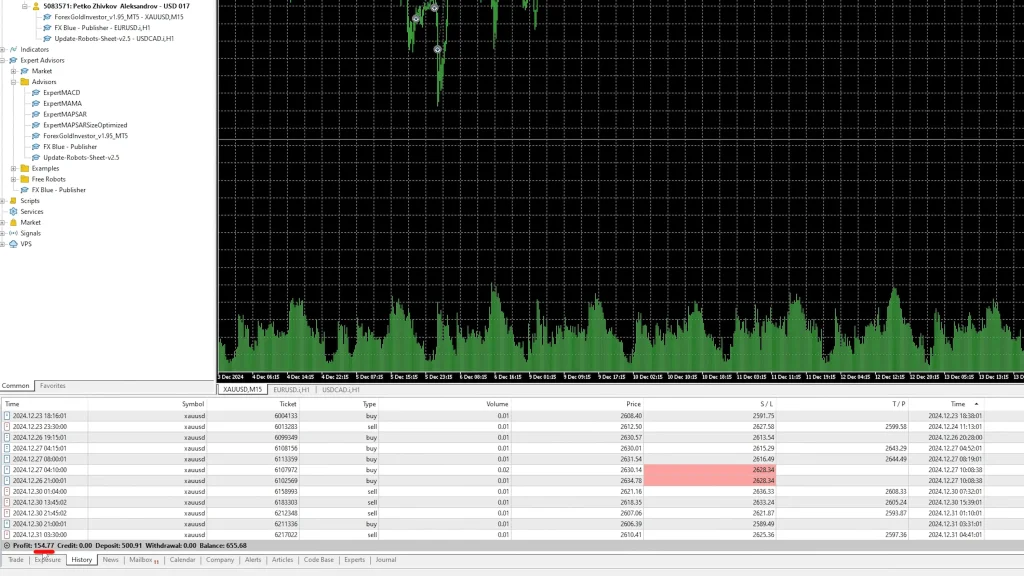
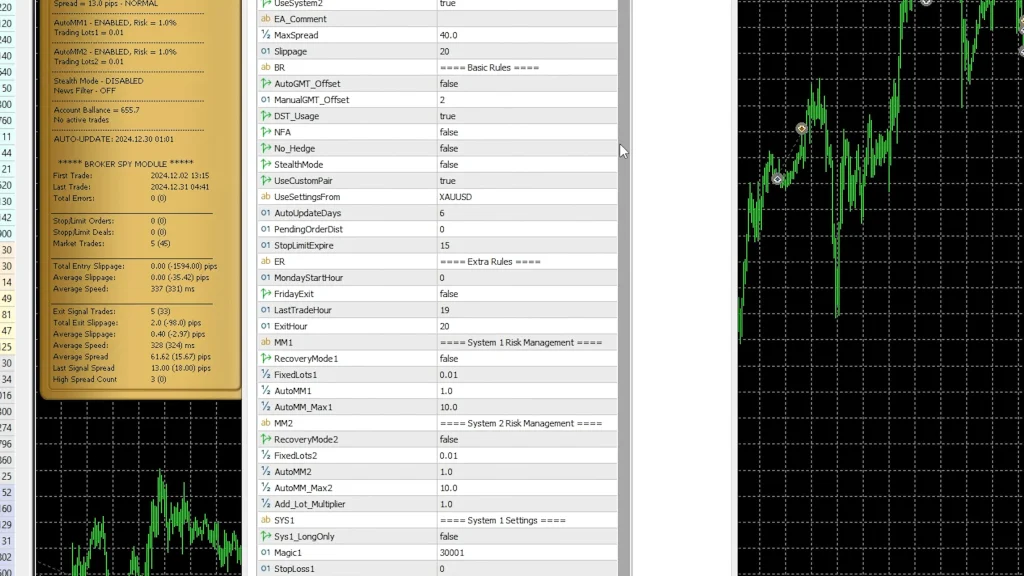
The magic number step is crucial for FXBlue tracking. I used:
- Chart 1: Magic number 100001 ($10K fixed lots)
- Chart 2: Magic number 100002 ($10K 3% risk)
- Chart 3: Magic number 2001 ($200 fixed lots)
- Chart 4: Magic number 2002 ($200 3% risk)
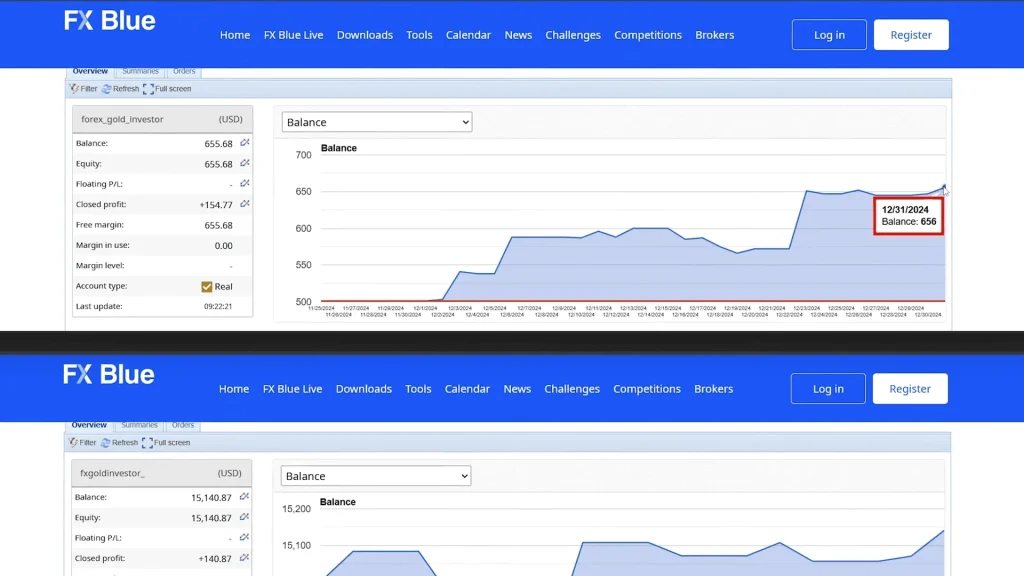
With distinct magic numbers, FXBlue can separate each EA’s trades even though they’re all running on the same account. This lets me compare performance across all four configurations independently.
Simulating Small Accounts on Large Capital
There’s a technical detail worth explaining. To test the $200 configurations on a $10,000 account, I had to adjust the risk percentage proportionally.
If you’re running 3% risk on a $200 account, that’s $6 per trade. On a $10,000 account, 3% risk is $300, completely different exposure. To simulate a $200 account behavior on the larger account, I calculated: (200 / 10,000) × 3% = 0.06% risk.
Setting the risk to 0.06% on the $10,000 account produces identical position sizing as 3% on $200. This lets me test all four configurations simultaneously without needing four separate broker accounts.
Performance Comparison Table
| Configuration | Account Size | Lot Type | Net Profit | Max Drawdown | Risk Level |
| Config 1 | $10,000 | Fixed 0.4 | 53.94% | ~20% | Higher |
| Config 2 | $10,000 | 3% Risk | 38% | ~12% | Lower |
| Config 3 | $200 | Fixed 0.01 | 67% | ~23% | Higher |
| Config 4 | $200 | 3% Risk | 50% | ~14% | Lower |
The pattern is consistent; fixed lot sizing produces higher returns with higher drawdown, while percentage-based risk management provides smoother equity curves at the cost of some profit potential.
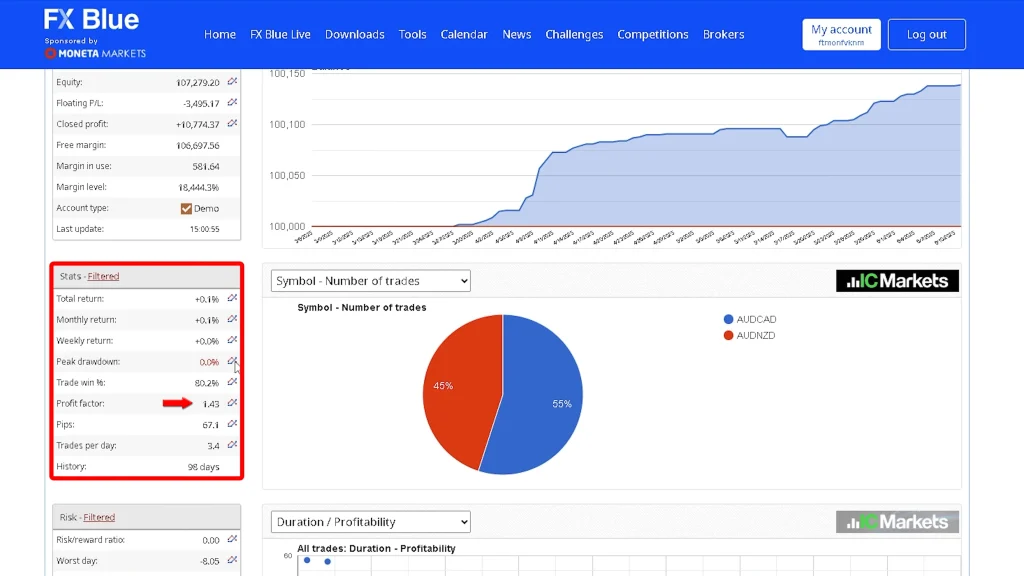
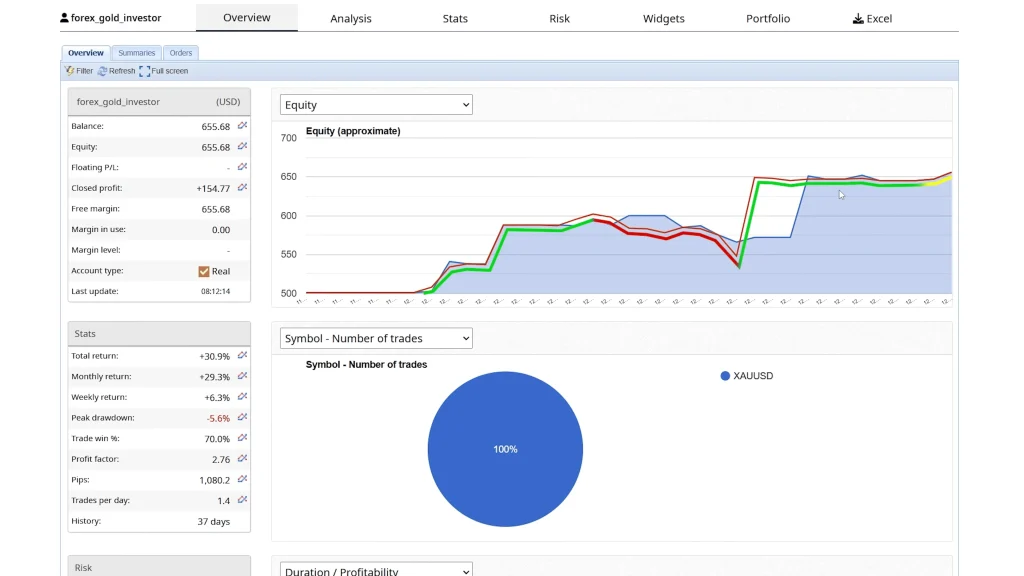
The Demo Testing Phase
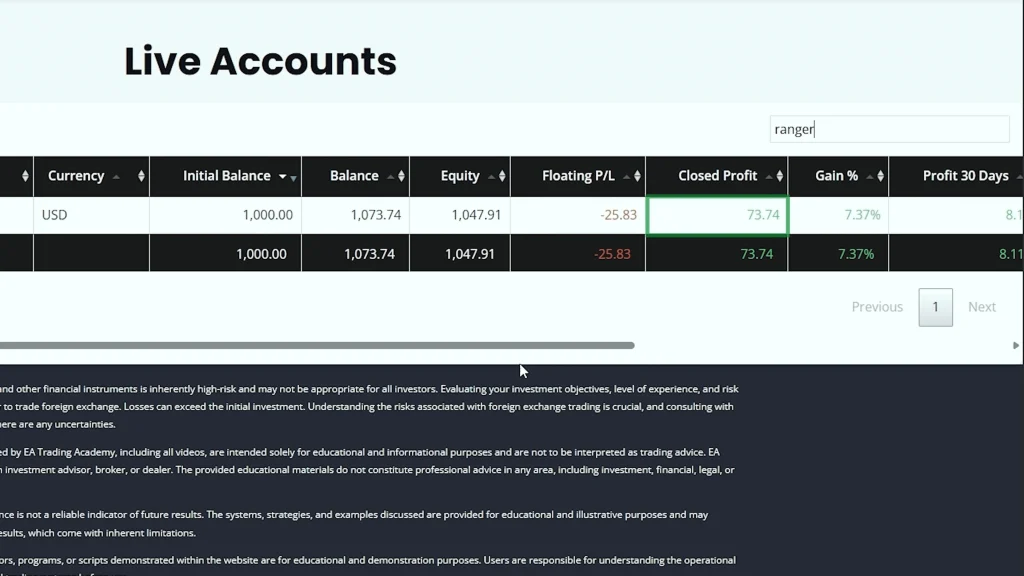
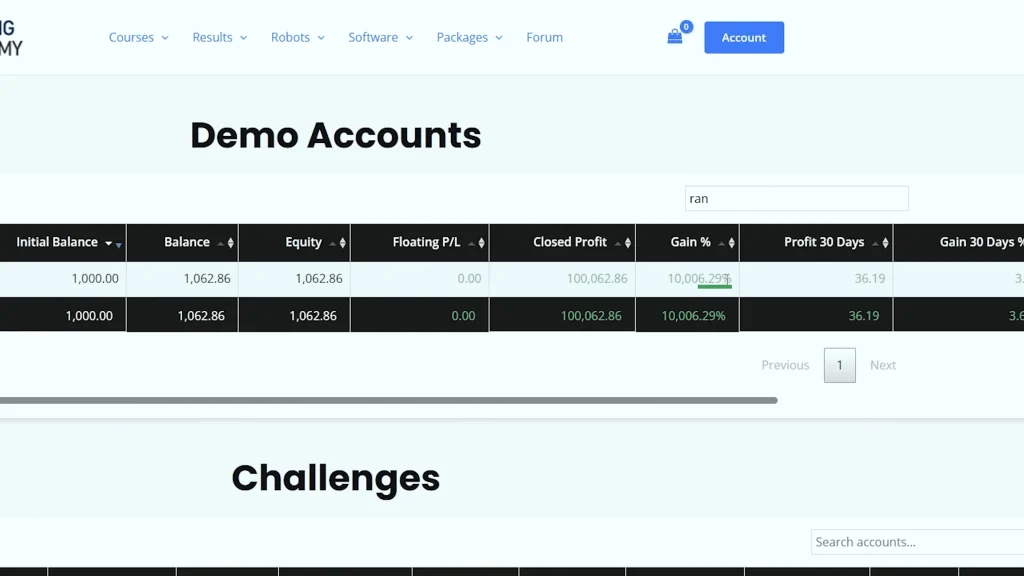
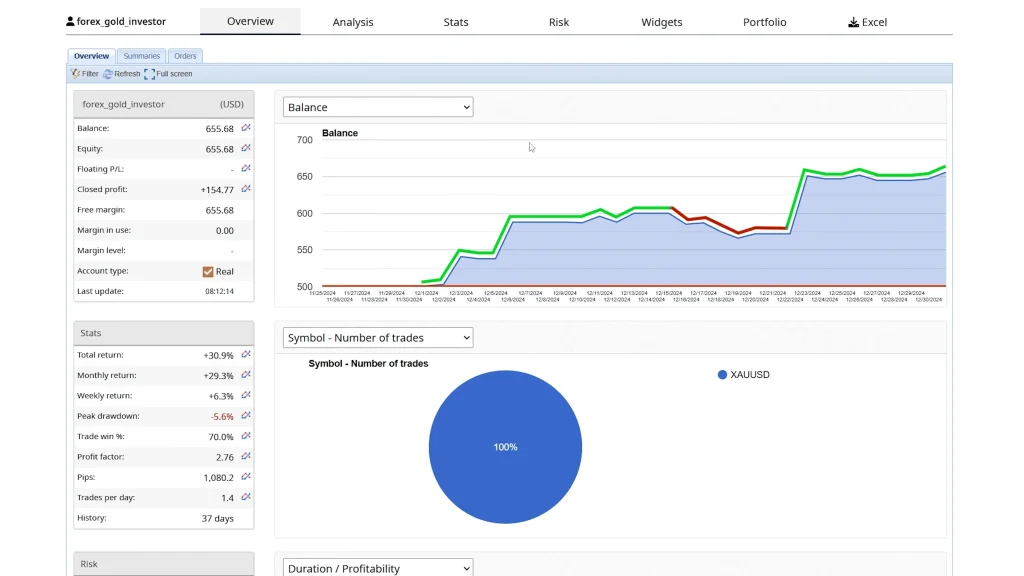
I’m not putting any configuration directly onto live accounts yet. Each setup needs to prove itself in demo trading first, monitored through FXBlue for complete transparency.
Backtests show what would have happened. Forward testing on the demo shows what actually happens with real spreads, real execution, and real slippage. Only after sufficient demo performance will I graduate the best-performing configuration to live capital.
This might seem overly cautious, but it’s how you avoid blowing accounts. Backtests lie sometimes, not intentionally, but because they can’t perfectly replicate every real-world variable. Demo testing catches issues before they cost real money.
Why EUR/GBP Specifically
Dark Venus is optimized for EUR/GBP on M15. I haven’t tested it extensively on other pairs or timeframes. Perhaps it works elsewhere, but I can only speak to what I’ve actually verified.
EUR/GBP has specific volatility characteristics and trading hour patterns that the EA’s logic appears tuned for. Switching to EUR/USD or GBP/USD might produce entirely different results, better or worse, I genuinely don’t know without testing.
When sharing settings and results, I want to be precise about what I tested. These configurations work for EUR/GBP M15 based on my backtests. Applying them elsewhere is your decision, but don’t assume identical performance.
The Grid System Reality Check
Dark Venus uses grid trading, which means it adds positions when the price moves against the initial entry. Even with the martingale disabled, this approach carries inherent risk.
If EUR/GBP trends strongly in one direction for an extended period, the EA will accumulate multiple losing positions. Eventually, one of two things happens: price reverses, and all positions close profitably, or drawdown becomes unsustainable.
The backtests show successful recovery in most scenarios over the testing period. But “most” isn’t “all,” and past performance doesn’t guarantee future results, especially with grid systems that depend on mean reversion behavior.
Understand what you’re running. Grid EAs aren’t inherently bad, but they require proper capitalization, appropriate lot sizing, and realistic expectations about drawdown potential.
Community Knowledge Sharing
If you’re running Dark Venus with different settings that produce better results than mine, please share them. The goal here isn’t protecting some secret configuration, it’s building collective knowledge that benefits everyone.
Maybe you found that 75 take profit works better than my 100. Perhaps you’re using different risk percentages. Or you’ve tested it successfully on GBP/JPY. That information helps the community make better decisions.
Trading doesn’t have to be secretive. When we share what works (and what doesn’t), we all improve faster than working in isolation.
Where to Access Dark Venus and Additional Resources
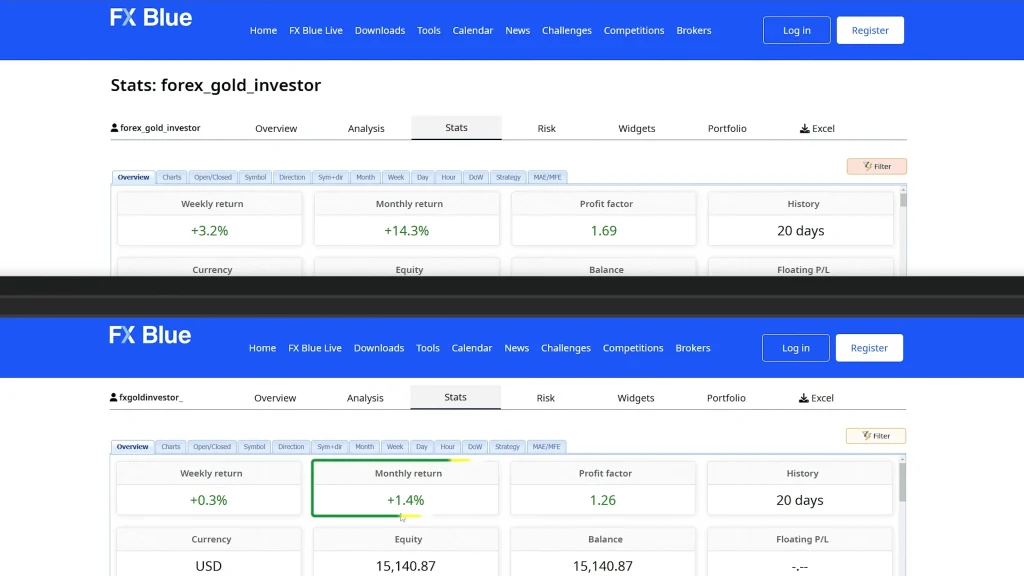
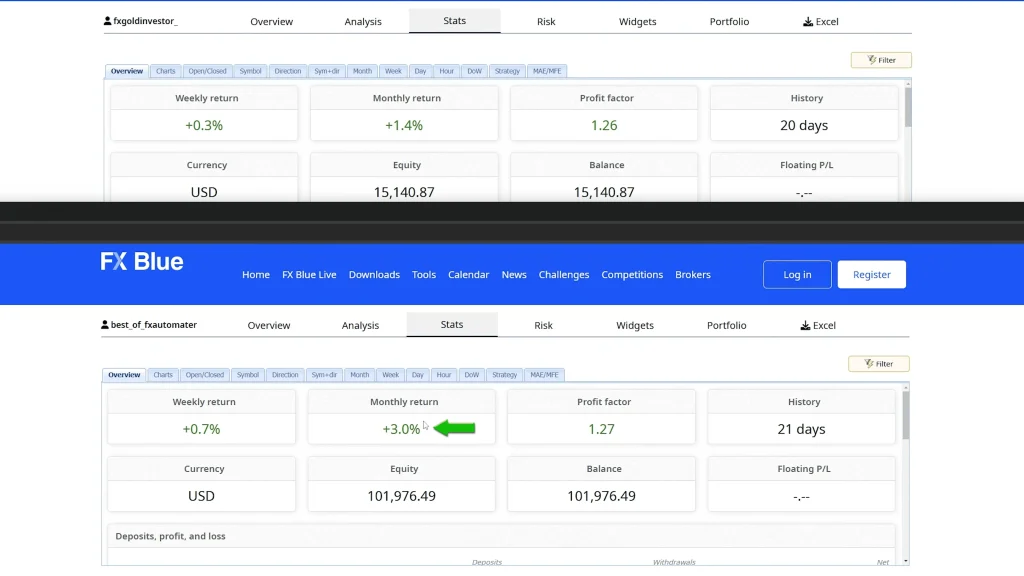
Dark Venus EA is completely free on the MQL5 marketplace and also available through Algo Trading Space, which provides additional resources and trading insights. Full disclosure: we may earn a small commission through our links, though this doesn’t affect the price (it’s free) or the honest assessment in this review.
For traders building portfolios across multiple expert advisors, the Algo Trading Space VIP club offers exclusive access to verified trading results from various systems, early insights into new EAs, and priority support. If you want ongoing performance data and community access beyond individual reviews, it’s worth exploring.
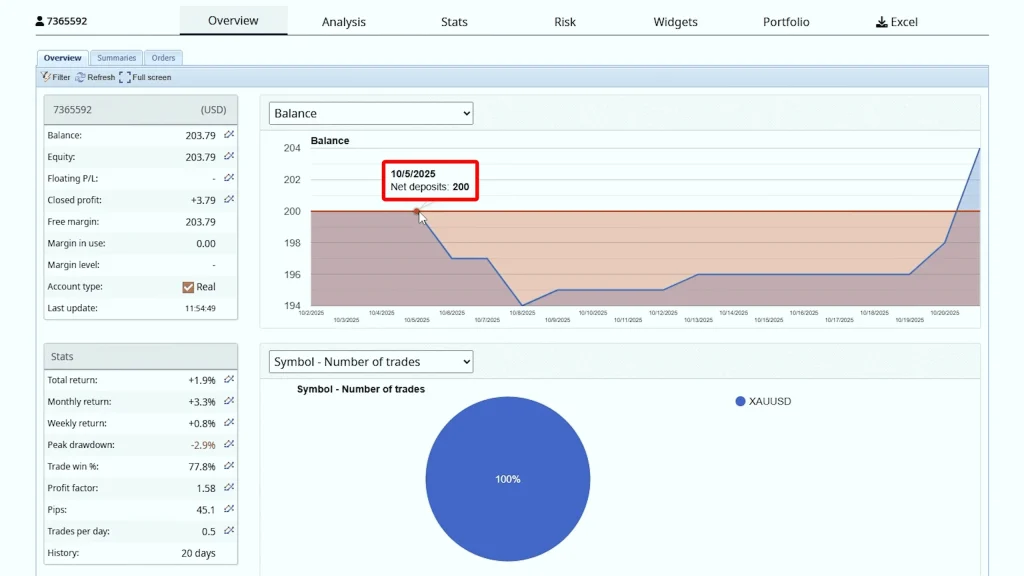
I’ll continue monitoring all four Dark Venus configurations through FXBlue with public tracking, so you can follow results as they develop beyond these initial backtests.
Frequently Asked Questions
Why did you change the take profit from 50 to 100 pips, and how does this affect the trading approach?
Increasing the take profit to 100 pips allows Dark Venus more room to capture larger price movements rather than closing positions prematurely at 50 pips. The backtest data showed improved overall profitability with the higher target, suggesting EUR/GBP’s volatility on M15 frequently produces moves exceeding 50 pips.
The tradeoff is longer trade duration and more exposure time to adverse movements, but the risk appears justified based on the 13-month backtest results showing this adjustment improved returns across all four configurations.
What’s the practical difference between fixed lot sizing and percentage-based risk management for Dark Venus?
Fixed lot sizing maintains constant position sizes regardless of account growth or drawdown, which creates predictable exposure but doesn’t adapt to changing account equity. Percentage-based risk (3% in my configs) dynamically adjusts position sizes, larger as the account grows, smaller during drawdowns.
My backtests showed percentage-based approaches reduced maximum drawdown by roughly 6-8% while sacrificing 12-17% of net profit. For risk-averse traders or funded accounts with strict drawdown limits, the percentage method provides better capital preservation at the cost of slower growth.
Can I run Dark Venus on currency pairs other than EUR/GBP or different timeframes?
Dark Venus is specifically optimized for EUR/GBP on M15 timeframe, that’s what I tested and what my shared settings target. Running it on other pairs like EUR/USD or GBP/JPY would require independent backtesting to verify performance, as different pairs have unique volatility patterns and spread characteristics.
Similarly, changing from M15 to M5 or H1 alters the signal generation completely. You can experiment with other pairs, but don’t assume my settings will perform identically. Always backtest thoroughly before risking real capital on untested configurations.
Why disable the martingale feature when it’s part of Dark Venus’s default strategy?
Martingale position sizing doubles lot sizes at each grid level (0.01, 0.02, 0.04, 0.08), creating exponential exposure during drawdowns. While this can produce faster recovery when price reverses, it risks catastrophic losses during extended adverse moves; one bad sequence can eliminate all prior gains. Switching to a fixed grid maintains consistent position sizing across all levels, capping maximum exposure even during worst-case scenarios.
My backtests showed fixed grid configurations still achieved 38-67% annual returns with substantially lower maximum drawdown, making them safer for long-term sustainability.
How long should I run Dark Venus on demo before moving to a live account?
I recommend a minimum of 2-3 months of forward demo testing with full FXBlue tracking before considering live deployment. Backtests show historical performance, but demo testing reveals how the EA handles current market conditions, real spreads, actual execution speeds, and slippage.
Watch for consistency between backtest projections and demo results, if demo performance significantly deviates (either better or worse), investigate why before risking real capital. Only move the best-performing configuration to live trading, and start with conservative position sizing, even then.
What’s the significance of using unique magic numbers for each Dark Venus instance?
Magic numbers allow FXBlue and other tracking platforms to separate trades from different EA instances running on the same account. Without unique magic numbers (like my 100001, 100002, 2001, 2002 assignments), all trades appear combined, and you can’t identify which configuration generated which results.
This granular tracking lets you compare performance across different setups, identify which works best, and make data-driven decisions about which configuration deserves live capital. It’s essential for systematic testing rather than guessing which setup produced your profits or losses.