Blog

  • Forex EA Backtesting Software for MT4

    Forex EA Backtesting Software for MT4

    How to do Backtesting in Forex – the method to test an Expert Advisor in MetaTrader

    Backtesting trading Forex strategies is what we will cover in this free lecture from Petko Aleksandrov, the Head Mentor at EA Forex Academy.

    In this article, we will talk about the update that we have in the report and how to backtest Forex trading strategies with EA Studio, or when we are generating strategies.

    For those of you who already know EA Studio and have tested the 15-days free trial, we will update you with great tools that are available in the Report. If you have not tested the two weeks period, give it a try because you will learn how to do backtesting Forex trading strategies even you do not have programming skills.

    Also, to use the EA Studio strategy builder you do not need to have any trading background. The program is easy to be used and there is a free course attached that will help you get started faster. In the beginning, it might look difficult but when you do it one time, you will see that it is easy.

    Backtesting Forex trading strategies with  Petko Aleksandrov, our Head Mentor, and trader.

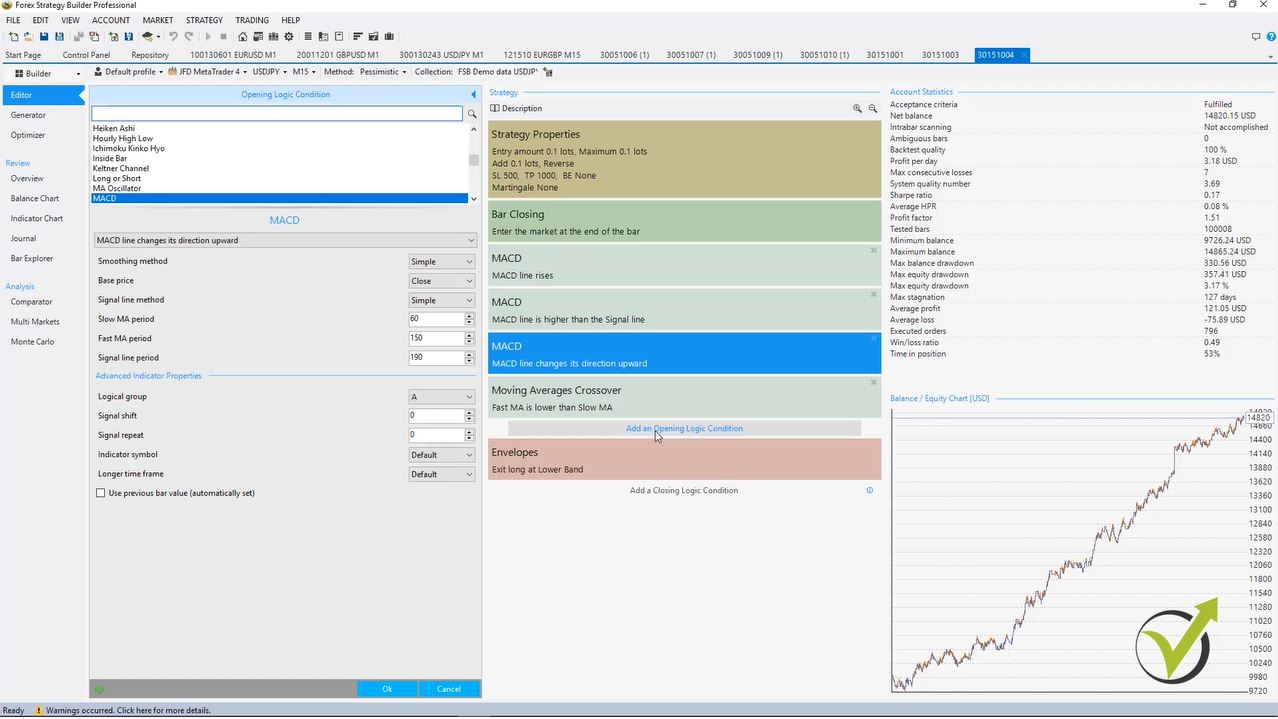
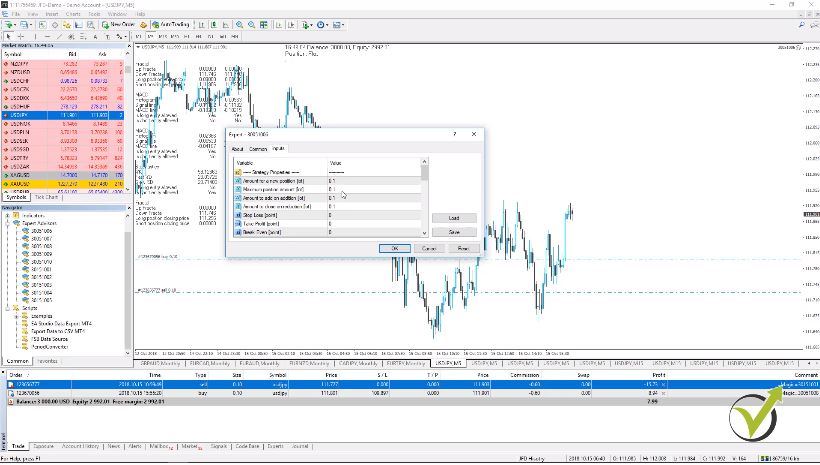
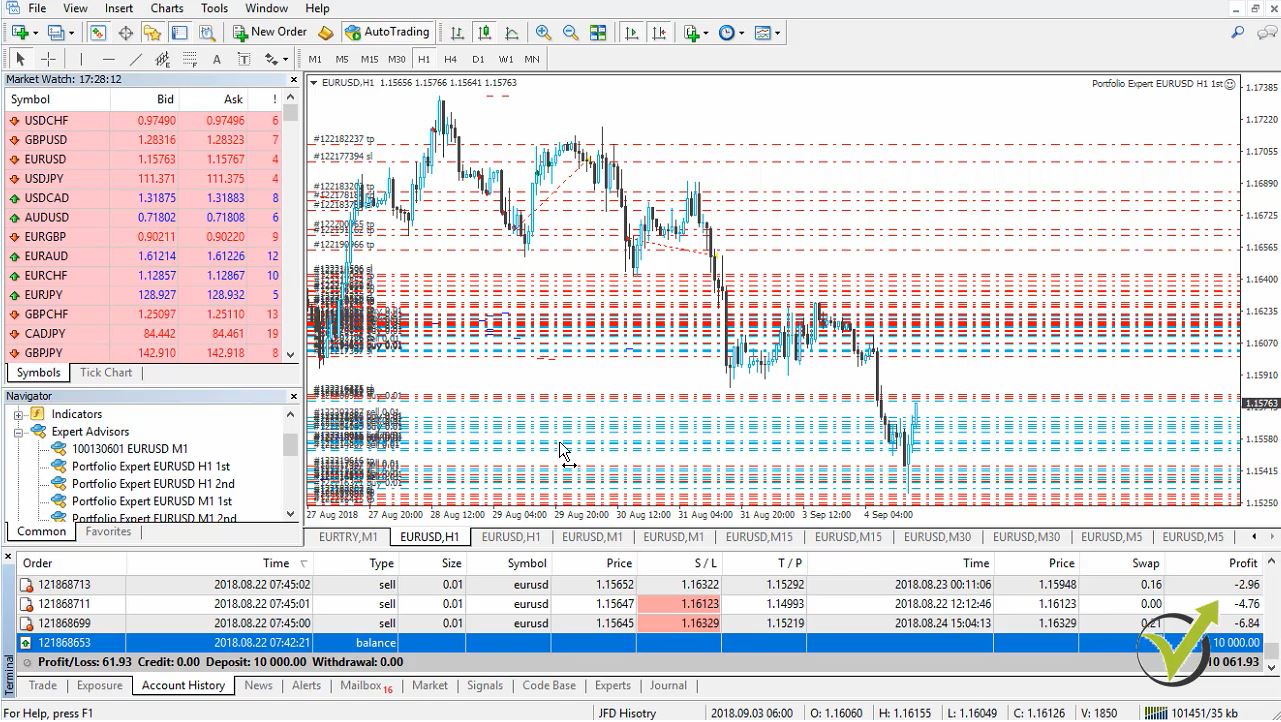
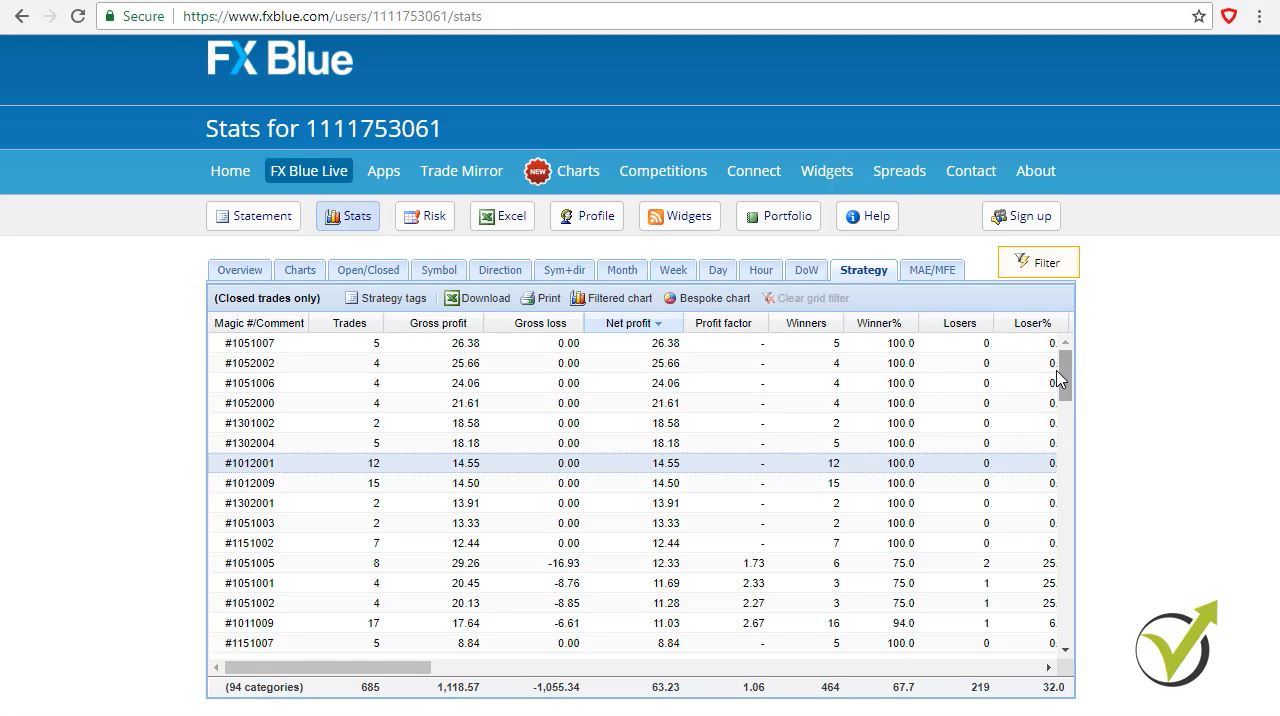
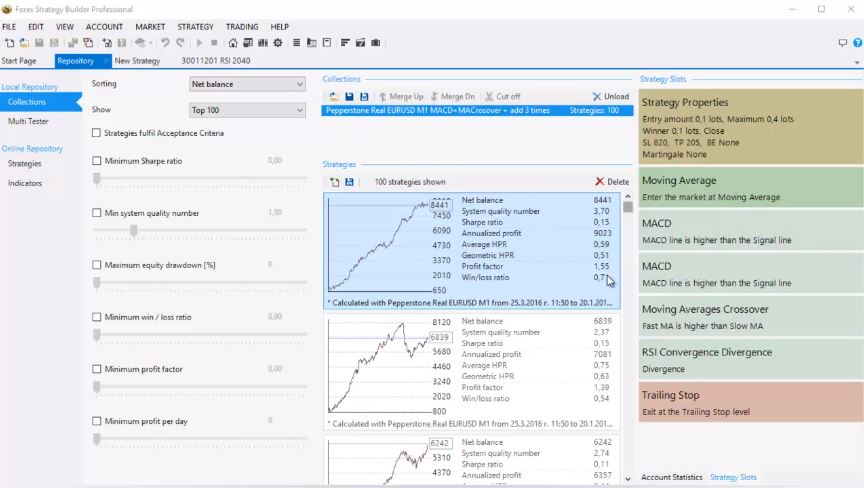
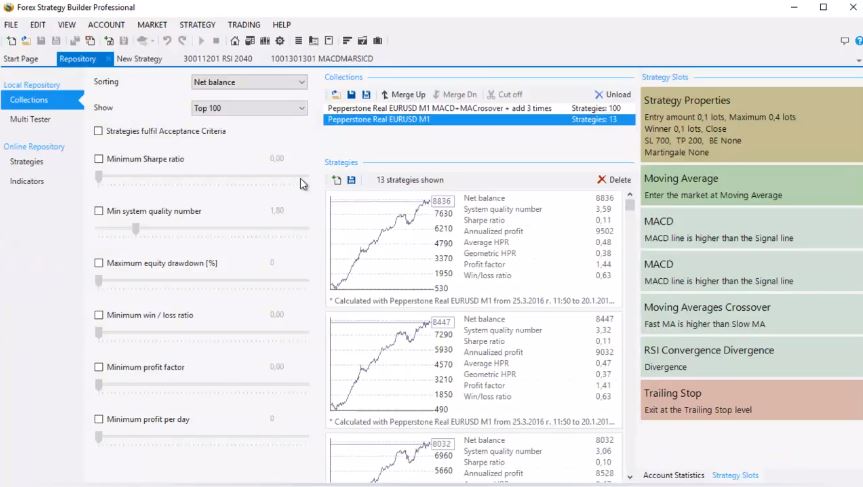
    Hello traders! This is Petko, and today I will talk about the new update in EA Studio. So if I go to collection, I have some collection here for EURUSD on the M15 chart, and I will click on any of the strategies. So far, when we were backtesting trading strategies in the backtest output, we had exact statistics, and we were not able to change it:

    backtesting trading strategies available
    Backtest Output

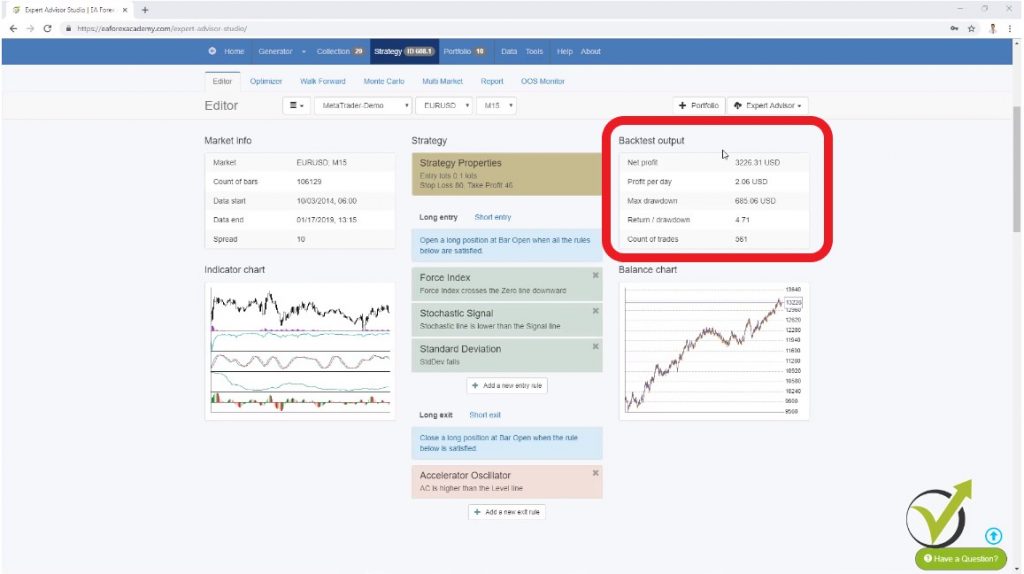
    But now, if I go to tools and below, you will see backtest output metrics. Here you can select which metrics you want to see in your strategy. You can see they are 5. So you can change it to any other metrics that you want to have while backtesting trading strategies.

    For example, the first one I will leave it to net profit, but then instead of profit per day, I can select maximum drawdown in percentage, then instead of maximum drawdown, I can have the R-squared.

    This is a new feature in EA Studio, which I will explain in some of the next videos about the EA Studio updates. It is very nice, and by using it, we can have a very lovely equity line with the strategies.

    And for example, I can change return to drawdown. I can change it with maximum stagnation in percentage. And instead of the count of trades, even I like to see the count of trades.

    I will select the win/loss ratio.

    This is a critical criteria when we are backtesting Forex trading strategies. And we can say it is one of the most important criteria.

    Alright, and if I go now to the strategy, you will see that I have the net profit, the maximum drawdown, R-squared, maximum stagnation, and win/loss ratio. So depending on which ones you want to see while you are backtesting trading strategies, you can change them from here from the backtest output metrics.

    Now, if I go to the strategy one more time and I go to report you will see very very interesting charts here.

    What can we do with the EA Studio backtesting trading tool?

    • backtesting Forex trading strategies
    • generating strategies over Historical data
    • optimizing strategies for better results

    So here, we have more information and a more visual outlook of the strategy, and I will explain each one along with the video.

    On the left side, we have the backtest output.

    backtest ouput settings
    Backtest output details

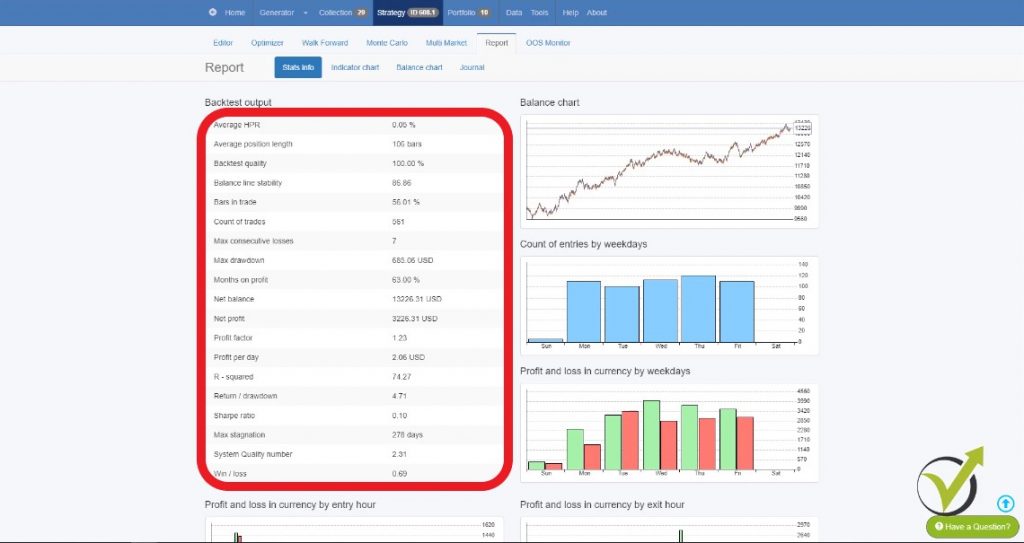
    Here we have some updates as well. We have backtest quality, which before was called to be maximum ambiguous bars. And for the new traders with EA Studio:

    “What that means while we are backtesting trading?”

    The ambiguous bars or the backtest quality is when we are backtesting trading strategy that uses stop loss and take profit, and the stop loss and the Take Profit is within the range of one bar.

    So let’s say in the backtesting trading strategy we have the trade open somewhere here, and then we have the stop loss and take profit within the range of this bar.

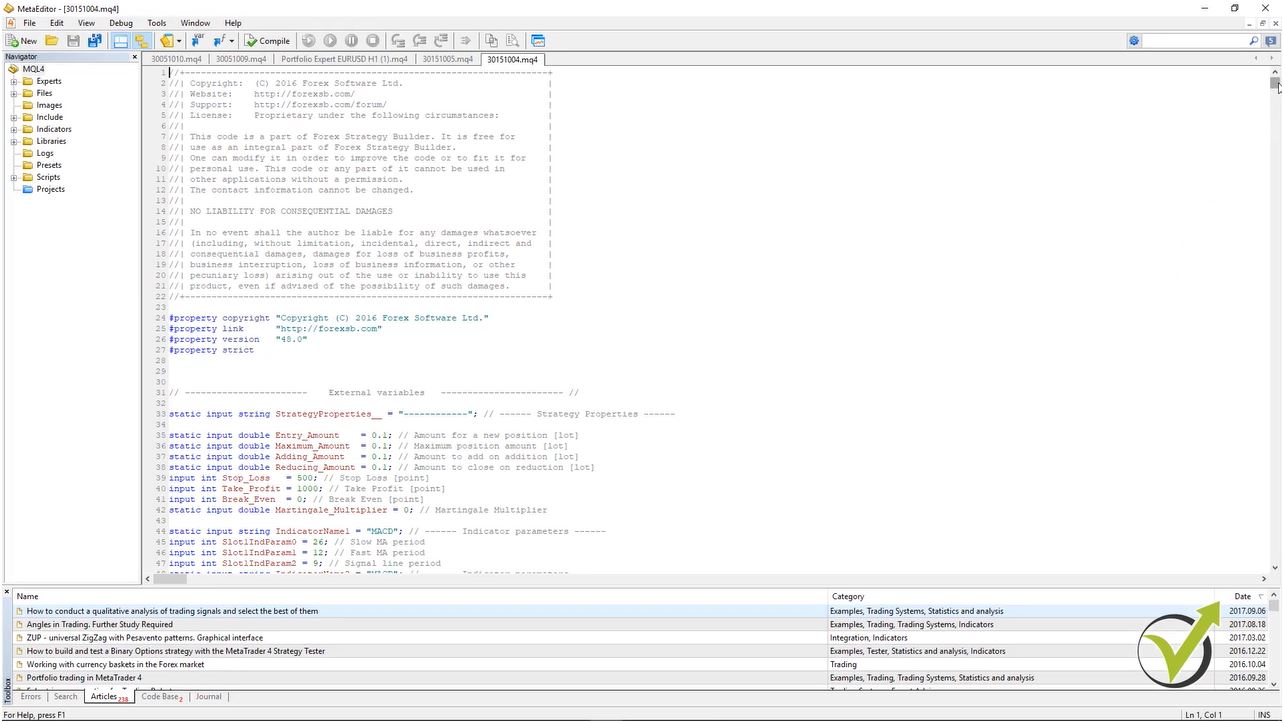
    So the program cannot decide which one was first. Did the price reach first the take profit? Was it Stop Loss? And it’s normal because what we have from the historical data is the open, the high, the low and the close.

    This is all the information we receive when we export historical data from MetaTrader. And here, the MetaTrader backtesting trading gives you a result that is better for you. So it will show you that the take profit was hit, but this is not the reality. We don’t know if first was the Stop Loss or first was Take Profit.

    While EA Studio uses an account protective algorithm.

    Meaning that when there are such bars, it will take it as a negative. If there are such situations or such bars, while backtesting the trading strategy, it will show you a more negative result. So this way, it will show the more secure result for the trader. It will avoid showing overestimated results in backtesting trading.

    So one more time here about the backtest quality, which before was known as ambiguous bars. This is when we have a huge bar, and our trading strategy has a stop loss and Take Profit within the range of this bar, and EA Studio, just like MetaTrader, doesn’t know which one was hit first the take profit or the stop loss.

    And EA Studio will always show the stop loss. So it will show you the more secure results.

    Going down to the backtest output, we have bars in trade. This is updated as well.

    Which is very interesting! We can see how active is our strategy. So here we have 56%, meaning that the strategy is trading nearly half of the time. We have the R-squared, which, as I said, I will dedicate a whole video in the next days, and I will explain what exactly that means and how you can use it while optimizing the strategies or while you’re generating strategies.

    Alright, so now on the right side, we see the balance chart, and then what we see is a count of entries by weekdays. So this is the count of entries. Please, pay attention to the names above the charts! It is set there exactly what it is. This one shows the count of entries:

    backtesting trading during the weekdays
    The chart shows us the count of entries.

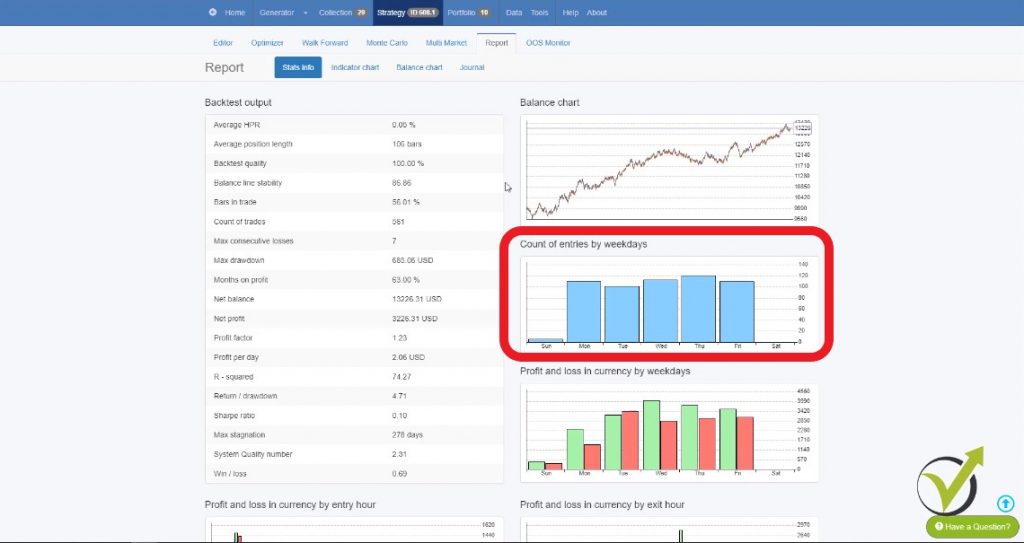
    This is not the profit, but this is the count of entries by weekdays. As you see with this historical data, we have some trading on Sunday. So there are some trades over there. And then on Monday, Tuesday, Wednesday, Thursday, you can see it is most active.

    So here with this visual backtesting trading stats, you can see if your strategy is balanced and if it opens trades every day during the week.

    Now the next one is profit and loss in currency by weekdays.

    How to backtest Forex trading strategies and see actual results?

    • The green one shows the profit
    • the red one shows the loss.
    profit and loss
    Backtesting trading by the count of trades per day

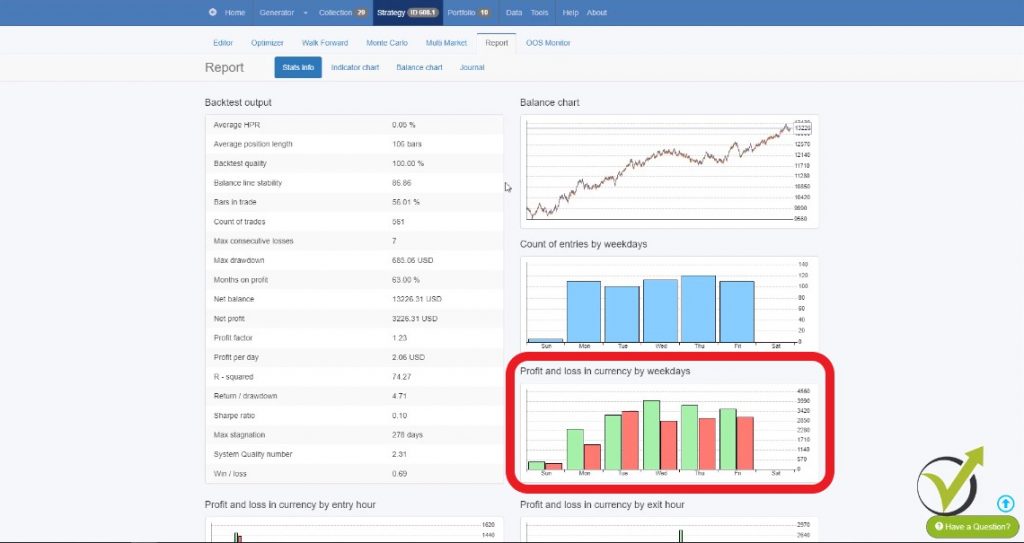
    And the first thing I see here is that this strategy on Tuesday makes more losses than profits. Here is in currency. So we can say this is profit and loss.

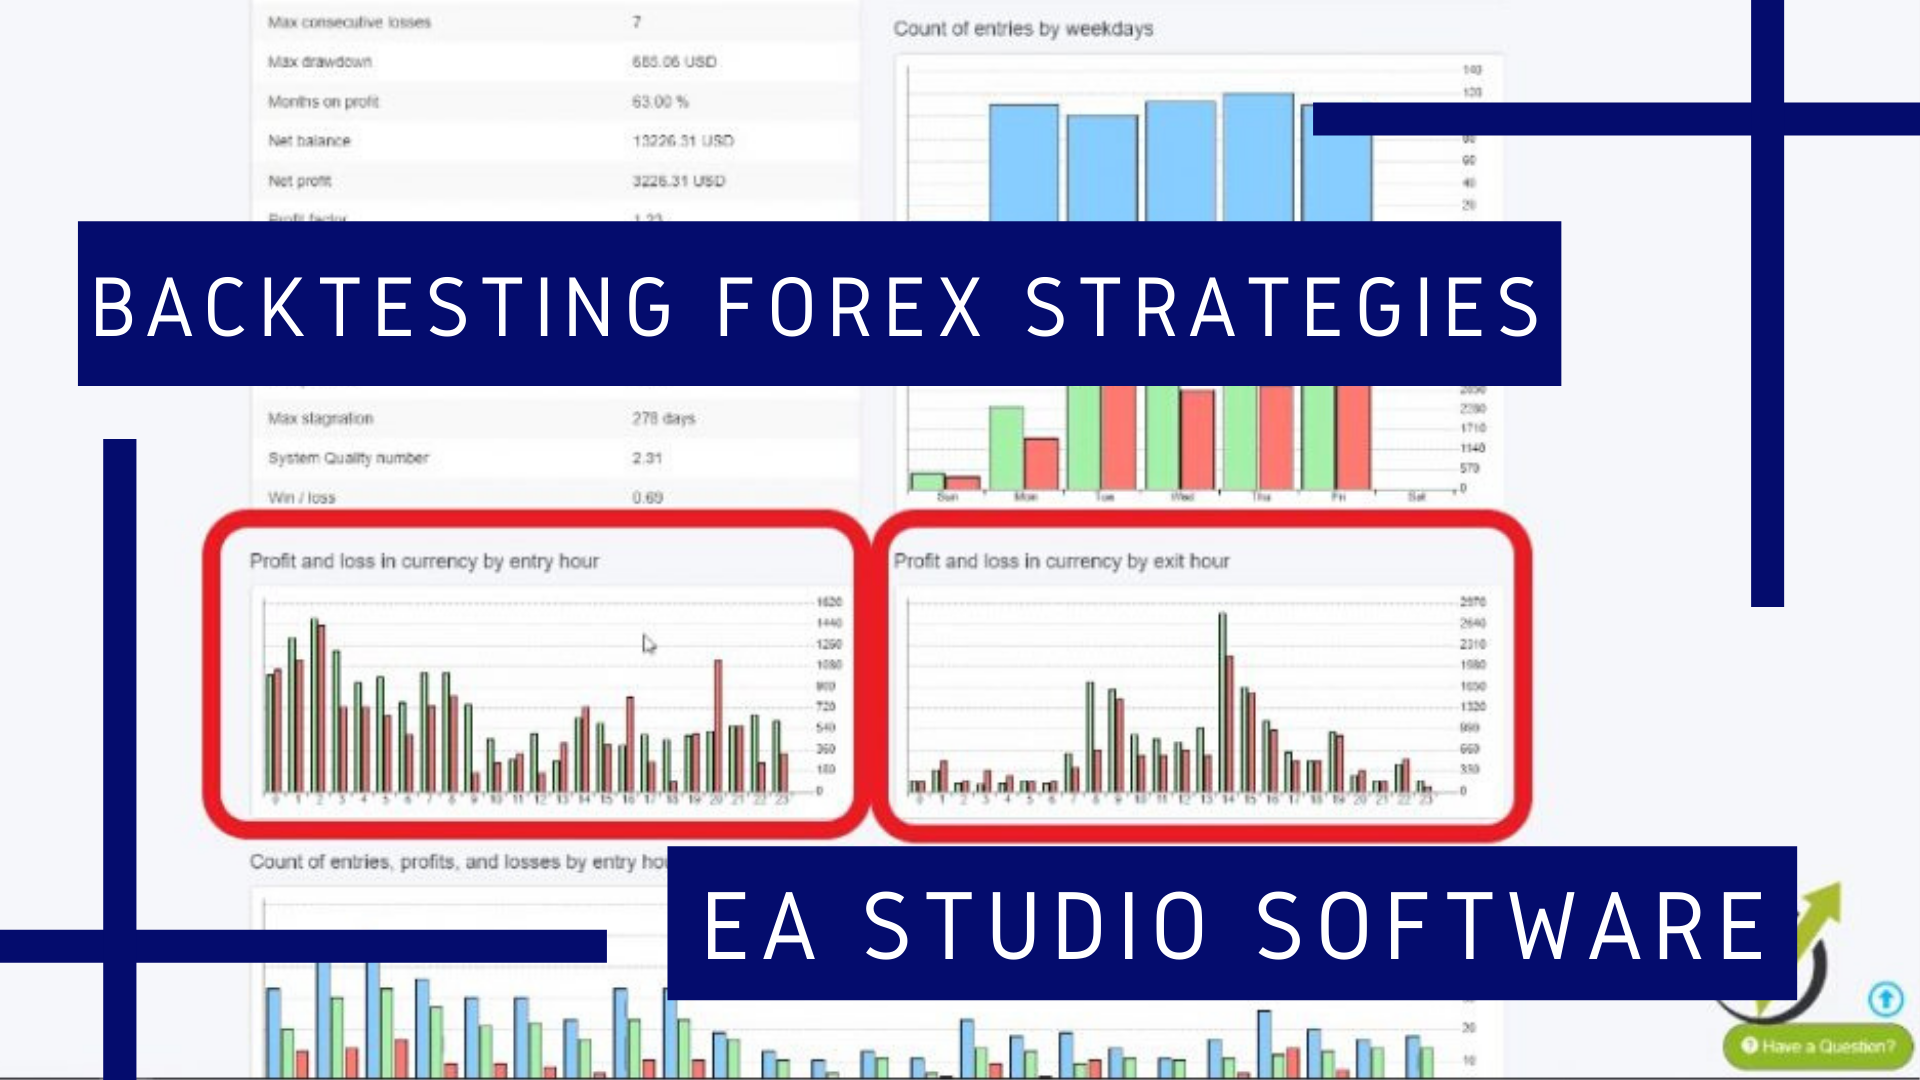
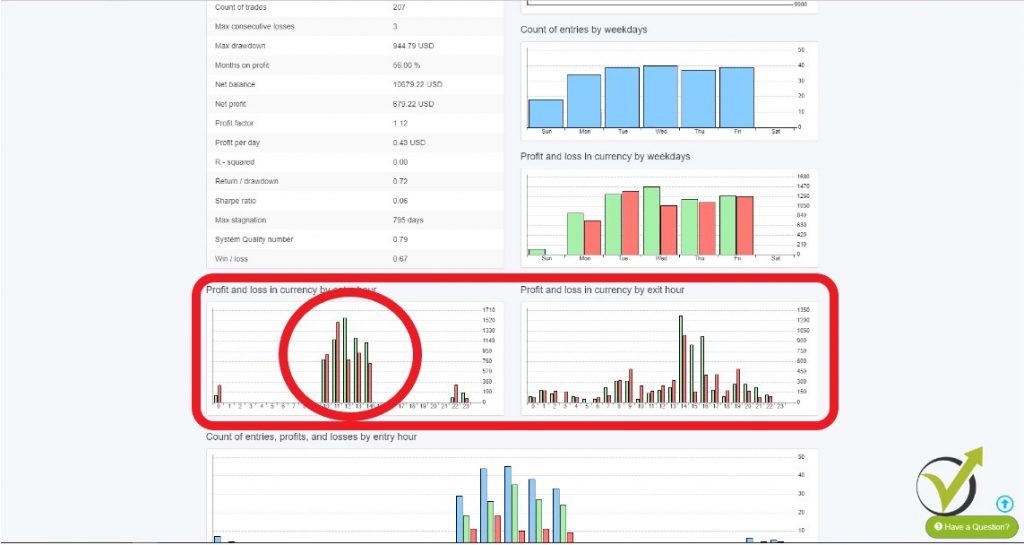
    Now we have profit and loss in currency by entry hour.

    Profit and loss in currency by exit hour?

    • during which hours this strategy makes more profit
    • when it makes more losses
    • the backtesting trading by hour gives us a better understanding
    backtesting trading by hour
    See if your strategy is balanced

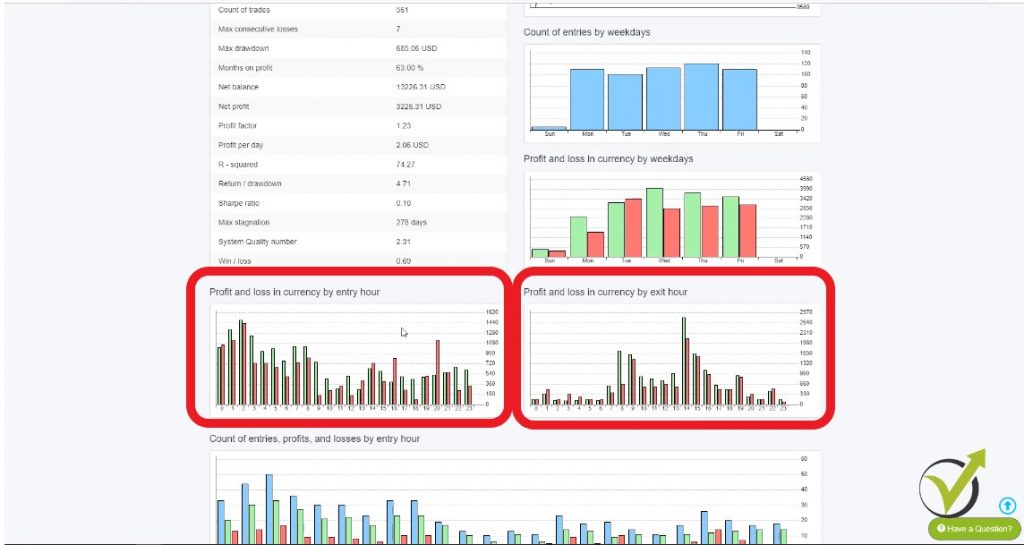
    Here obviously, the strategy makes more profit during the first half of the day. And in the afternoon, the trades that were opened in the afternoon, they are making more losses.

    So here one more time, please, carefully read what it says: Profit and loss in currency by entry hour.

    This means that we see the entries of the positions during which hours the entries are leading to a profitable trade and during which hours the entries are leading to losing trades. And here we have the exit hour.

    So here we can see between midnight and 6:00 we don’t have an exit, tiny exits here. Then we have good exits from 8:00- 9:00, and then we have a great exit at 2:00 p.m., and then we have smaller results by exit hour.

    Alright, and let’s see here what will happen if I go to tools, and I set Monday till Thursday for backtesting trading. So let’s change just the hours and see how the graph will change. Let’s make it from 10:00 trading till 14:00. And I will do the very same thing for Friday I will do it from 10:00 to 14:00 , and I will go to strategy, so you see it changed.

    I go to report, and you will see exactly where I have trading only between 10:00 and 2:00 p.m., but I have exited with the SL and the TP all the time. If the strategy has exits conditions, they will work only within the selected hours.

    trade during these hours
    Easy to see when the strategy is trading.

    Because this is only the entry and the exit could be at any time. And there is some trading over here at 10:00 and 11:00 p.m. I think this is just because of the trading on Sunday. Because this broker has some trading on Sunday, and I didn’t eliminate it.

    If I eliminate it, I will go back to the strategy, and I will go to report, and you see there is no such backtesting trading result over here. Alright, so I hope that by changing these hours I made it clear.

    This graph on the left shows the profit and the loss by entry hour.

    And on the right side, we have the profit and the loss by exit hour. Let me put it back to the normal that I’m keeping. It’s from midnight till midnight, okay. I’m not missing any trading time! And keep in mind that these settings in tools are general.

    And if you change them, and then you load some old collection or strategy or Expert Advisor, it will affect their backtesting trading report of this strategy.

    Alright, and I will go back one more time to the report, and I will show you what I have below. We have two more things. One is the count of entries, profits, and losses by entry hour.

    How to read the backtesting trading results?

    • blue bars show the count of trades during the backtesting trading
    • green bars are showing the profitable trades
    • red ones are showing the count of the losing trades
    backtesting trading with count of trades
    Stats by entry hour.

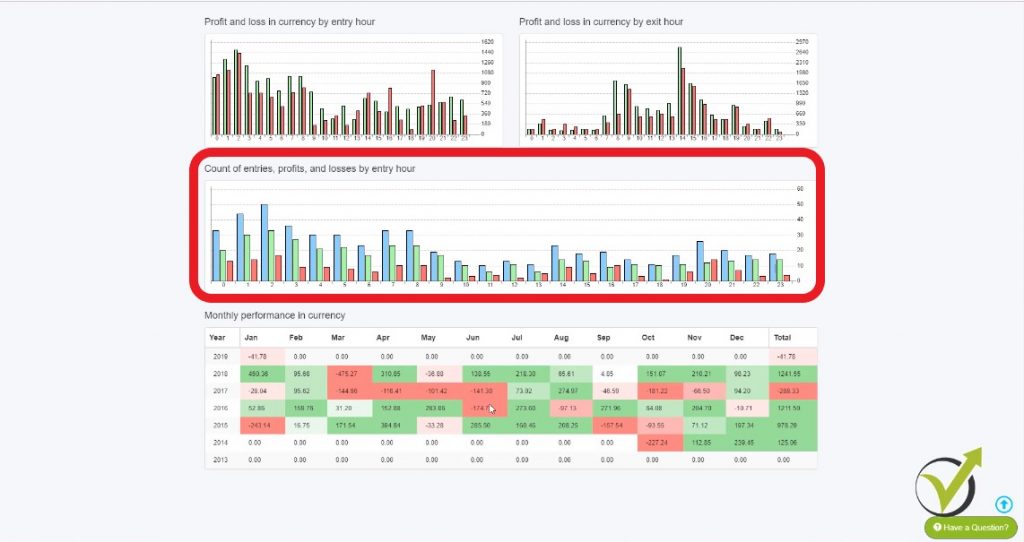
    The blue bar equals the green bar plus the red bar. So here we have the count of the entries, the profits and the losses by trading hours.

    Alright, and below, we have the monthly performance in currency.

    Many people are backtesting Forex trading strategies, and when they see a losing month, they give up from the strategy. It is quite reasonable to have a losing month with a strategy. Do not expect to make profits every day.

    Something exciting to me!

    You can see the results while backtesting Forex trading strategies for the whole trading period that we have with the entire historical data. In this case, it started in October 2014 and:

    • the months where we have huge losses are colored in red
    • those where we have smaller losses are in a lighter color
    • the profitable months where we have profits is in light green
    • where we have more profits is in darker green.

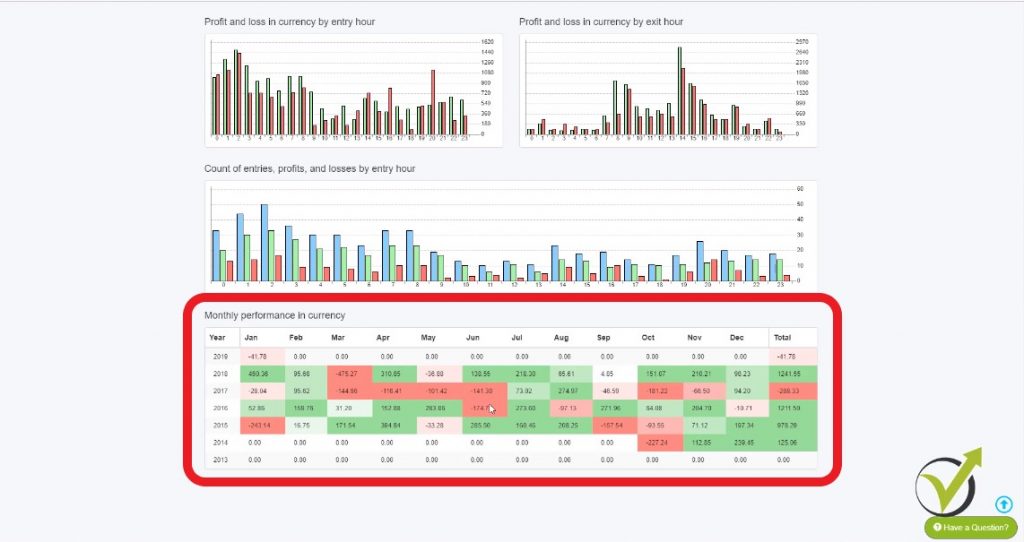
    And this way with the backtesting trading we can see, for example, that this strategy makes profits in July.

    It makes profits as well in February. With the other months, it is having some months on profits, some on losses. You can see in June it has two months on profit and two months in a loss.

    By having these statistics over here, you can have a much better idea about the trading strategy, about the profits and the losses.

    And if you decide, you can pause the strategy when it is not making a profit. For example, in the afternoon with this trading strategy or you can have a look at months as well. You can make a lot of conclusions over here, and it is up to you how you will use these statistics to improve your trading while you are backtesting trading strategies.

    This was about the statistical information that we have now as an update in EA Studio, which is very useful to analyze our work while we are backtesting trading strategies or when we are generating strategies, and we have them into the collection.

    We can quickly go to the report and have a better idea about the strategy, not only looking at the balanced chart but looking at all of these statistics.

    On our website you can see more information about EA Studio. In our trading Forum, we have a topic called EA Studio Updates. This is where you can follow all updates with the strategy builder EA Studio.

    It is updated all the time, and it is essential for you as a trader to follow along, so you will use the builder with its full capacity while you are backtesting trading, and while you are generating strategies.

    If you have any questions, you can always write in our forum and open exciting topics.

    Thank you for reading, and I wish you safe trading.
    Cheers!

    [sc_fs_multi_faq headline-0=”h2″ question-0=”What is Backtesting Forex trading strategies?” answer-0=”That is a process of testing a certain strategy over past Historical data on the market. The data normally is taken from the bar’s information – open, high, low, and close prices. This way the traders can see how the strategy performed for the last couple of month or years.” image-0=”” headline-1=”h2″ question-1=”Why is backtesting important?” answer-1=”The traders want to use profitable strategies. If a strategy was profitable in the past it has a higher chance to bring good results in the future. Backtesting the strategy is the only method to see if a strategy was profitable in the past.” image-1=”” headline-2=”h2″ question-2=”How do you backtest a Forex trading strategy?” answer-2=”There are different methods to backtest a strategy. You can use the MetaTrader platform if you have an Expert Advisor for the strategy and use the backtester. If you do not have it, you can use any strategy builder which will help you with the backtest.” image-2=”” headline-3=”h2″ question-3=”How backtesting strategies will improve my trading?” answer-3=”It is much better to have a strategy that is backtested compared to trade with a strategy that has no backtest. The backtest is a huge advantage for many traders because they can analyze and improve their strategies.” image-3=”” count=”4″ html=”true” css_class=””]

  • Trend Following Indicators in MetaTrader

    Trend Following Indicators in MetaTrader

    Trend following indicators – the first group of indicators in MetaTrader.

    Trend following indicators is what we will talk about here. Hello, dear traders and welcome to the trend following indicators section.

    In this section, I will go through all the indicators, that are available in MetaTrader, and I will show you the very important from each one. And I will not go to theories and formulas and very, very complicated things.

    Because you really don’t need to know what is the formula, for example, behind the indicator. What you need to know is how to put it on the chart, how to read it and what signal the indicator gives us and how it helps our trading. And we need the indicators because if we don’t have indicators, if we just look at the plain chart over the candlesticks or the bars, we cannot understand and we don’t have an idea where or when to enter or to exit from the market.

    Now, the indicators in MetaTrader are grouped and I will start in this first lecture with the Trend following indicators. If you look at my chart, I have just made my chart bigger by removing the terminal. And actually, from view, you can remove the terminal, the navigator, the data window, the market watch or you can choose to see the strategy tester.

    This is for the Expert Advisors and you see on the right side there are the combinations. So, for example, the Navigator is Ctrl + N. And you see if I press Ctrl + N it will disappear, and then it will appear again. And it is the very same for the others.

    So just now I want to have a little bit bigger chart in front of me where I will demonstrate to you how to place the trend following indicators over the Meta Trader chart.

    Now basically, you have two options.

    One is from the navigator. You need to click on the plus in front of the indicators and here you will see all indicators. They are grouped in Trend following indicators, Oscillators, Volumes, Bill Williams and then we have the custom indicators below. Or you can place them on the chart:

    trend following indicators
    The Path to the trend following indicators

    If you go on the top menu and you go on insert, indicators and you see here we have some of the trend following indicators.

    What groups of indicators we have in Meta trader?

    • Trend following indicators
    • Oscillators
    • Volumes
    • Bill Williams
    • custom indicators.

    So the good thing with the Meta Trader as we said at the beginning of the course is that you can place custom indicators. If you have bought some or if you have found them somewhere online. You can place them over here.

    Let’s have a look now at the first group. Where are the trend following indicators, and I will go to the Average Directional Movement Index?

    trend indicaotr
    ADX indicator.

    This is a trend indicator that comes from Mr. Wilder, a very famous trader during the last century. The basic strategy that we have over here is that he recommended to buy when the positive DI is higher than negative DI. And selling when the positive sinks below the negative. If I put the mouse exactly on it you will see this is the negative one, which is in this bright yellow color, and then I have the green one which is positive.

    And all trend following indicators in Meta Trader, you can customize. If I go to indicators list and here is the Average Directional Movement Index I go to edit. You can see there are the colors so you can change it to any other color, which will make it more visible.

    You will see now, it is red so it’s much more visible where is the line. And with very simple words here this trend indicator helps to determine if there is a price trend or not on the market. And by crossing he said that we will filter, actually, the entries and we will have fewer entries there. This is the very, very basic theory of this indicator.

    Now, let’s go to the second trend indicator.

    This is the Bollinger Bands. This is one of my favorite trend following indicators in Algorithmic Trading. It is represented by two lines, which are going over the price and the other one is going under the price and then there is one middle line as well:

    great indication
    Trend following indicators: Bollinger bands

    This indicator is very, very similar to the envelopes, another indicator we will look at. And the main difference is that envelopes are having constant distance between the upper and the lower line and the Bollinger Bands are having a certain number of standard deviation away from the middle moving average line.

    And if I just move the chart a little bit you will see what’s going on when there is volatility. Actually, when the price makes a huge move the Bollinger Bands are getting far from each one. And when the market is calm there is no huge movement. They are getting much closer.

    So there are different strategies here as well.

    For example, one is that if the price break through one of the bands. We can expect that the price will continue in this direction or just the very opposite that, if the price gets out of the band or if we have a closing below the band. And then we have a closing above the band we might expect to reverse or the third strategy over here.

    Which is a very simple move starting from one of the band always reaches to the other band. So there are many variations using this Bollinger Band trend indicator. Which as I said I am using a lot in Algorithmic Trading.

    And of course, as said already you can change or customize the indicator same as all trend following indicators in Meta Trader just to make it more visual or comfortable for you.

    The third among all trend-following indicators is actually the Envelopes:

    trend following indicators enevelopes
    The banks always keep the same distance.

    So what I’ve said is that the two lines here are keeping a constant distance between each other and you can see they form kind of trend direction when the price is going up. Now, you can see on M1 on NZDCAD (I just picked random here) the chart, guys, doesn’t matter I just want to show you the trend following indicators.

    Let’s go to a higher time frame like H1. So what you will see here is that this indicator is lagging after the price. So the price went below it then it’s changing direction downwards, and then the price broke above. And then the Envelopes are getting higher. If I continue you will see that simply the Envelopes are following the price. And from the inputs of the Envelopes, if you change the deviation percentage.

    So for example, if I go to 1% there will be a bigger distance between these two lines. And these two lines are simply moving averages. Which are shifted upwards and downwards and the very, very simple strategy here as well is that when the price touches one of the Envelopes it will go in the other direction. So we need to buy. And this I can say is for the range market when the market is in range.

    But when it is trending you can see when the price broke this Envelope, moved above the upper band actually of the Envelopes. So again I say there are different variations of the strategies but this is how the envelopes look in Meta Trader.

    Now, let’s remove this indicator and proceed to the next one.

    And the fourth between all trend following indicators here is Ichimoku indicator. Which is a very interesting indicator. Very colorful on your chart it has this cloud that normally plays the role of support and resistance. So when the price is above the cloud, the cloud is support. And when the price is below the cloud, the cloud is resistance and we have these lines:

    interesting trend indication
    Ichimoku trend following indicator.

    One is the Tenkan-sen, the other one is the Kijun-sen, Senkou-sen span A and Senkou span B. Which are actually forming the cloud. And again here for the strength indicator, there are many strategies that could be used. Normally, we have a standard strategy for each indicator and with the time, of course, many more were invented.

    Now, going to the fifth indicator.

    Which is the Moving Average, probably one of the most famous trend following indicators in all times. It is just a line that follows the trend. We can say with very very simple words. There are different methods to calculate the moving average.

    What are the different methods to calculate the Moving Average?

    • Simple MA – the base in many trend-following indicators
    • Exponential – is the one that many manual traders prefer
    • Smoothed – goes together with the price
    • Weighted – gives more weight to the current price

    These are the four methods that are used in Meta Trader. Let’s place a simple moving average period of 50 on our chart and you will see how this moving average follows the price. So here again many strategies that we could buy when the price goes above the Moving Average:

    just one line
    Moving Average indicator

    We can sell when it goes below, we can buy again. But if you have already experienced you will know that the Moving Average works well when we have a trend, when we have a strong move. But when the price is in range, so for example if we concentrate over here we will buy, we will sell, we will buy, we will sell so many times that most probably at the end you will end up losing for this period of time.

    That is why when we combine trend following indicators the best results are coming. That is why later on in the course I will show you how it is best to combine a couple of indicators instead of using only one indicator. And actually combining indicators make the entry on the market stronger and simply this way we filter the entries.

    I will continue with the sixth between all trend-following indicators that we have here.

    This is the Parabolic SAR:

    trend following indicator SAR
    SAR indicator

    I will click on OK and actually not really visual with my white background so let me just edit it. I will change it to black. And you will see I have these dots that are on the top of the price, then we have dots that are below the price and actually this indicator is very, very similar to the Moving Average indicator but looks different from the other trend following indicators.

    Let me just zoom it. But it looks really different because it’s displayed above the candlesticks and below the candlesticks. It shows when the price is in a bullish market, so meaning that the price is going up.

    So we have the indicator below each candlestick and when the price crosses you can see here I have one, two, three the price crossed and it changed. So the market changed and here again the price crossed and the dots came under. And then when the price crossed again they came above. Actually, this indicator gives great signals for exits.

    If we are on the market, let’s say we have bought somewhere here for any reason, and when the price breaks this SAR indicator, the Parabolic SAR trend indicator. It is time to take our profit because probably the market will change direction after that? So it gives us great exit signals.

    And the last indicator that I will talk about in this lecture for the trend indicators, this is the Standard Deviation.


    just a line below the chart
    StdDev indicator

    I will just use the standard inputs as I have used in the previous examples. Now, with very, very simple words here, if the value of this indicator is low it means that the market is not volatile, it’s inactive. And we can expect some volatility. Or when we are having high value for the indicator we can expect the market to calm down and to get into range for some time.

    And if I switch, for example, on M15 you can have a look at the indicator as well. And actually, all trend following indicators are used on different time frames. So it really depends on your strategy, what strategy you have and how you are using these indicators.

    So these were the trend following indicators on the Meta Trader platform. And in the next lecture, I will continue with the Oscillators indicators in Meta Trader.

    Thank you very much for reading.

    If you have any questions, please write in our forum!

    All of these you can find on our website.

    Cheers!

  • Robot Trading Forex: EA Expert Advisor Meaning

    Robot Trading Forex: EA Expert Advisor Meaning

    Robot trading Forex – the inelegant way to trade nowadays.

    Forex robot trading is what I will talk about in this lecture.

    Hello, dear traders, this is Petko Aleksandrov and I will explain what exactly is robot trading on the Forex market.

    And for the very newbie traders, who have no idea of algorithmic trading, I will show you very systematically what is EA robot trading in Forex.

    How we are using them in EA Forex Academy and how useful it could be. Because it saves a lot of time and resources when it comes to staying in front of the computer the whole day to follow any strategy on our trading screen.

    EA Forex meaning and application:

    • EA Forex stands for Expert Advisor on the Forex market
    • Expert Advisor is the trading Robot that a trader uses
    • Forex is the biggest market in the world
    • EA Forex meaning that one trades with Robots on the Forex market

    So here I have the USDJPY chart opened on M5 and you see I have many trades opened. Now let’s say I will have an example strategy for the USDJPY and I will have entry condition for example MACD line rises on the higher time on M30. As well I would like to have MACD line is higher than the signal line on H1.

    Building the strategy on the chart?

    I will need to open on M30 one indicator MACD, right? I will go to Insert, Indicators, Custom and I go to MACD and I will use just standard inputs of 12;26;9 and I will click on OK. And you will see here is the MACD indicator.

    So I have the indicator on M30 and if I switch the timeframe you will see that it remains on H1 as well. And actually, it will be on all timeframes.

    What we said is that on M30 we would like to have the entry condition MACD line rises. And the MACD line is the line that connects the bars on the MACD, OK? The red line is the signal line:

    EA robot trading Forex chart with MACD
    USDJPY chart with MACD indicator

    And in some platforms, you will see it like two lines MACD with some bars as well which are normally the difference between the MACD and the signal line.

    But here on Metatrader, we see the signal line, which is the red line. And then we have the MACD which is the line connecting the bars. So here one of the entry conditions is we want to have M30 MACD line rises. So whenever it is rising on M30 it allows us to enter on M5, okay? And at the same time, we have MACD line is higher than the signal line on H1.

    This is all the time when the MACD line is higher than the red line.

    And when it’s below we don’t have the permission to enter. So when these two rules are true we can enter, okay? So these are the filters that we have on M30 and H1. Please, follow carefully as you will see why Robot trading Forex is needed in more complicated strategies.

    What we have on M5 is MACD line changes its direction upward. Whenever the MACD line changes its direction upward meaning that we need to have one bar with bigger value than the previous one. Then we will have a change. So one is here and then we have one over here and then we have one over here.

    So all of these changes give us an entry signal. And one more thing on M5 we need to have a fast moving average is lower than the slow moving average.
    I will go to insert, indicators, trend and I go to moving average. One of the moving averages will be with a period of 100 and here MA Method I will choose simple.

    It’s a simple moving average

    And I will stick with the red color. So you can see and now I have here the moving average when I put the mouse on it you can see exactly the value of the moving average. So this is a 100 moving average:

    Robot trading Forex Moving Average of 100
    Moving Average of 100

    And then I will go to insert, indicators, trend and I will go to moving average.

    I will place a faster moving average period of 50 and I will choose another color to make the difference I’ll just choose a blue color and I will click on OK. With Robot trading Forex, you will now need to pay attention to the chart.

    Alright, the moving averages, these are an average value for the last X number of bars. In this case, we have 50 and 100 and the calculation is very simple over here. If we have 50 this means that it takes the closing value of the last 50 bars and it summarizes it after that it divides it by 50.

    And this way we receive a smooth line showing the direction of the price. So the smaller number we have we call this to be a faster moving average because it will go faster, closer to the price, okay? As you see the 50 line is getting closer to the price when the price felt over here and then the 100 moving average is a little bit slower when it is going down towards the price, okay?

    Here we have a fast-moving average is lower than the slow moving average.

    This is the period when we have the confirmation to enter the market on M5 charts. So one more time
    the entry conditions are:

    What are the entry conditions for the MACD strategy?

    • MACD line rises on M30.
    • On H1 we have MACD line is higher than the signal line
    • On the default chart on M5 we have MACD line changes its direction upwards plus fast moving average is lower than the slow moving average.

    And this strategy as well has exit condition such as stop-loss equals to 50 and take profit equals to 100, okay?

    So once the trade is open it will have Stop Loss of 50 pips and Take Profit of 100 pips.

    The strategy has one more exit condition.

    EA robot trading Forex uses indicators over the chart
    The EA uses indicators over the chart

    Which says envelopes and this is exit long at a lower band. So it’s another indicator that I should place over the chart. And you see if I do this manually it will be really hard to follow everything, right? But with the Robot trading Forex, you will!

    I will need to look at H1 chart I need to look at M30 chart and I need to look at a couple of things on M5 chart. And being at the end at the current price means that I will need to stay in front of the computer a long time or at least I need to wait to see two of the confirmations.

    Actually, first you will need to look at H1 and if you have the confirmation there you will go to M30. And if you see confirmation there as well you will need to go back to M5 and then wait for all the confirmations here in order to open the trade. So it’s like you can spend a couple of days watching the chart and it’s very possible that you will miss the entry, right?

    Because you will be away from the computer even you wait a couple of hours or you are actually standing up for a cup of coffee or to take lunch. And you’ll miss the trade you will be late.

    Here comes the robot trading Forex very useful.

    All of these entry and exit conditions they could be placed in robots.

    So it will automatically follow the H1 chart, it will follow the M30 chart, and it will follow all the entry conditions on M5. And once the trade is opened it’ll actually follow when the exit condition is there. It will place the stop loss and take profit and basically, you really don’t need to do anything except placing the Expert Advisor over the chart.

    And this is the name of the code for the robot trading Forex. If I go here on the navigator of the left side you will see that I have currently here in this account ten Expert Advisors.

    So these are ten robot trading codes that I have. And on this chart, that I’m just showing at the moment, I have such a robot trading Forex but it’s for another strategy. And the strategy that I have described is with 0 0 4 at the end. It’s from one of the recent courses that I have launched: “The top ten USDJPY Expert Advisors”.

    And if I go to this Expert Advisor you will see that if I right-click over the chart and I go to Expert Advisors and I go to properties that here is exactly the strategy that I have described.

    What are the parameters for the MACD robot?

    •  Stop Loss and Take Profit,
    •  two MACD lines the third MACD.
    •  envelopes, the fast and slow moving average.

    And the other thing is that I really don’t need to place the indicators over the chart.

    It doesn’t matter that I have placed these indicators on another robot trading chart.

    I just wanted to make it clear for you.

    But here I have this Expert Advisor, this robot trading Forex and it trades automatically. You can see here it took a great trade it opened over here and it closed over here. So this was a nice profit that I had with this trade. So by using robot trading Forex, I am able to trade many robots in one trading account. Which is absolutely impossible to do manually so many strategies like ten strategies having in one trading account trading simultaneously.

    What you will need to do if you want to do it manually?

    You will need to click around the charts and put so many indicators over the chart. It will be a real headache and you will miss so many entries. Which will actually distract your trading and will not show proper results.

    How is that possible?

    I do this with the Forex Strategy Builder Professional. This is one of the top strategy builders nowadays. So you see here I have all the entry conditions. If I want I can change any of the parameters, I can add another opening logic condition to make the entry stronger if I wish to, or to place another exit condition.

    robot trading Forex with FSB Pro software
    Robot trading Forex with a Forex Strategy Builder Pro.

    I can change the stop-loss, the take profit, and I see the balance line for this strategy starting if you look down here on the blue bar you can see this is from 2014 till the moment. I have a very good stable equity chart. This proves to me that this strategy is actually profitable. And the Forex Strategy Builder Professional is a very nice tool when you don’t have programming skills. Because you can export the Export Advisor with one click, ok?

    So you go to save as Expert Advisor and you can save it for Metatrader4 or Metatrader5. You don’t need to hire a developer to automate the strategy for you, you can easily export it from over here. Once it’s exported I place it on the Metatrader.

    And how I do that?

    I go to file, open, data folder then I go to MQL 4 and I go to the Expert. So here are the experts and if I click on the one with 0 0 4 you will see the actual code of the robot trading Forex Expert Advisor. So here in the beginning normally we have the indicators, the parameters and below we have all the conditions. This is quite a long code:

    The MQL code for the Expert Advisor
    The MQL code for Expert Advisor

    If I go down you will see this is about 6700 nearly 8000 lines. And if you need to code this it will take you a long time and if you hire a developer it will take a lot of money as well. So with the Forex Strategy Builder Professional we can automate any Expert Advisor and we do robot trading Forex much easily.

    So this is about the robot trading Forex – simply this is a code that stands behind any strategy we want to trade. And it gives us the opportunity to place many robot trading Forex Expert Advisors in one account. This way we diversify the risk and this way we achieve better results.

    Also, if we trade with many strategies simultaneously we cannot follow it all manually. But we Robot trading Forex, we can trade up to 99 strategies into one account in Meta Trader. Something that you will need about 20-30 traders to do this manually, and tons of money to developers if you code this. We have just made is simpler and easier…

    Thank you very much for reading and I wish you always to enjoy trading!

    If you have any questions you can always write in our Forum.

    Cheers!

    Looking for a Forex trading robot to download with no strings attached? Download our free EA robot trading Forex and try it out!

    Enter your email address to receive the free Forex robot download link.

    * indicates required
    What is EA Forex?

    EA stands for Expert Advisor. That is an automated strategy for trading. Forex is the biggest market in the works where the currency rate is determined. So EA Forex means that one is trading on the Forex market with robots.

    What is EA in MT4?

    EA in MT4 is an Expert Advisor (trading robot) that is used in the MetaTrader 4 platform. That is the most common and free platform for algorithmic trading.

    Do Forex robots actually work?

    The robots are automated versions of the strategies. This way the traders avoid the emotions while trading. If the strategy is profitable, the EA will be as well.

    How to add an EA to MT4?

    When you have the mql source file ready, you need to go to FIle->Open Data Folder->MQL4-> Experts and paste the file. Click refresh on Expert Advisors in the Navigator tab and you will see the Expert. Drag over the chart and click on OK.

  • Magic Number Forex – The Forex Expert Advisor

    Magic Number Forex – The Forex Expert Advisor

    Magic number Forex – the tool to follow algorithmic trading results

    Magic number Forex is the topic in this article, and here I will talk about the Expert Advisors themselves. These are automated strategies. So let say you have a normal strategy, a manual strategy that you learn from somewhere, you saw some video, you read it in the book and you are applying it daily. But with the time, you will notice that you are missing so many entries. All right?

    Because obviously, we are human beings. We cannot sit in front of the computer for 24 hours from Monday to Friday. And this where the Expert Advisors with their Magic number Forex can be beneficial because they trade all the time.

    Let’s say you are a trader, and you have a trading strategy. You would be able to follow it 8-10 hours per day or a maximum of 12 hours. The other 12 hours, you are missing many trades. What if you have 2-3 strategies, would you be able to follow them simultaneously?

    The solution is to trade Forex Expert Advisor

    Many traders think that algorithmic trading and the Forex Expert Advisor is something tough and complicated. It was before, and it not anymore. There are strategy builders. Nowadays, everything is automated and secure. You do not need to be a developer to build your website. You do not need to be a developer to develop your Forex Expert Advisor.

    Simply these are codes that we attach to the Meta Trader platform to trade automatically.

    The Forex Expert Advisors are structured in a file, and we attach this file to the Meta Trader platform.

    If you have experience in buying Forex Expert Advisors from the market place, you would know that they normally give you the ready ex4 or ex5 files. They do not give you the code. In all of our courses, we give the code and we teach the traders how to compile those into Forex Expert Advisors.

    If any of our students is a developer he can add something to improve the code for himself, why not?

    Just what I have already shown that they execute the trades automatically, and we don’t need to be in front of the computer. We don’t need to do anything. Once we place the Expert Advisors over the chart, we set the Magic number Forex, and we leave it to do its job. All right?

    Now, if you look again on my chart, I will right-click on one of the Expert Advisors, and I will go to modify. This is from where you can see the code of this Expert Advisor, and it opens in the Meta Editor.:

    Magic-number-Forex
    Code of the Forex Expert Advisors.

    Now, if I scroll down, you will see that we have long code for each Expert Advisor, and if I go down to the end, you will see it’s about 7000. In this case, it is 6 757 or 56 rows to the end. It’s a huge code. It is much longer than the Expert Advisors we have created with EA Studio.

    How are the expert advisors in FSB Pro different?

    • possible to follow on the higher time frames
    • many more options in the settings of the Expert Advisor.
    • possibility to add to the position, to reduce from the position, to reverse the position
    • custom indicators are available to download
    • to add custom indicator you would need to have it in C++

    And if I go to the top, you will see where we have the indicators parameters, and I can change the Stop Loss and Take Profit after that.

    In the code as well, you can change the Magic number Forex.

    So what is the Magic number Forex?

    This is the tool that we set in the Expert Advisors to follow the results after their trading. The Magic number Forex is used when we connect our trading account with the statistical website to track the results. Also, when we have many Expert Advisors trading in one account, and we look at the History, we use the Magic Number Forex to recognize which is the EA that opened the trade.

    I will need to click on Compile, and it will change the Expert Advisor inside the Meta Trader. And below, you can see I have the other indicators from this Expert Advisor, and pretty much this is what I know from the Expert Advisors code.

    I’m not a developer, and I don’t know what all these things mean. Of course, with the years, I have learned some things, but I’m not touching anything of the code, and I don’t suggest you do that. If you are not an advanced developer. And all of that came with the 

    FSB Pro that I have used to create these Expert Advisors.

    Keep in mind that with FSB Pro we can create not only Forex Expert Advisors but for commodities, stocks, indexes. It depends on what Historical data you will import in the program. Here is a video where I explain more about the data, and how to import it:

    So I didn’t hire any developer to do that for me. It would be very time consuming, and it will cost me a lot of money.

    I have been through this process already where I was hiring developers to program or to automate the strategy. For me, it was time-consuming. It was costly. These guys take a lot of money for that, and it’s tough because they need to have an idea about Forex or Trading. And it was taking nearly one month to develop the whole Expert Advisor.

    Obviously, after that, there were mistakes.

    I had to give them the Expert Advisor back. So I was testing it then giving it back. And then again and again, and sometimes it was taking a couple of months for one single Expert Advisor. Very expensive, time-consuming, and this is a hard thing that I’ve been through. Even they forget to place the Magic number Forex, or they had no idea about it, so I had to explain basic concepts…

    However, when the Strategy Builders came up, it is so much easier for me, and for many traders the algorithmic trading became much more easier. And we do it much faster. We have all the indicators there, Sl, TP, Break even, Magic number Forex, and all we needed.

    So what you saw above is from where we have access to the code.

    You can compile it, and this is the very same thing just what I have shown to you if you right-click over Expert Advisors and click on Refresh. Still, this forces Meta Trader to compile the Expert Advisors.

    The 2nd thing I wanted to show you:

    How you can change any of the parameters from the trading chart, and it’s better. So once you have any of the Expert Advisors, placed over the Meta Trader. You can right-click, go to Expert Advisors and go to Properties:

    expert advisors set up
    The tab from where you can change the Magic number Forex.

    This is from where you have the inputs, and this is from where you can change any of the inputs much faster, much more comfortable.

    No need to go into the code!

    What can we set in the Expert Advisors?

    • The amount for a new position
    • How many lots you want to trade with
    • What is the maximum position amount
    • Magic number Forex

    As I said already, you can add to the position on the next same entry signal. Below is the amount to add, and then you have amount to close on reduction. But for these strategies, I have selected to reverse. So when you have an opposite signal, they will close the existing trade, and they will reverse the position. Below you have Stop Loss, Take Profit, Break Even.

    We don’t have it for this strategy, and then we have below the parameters for the indicators and the magic number Forex. You can write as well a log file, and if you click on True, you will be able to write a log file if you want for your Expert Advisors. And pretty much this is about the Expert Advisors. Nothing complicated.

    How is the Magic number Forex useful?

    • Follows the performance of the Expert Advisor
    • the computer is discounted from the Internet
    • the platform is restarted it will detect the opened trades
    •  connection to the server is lost

    And you reopen it after that, and you have already begun trade, just as I have, the Expert Advisors will recognize the opened trade with the magic number Forex. OK?

    So they will not open a new trade. So if I restart my computer and I reopen the Meta Trader, these two Expert Advisors will recognize the open trades. They will not open another trade until these two are opened. So this is very, very useful because it happens that sometimes we disconnect from the Internet, or we disconnect from the server of the broker. All right?

    And the last thing I wanted to mention

    If I go one more time to the place where I have placed the Expert Advisors. This is in Open Data Folder, and I will go to MQL4, and I will go to Experts, and as you can see we have two types of files. One is the EX4 File, and the other one is the MQL4 Source File. This is what you will receive from me in the course – the source files:

    The path to the files
    The source files of the Expert Advisors.

    This is from where you can access the code of the Expert Advisor and the Magic number Forex. Now when we click Expert Advisors, right mouse, and we go to Refresh, we compile the Expert Advisors. And this is how we got to the EX4 File.

    So these are the compiled Expert Advisors. Most of the time, when you buy an Expert Advisor from the market, you will receive only these EX4 Files. So they don’t provide you the MQL4 Source File, but I prefer to offer it. If any of you, as the developer, wants to test something, wants to change something, want to learn from the code.

    You’re very welcome to do it as well.

    As I said, personally, I don’t touch anything in the code.

    These are the things about the Expert Advisors and Magic number Forex. And below you have this tab that says Experts, and from here you can see kind of information what we had with the trade when it opened. We have the number of the order. What it did, at what price, Stop Loss, if there is one and the Magic number Forex:

    Magic number Forex
    Experts tab

    So there is some information here about the actions with the Expert Advisors. Not a bad idea to have a look at those sometimes and as well in the journal. So you will see if there are any mistakes with the Expert Advisors. All right?

    As a conclusion we can say:

    Is it better to trade with Expert Advisors or manually?

    • trading with Expert Advisors removed the emotions which are part of manual trading
    • manual trading is suitable for experienced traders with massive capital in the account
    • with Expert Advisors, we can trade many strategies simultaneously in one trading account (up to 99EAs)
    • trading manually the trader can follow the market 8-10 hours, maximum 12 hours
    • the Expert Advisors follow the market 24 hours from Monday to Friday – more volume of trading
    • the Forex Magic number allows the trader to have a precise statistic for the trading

    When trading manually, it is hard for the trader to decide if a strategy is profitable or not for many reasons. First, he can not take all trades during the day. Second, the entries are not precise as with algorithmic trading, and third, the trader always modifies the system according to their feelings at the moment and their expectations.

    It is a personal choice if you want to trade manually or with Expert Advisors, but we have noticed that more traders lose when trading manually. Just because of the emotions. They cause the traders to lose money.

    So this is about the Forex Magic numbers with the Expert Advisors.

    Let me know if you have any questions, and write in OUR FORUM.

    For more trading courses, please visit our website.

    Thank you for reading.
    Cheers!

    [sc_fs_multi_faq headline-0=”h2″ question-0=”What is the magic number in Forex?” answer-0=”This is a number in every Expert Advisor which displays as Comment in MetaTrader 4. It helps the algo traders to follow the results of Expert Advisors, especially when trading with more than 1 EA. ” image-0=”” headline-1=”h2″ question-1=”How does Forex Expert Advisor work?” answer-1=”The Forex Expert Advisors are automated strategies that are coded normally in MQL and traded in MetaTrader 4 or MetaTrader 5. They open and close trades according to the trading rules inside the code.” image-1=”” headline-2=”h2″ question-2=”How to set the Magic Numer in EA?” answer-2=”When you drag any Expert Advisor over the trading chart, you will see a small menu. Click on Inputs and you will find the field to enter the Magic number at the end.” image-2=”” headline-3=”h2″ question-3=”Why Magic numbers are useful?” answer-3=”When trading many Forex Expert Advisors in one trading account it is hard to follow the trading results. There are many statistical websites that use magic numbers to identify orders and strategies.” image-3=”” count=”4″ html=”true” css_class=””]

  • Forex Expert Advisors – The Top 10 USDJPY strategies

    Forex Expert Advisors – The Top 10 USDJPY strategies

    Forex Expert Advisors – The Top 10 USDJPY strategies course

    Forex Expert Advisors recent course that we have launched is dedicated to USDJPY. My name is Petko Aleksandrov and I am the mentor in this course.

    What are the Forex Expert Advisors?

    • automated strategies that could trade alone
    • code that is attached to Meta Trader platform
    • algorithm to open trades on predefined rules
    • opportunity for portfolio trading with many strategies

    In this course, I will provide you with The 10 Expert Advisors for USDJPY currency pair.

    For the very newbie traders or the ones who didn’t use Forex Expert Advisors so far and didn’t watch any of my previous courses. I will show you how to place them properly on the Meta Trader platform. In this course, you will receive more information as well about the Meta Trader platform.

    Now for the people who already have some of my Forex Expert Advisors, you will see that there is a slight difference between these Expert Advisors and the others. For example, I have provided in the EURUSD course or the Top 10 GBPUSD course. Because with these Forex Expert Advisors you will have the possibility to add to the position on the next same entry signal.

    If there is a short entry and after that, there is another same direction signal. The Expert Advisor will add to the position and when there is an opposite signal it will reverse the position:

    Forex expert advisors picture
    Example trading set up

    Of course, I really don’t suggest you, in the beginning, to use this, because obviously you will be trading and you will be increasing the lot size, which brings higher risk. So just if you are planning, for example, to trade with 0.1 lot, you should trade with this lot size.

    Now the other difference and the main difference for me is that with these Forex Expert Advisors you will be able to follow the higher time frames or the longer time frames. Actually, the Expert Advisors will be following those.

    So 5 of the Forex Expert Advisors are trading on M5, the other 5 are trading on M15.

    But these Expert Advisors are following the M30 and H1 charts using the MACD indicator. And you don’t need to open M30 and H1 and to place the indicators.
    The Forex Expert Advisors are following them automatically and the best thing is actually this way we filter the entries by following higher time frames or longer time frames.

    All right?

    And in this course, I will show you the whole process that I have followed. I have used FSB Pro and with this Strategy Builder, I have the opportunity to put these options into the Forex Expert Advisors.

    If you look at my chart now, you will see that I have one Meta Trader platform opened here:

    Forex Algorithmic trading
    Meta Trader platform is most suitable for Forex Expert Advisors

    I have opened a virtual account, a practice account and I always suggest my students start always with a virtual or the so-called demo account.

    So now I will show you how to place The 10 Forex Expert Advisors, that you will receive in this course on your charts.

    I have opened 10 windows or 10 charts with USDJPY on M5 time frame and 5 charts on M15.

    If you don’t know how to open a new chart, you just need to find USDJPY on your market watch. What you can do is press the U button and it will go to the dollar currencies.

    And here is the USDJPY, so just right click and go to chart window and a new one will come.

    Normally they come with some indicators. You can easily remove them. Go to indicators list, click on the indicator and delete it.

    To use Forex Expert Advisors you don’t need to have any indicators over the chart.

    Even the indicators from the Expert Advisors, you don’t need to have it over the chart. They are inside the Expert Advisors so no need to place it over the chart.

    In this lecture, you will be able to download the Forex Expert Advisors for Meta Trader 4 or for Meta Trader 5. Depends on what platform you prefer to use.

    Personally, I prefer to use Meta Trader 4 and in the next lecture, I will give you some more idea about the Meta Trader platform. And I will show you the very basics of this platform.

    So once you download the Expert Advisors, what you will need to do is you will need to copy them and you will need to go to file, that you see on the left up corner, and you go to Open Data folder.  And then you go to MQL 4 and you go to Experts.

    So this is where you need to face the Expert Advisors, close this folder and right mouse over Expert Advisors and click on Refresh. This will force the Meta Trader to compile the Forex Expert Advisors. And keep in mind that it might take you just a little bit longer time as usual, because these Expert Advisors are much heavier with bigger code inside.

    I will show you later on in the course the codes in the Expert Advisors.

    So what you need to do?

    • You need to place these Expert Advisors over each chart window. (It is very important to have the right time frame.)

    So you see that 5 are on M5 and the other 5 are on M15. So what you see here are the names of the Expert Advisors. But I use those as magic numbers as well.

    • In each Expert Advisor, we place a magic number, which allows us to follow the performance after that of this strategy.

    So how I have named them?

    It is a very easy system. It’s my own system.

    So the first digits 3 0 stands for USDJPY. Simple this is how I recognize the Expert Advisors because I’m testing so many Forex Expert Advisors daily for different currency pairs with different systems. So I need to have my system to recognize which Expert Advisor is for USDJPY, for EURUSD, especially in the accounts where I’m placing many Forex Expert Advisors for different currency pairs:

    Forex Expert Advisors arranged
    Expert Advisors’ magic numbers

    So this is my own system of naming the Expert Advisors. OK?

    • EURUSD is 1 0
    • GBPUSD is 2 0
    • USDJPY is 3 0

    And then, for example, if I have EURJPY, I would name it 1 3 for the first two digits. OK?

    So simply the three stands for the yen and especially 3 0.

    I named the USDJPY Expert Advisors. Ok?

    Then I have the time frame.

    This Expert Advisor is for M5. I name it 0 5 and as you see below it is 1 5. So this is on M15.

    And then with the last 4, it really depends on what I have been doing.

    But in this case, I have named it 10, because this is the first version of these Expert Advisors. And later when I update the course, when I optimize these Expert Advisors, you will receive these updates and here for the next update, I will place, for example, 1 1 0 6.

    So you will know that this is a new version of this Expert Adviser and, for example, if the second one doesn’t need an update, it is doing fine.

    I will keep it 10.

    So you will know that this is still the first version of this Expert Advisor. OK?

    And then in this case particularly for this course 0 6, 0 7, 0 8, 0 9, 1 0 and then 1, 2, 3, 4, 5. This is just to recognize the different Forex Expert Advisors, so the last digit is kind of their unique number and the previous ones showed the version, the time frame, and the currency pair. All right? But this is my own system.

    If you have better, more simple, that would be even better.

    So what you need to do is you need to first enable the Auto Trading.

    Make sure it is green.

    This is very important! Anyway, your Forex Expert Advisors won’t work and then it is very easy I just double click on the Expert Advisor and here comes the small menu of the Expert Advisor, where you can see that you can change the lot size, how much you want to trade. What is the maximum position amount if you want to add to the position.

    For example, if I place it here 1 lot, it means that every time on a new same entry signal it will add 0.1. Because this is how much is here until it comes to 1 lot and it will not add any more to the position or you can decide to add more to the position.

    But one more time I don’t suggest you do that.

    Start with 0.1 or 0.0 1 it really depends what you are trading with, your capital:

    Forex Expers
    Forex Expert Advisors set up

    If you are on the demo doesn’t matter so much. It’s just fine to go with 0.1 and I suggest you not to hurry with adding to the positions just understand how these Experts are working. If you like their performance, you can increase the lots by adding to the position.

    And below you can see the Stop Loss, the Take Profit Break Even. The other parameters that we have for the strategy and below.

    Here is what we call the magic number.

    And here you will see some random number. But what I prefer to do is to place exactly the same number, the same name of the Expert Advisor. So this way I will know which Expert Advisor after that performs the best. OK? I will click on OK.

    And on the right up corner, I will see the smiley face. This means that already this Expert Advisor is working. OK?

    And you can see that here I have the values of all indicators used in this Expert Advisor.

    And this is because I used FSB Pro and it is not EA Studio. With EA Studio I don’t see anything on the chart. I have just playing chart with the graphic:

    Forex Expert Advisors enabled
    Indicators values are visible over the trading chart

    Now I have to do the very same thing. I will do it just on one more chart and I will put the magic number. So here will be 3 0 0 5 1 0 0 7 and I will click on OK and I will have again the smiley face. So it’s the very same thing. I need to do on M15 starting with the first Expert Advisor, double click on it and I will enter here 3 0 15 1 0 0 1. All right?

    I click on OK and you see I have the smiley face. So I will do that now for all charts. And in the next lecture, I will continue with some more basic information about the Meta Trader, for the people who see the platform for the first time.

    That is the most common platform for algorithmic trading. It gives us the opportunity to trade with Forex Expert Advisors. It is a free platform and that’s why I have selected it to use it in most of my courses.

    How is Meta Trader working?

    The company that has developed Meta Trader is called Meta Quote. They provide the platform to the broker. The brokers pay yearly to the Meta Quote to use the platform, so they can provide it for free to us, the traders. That is why it is one of the most common platforms – it is free for the traders, and it is suitable for algorithmic trading.

    From where the brokers benefit?

    They benefit the spread from our trading. When we buy, we buy on the Ask price, and when we sell, we sell on the Bid price. So this difference of the 2 prices is called spread. This is what the broker benefits. Of course, most of the brokers and market makers, which means that if we lose money from our account they will benefit these too. Yes, there are the ECN brokers, but they always find a way to keep this money for themselves. They need to pay to the Meta Quote, to their employees, the offices, the regulators, so yes, they keep it all for them.

    Keep in mind that when we do Forex Algorithmic trading we execute many transactions and we “pay” a lot of spread. That’s why the choice of a good broker is very important.

    All right, guys? This is how we play the Expert Advisors on the Meta Trader. So just place them on a demo account and practice trading with these Forex Expert Advisors.

    All right, thank you for reading. If you have any questions don’t hesitate to ask me on our forum.

    For more Forex trading courses with Forex Expert Advisors please visit our website.

    Cheers!

  • Forex Algorithmic trading – What’s new?

    Forex Algorithmic trading – What’s new?

    Forex Algorithmic trading – the newest Expert Advisors from EA Forex Academy.

    Forex Algorithmic trading is the thing, I will be talking about in this article. Hello, dear traders, it’s Petko Aleksandrov from EA Forex Academy. Today I will talk about the recent course that I have launched about Forex Algorithmic trading. It is in our algorithmic trading section.

    If you click on “Courses” you will find it just right down. This is the ninth course that I have launched for algorithmic trading and included again 10 Expert Advisors. This time this is for USDJPY. If I click on the course you will see the description. You will see the landing video, where we can learn much more about the course.

    And as you can see already 356 students joined the course for less than one month.

    This makes me very happy. There is a huge interest in this course and it’s another Forex Algorithmic trading course where I am showing new methods on how to build Expert Advisors.

    So what you will see is that this time I have used the Forex Strategy Builder Professional and this strategy builder gives us some more possibilities that we are missing in EA Studio.

    What we have here is we have the possibility to add to the position.

    Inside the Expert Advisor’s inputs, you will have the stop where you can select how much to add to the position, and how much to be the maximum trade. Of course, as a beginning, I would not suggest you add many times on a trade. You will need to be careful about increasing the position. Also, keep in mind that when we add to the positions, the backtest results would be different.

    forex algorithmic trading representation
    Indicator chart on FSB Pro

    Once you have, for example, a buy signal and then you have the next same directional signal you can add to the position and when there is an opposite signal you can actually reverse the position.

    And then again, if we have another sell signal we can add to the position. Then another one we can add and same on the other side. If we have a buy we reverse this whole sell position. All of the trades from the sell position and then we buy and then on the next same directional signal we add another buy. This is the most logical method in Forex algorithmic trading.

    I have made the Expert Advisors in such a way that you will be able to choose how many times you want to add to the position. For example, if you choose three this means that you will add three times maximum. On the fourth one (if there is a fourth same directional signal) it will not add the position. Basically, this way you describe how much you want your maximum lot to be.

    Forex Strategy Builder Professional gives us some more possibilities.

    As we see great indicator chart and we are using the longer the time frames. What you see below is that I am using M15 for this strategy as a major time frame to trade on, but what I have below is two different time frames. So I have MACD on M30 chart and I have MACD on H1 chart.

    This MACD indicator filters the entries.

    In Forex Algorithmic trading it is easy to create Expert Advisors that are very active, scalping and open many trades daily. The good trader looks for the better entries and makes his best to eliminate the losing ones.

    Forex algorithmic trading strategy outlook at FSB Pro

    The idea here is to have stronger entries at the right moment and with the indicator chart, you can see exactly where were the entries and where is the next one.

    This is how Forex Strategy Builder Professional looks like.

    If you want to use it, there’s 15 days free trial that you can take advantage of. You need to install it on your computer and you will be able to use it. So basically here in the middle we have the entry rules and we have the exit rules, the logic conditions, this is again the indicator chart, that I am showing over here.

    In this case, talking a little bit more about the MACD

    I am using the MACD in a way that I want M30 and H1 to match and this is the moment when I am entering. You can see here is the sell signal because both MACD confirm that it is alright to go short, right?

    And if I just go back a little bit earlier to the video from the lecture and I pause it you will see the ad three conditions:

    • MACD line rises
    • MACD line is higher than the Signal line

    Okay so, I have one and the same indicator but with different entry conditions:

    • MACD rises
    • MACD line is higher than the Signal line

    I have confirmation on M30 to go in the same direction.

    And this way the Expert Advisor has the confirmation to execute the trade on M15, of course, if the other rules are there. Now I will just go a little bit more over the video and I will show you the other strategies.

    Here the first five that I have created are trading on M15 and then the next five are on M5. Now on M5 I am using the MACD indicators but with different conditions:

    • MACD line is lower than the Signal line
    • MACD line is lower than the zero line
    Forex Algorithmic trading set up
    MACD as indicators to filter the entries

    On M5, what I have aimed, is to create Expert Advisors that are actually trading on the sideways market. I want to buy when the price is cheap and I want to sell when the price is expensive. Now  I have the indicator chart, I have the MACD lines, I have the other indicators so the other indicators are still on M5 but the MACD is on H1 and M30.

    Alright, here I want to go long when the price is cheap. You see here I have this move down and here is the long entry. When I have the confirmation from the MACD and I am buying basically after the move down

    The Expert Advisor aims to take the trade on the long side when we are having a cheap price. This is typical for Forex Algorithmic trading.

    Now obviously here this didn’t happen. You can see the price just went sideways. But not so much sideways. You can see it goes a little bit higher up to here and then I have a sell signal.

    See this red line below, the price over here, this shows that we are having short trade. Then when we have green one this means we are having the long trade:

    Forex trading via strategy builder
    True indicator chart will show you where are the entries and exits

    Now one more time here the idea is that we want the MACD to be down. This will confirm that the price is down and we want to buy it. Same thing on the other side we are looking to sell it when the price is expensive.

    This way I create Expert Advisors that are trading exactly over the sideways market.

    While those on M15 are catching the move. As the old saying in Forex Algorithmic trading says:  “We want to jump into the train, we want to go with the direction of the major price”

    These are the two different market conditions in the trending market:

    • buy when the price is going up
    • sell when the price is going down

    The sideways market:

    • buy when the price is cheap
    • sell when the price is expensive

    Five of the Expert Advisors are on M15 and five are on M5. Аll of them are being filtered with the MACD indicator on H1 and M30.

    I will talk a little bit more about the FSB Pro as a strategy builder.

    Of course, again I have created hundreds of strategies, I have filtered those and I’ll show how I’m doing it during the course but it’s great if you want to practice just what you can do is to download it from right over here on our website.:

    Forex Algorithmic trading on the computer
    Download link for FSB Pro.

    Here you will see the download trial button and there are 15 free videos over here from the developer Mr. Popov, who has developed this software for many many years.

    And now I can say it’s a top product in Forex Algorithmic trading. Personally, I wouldn’t imagine trading without it. It makes it so much easier.

    Now I will focus a little bit more on a Forex Strategy Builder Professional in my next courses because if I go one more time to our Forex Algorithmic trading section in the courses you will see that in most of my courses I have used EA Studio. The web-based strategy builder. This is for a reason actually, because it’s a much easier strategy builder. It’s much more convenient for the beginner traders and everyone can get used with it pretty quickly.

    While FSB Pro is a bit more advanced. It takes a little bit more time to set it up. But those videos, from the developer, will guide you through each step. It will be very easy for you to set up the strategy builder. Of course, in this course that I have been talking about in this video: “The top 10 USDJPY Expert Advisors Forex Algorithmic Day trading”.

    I have shown briefly how to set it up and you will be able to do it. What I wanted to say is that from the nine Forex Algorithmic trading courses what I have been doing with the top five – I use FSB Pro. Then with one of the strategies I used EA Studio. Then with the Forex strategy course, I have used both again.

    With  Тop 10 EURUSD strategies, the Top 10 GBPUSD strategies, the Forex Expert Advisors course, London, New York, and Tokyo Algorithmic Trading. With the Automated Forex trading, the Algo trading course, which is the basic course, and with the Trading Portfolio Expert Advisors.

    In all of these six courses, I have used EA Studio and not Forex Strategy Builder. I want to balance it a little bit and I’m planning to make a few more courses on FSB Pro.

    I wanted to create more courses in EA Studio because most of our students are beginners. EA Studio is much more appropriate for beginner traders. If you have watched some of these courses you will have an idea about Forex Algorithmic trading. It will be much easier for you to give it a try with FSB Pro.

    Many ask me what is the difference between EA Studio and FSB Pro?

    First of all, there are many differences because these are two different strategy builders, but here I will point out some of the main.

    What is the main difference between EA Studio and FSB Pro?

    • the EA Studio is web-based and you can use it from any device with an internet connection
    • while FSB Pro needs to be installed on the computer
    • with EA Studio we have the default indicators from Meta Trader
    • with FBS Pro we have custom indicators and if any are with C# can be imported
    • EA Studio has the reactor tool which automatically generates and performs robustness tests
    • FSB Pro gives the opportunity to the trader to use it the software as a trading terminal
    • EA Studio works much faster as it is web-based and you can use it on different browsers simultaneously

    So these two are just different software for algorithmic trading. It depends a lot on your trading style and what type of strategies you want to build. I always say that the best results are coming when both are used together. This way the trader is capable of creating different strategies which bring better diversification of the risk.

    The strategy builders improve the Forex Algorithmic trading to anyone who wants to trade automatically. Most of all, they help the trader to avoid the emotions which is the main reason why manual traders lose money.

    Alright guys, thank you for reading! This was the recent course that I have launched about Forex Algorithmic trading. I wish you always to enjoy trading.

    If you have any questions don’t hesitate to ask me.

    Recently OUR FORUM is getting pretty interesting. Many traders are joining.

    I have opened one topic which is – “Forex Strategy for EA cryptocurrency EA – share with everyone”. So there you will find some free Expert Advisors.

    For more cryptocurrency trading courses please visit our website.

    Cheers!

  • Portfolio Expert Advisors: The Best Method in Robot Trading

    Portfolio Expert Advisors: The Best Method in Robot Trading

    Robot trading is so much different nowadays than it was before! The portfolio of Expert Advisors changed the game!

    The robot trading in this article is presented as Trading Portfolio Expert Advisors. This is the most innovative method in algorithmic trading. This system of trading is possible due to the great work of the developers’ team at Forex Software LTD, the creators of EA Studio and Forex Strategy Builder professional.

    Our mission at EA Forex Academy is to follow what is new on the market, to test it, and implement it into an online course. This way, it can reach more people who are interested in trading, and especially Robot trading.

    Below you will find a free lecture from the newest course from Petko Aleksandrov, the Head mentor at EA Forex Academy. In this lecture, he will describe his fastest method for filtering strategies into Portfolio Expert Advisors.

    What is Robot trading?

    Robot trading is the slang name of an Expert Advisor. This could be one or many Robots into one Expert Advisor. In simple words, this is the automated version of the trading strategy. Every strategy has its entry and exit conditions, Stop Loss, Take Profit, longer time frames filters, etc. All of these rules could be coded. And this is precisely what the Robot trading is, the code of Forex strategy.

    Typically each Expert Advisor is coded on MQL4. This is possible in the Meta Editor of Meta Trader platform – the most common platform for algorithmic trading. This is where the trader can use Robot trading.

    In this Trading Portfolio Expert Advisors + 100 Forex strategy course, Petko Aleksandrov will demonstrate the easiest way for a trader to use Robot trading. And not only one, but a whole portfolio of trading Robots.

    The strategy builder EA Studio allows the traders to generate an unlimited number of trading strategies over the Historical data of the broker. After that, it performs a robustness test to see if the Robot trading will be stable on different market conditions.

    What is new with Robot trading from 2018?

    It is possible now to export whole Portfolio Robot trading Expert Advisors. This means that in one Robot, there are many different Forex strategies. This saves so much time and resources for the trader. Also, it goes behind the rule of maximum 99 Expert Advisors on Meta Trader for one account. , you can place many strategies on one chart using the Trading Portfolio Robot trading.

    Why trading with Portfolio Expert?

    • better risk-diversification
    • trading, not one but many strategies algorithmically
    • less work to place each EA on a separate chart
    • easy to remove the losing strategies from the code
    • more stable profits are achievable with the Portfolio Expert

    Trading with Portfolio EAs has changed the algorithmic trading, and still few people know about it. The first videos about it are recorded exactly from our trade Petko Aleksandrov:

    Enjoy the lecture from the Trading Portfolio Experts course:

    Dear students, I have decided to update the course just a few days after I have completed it. Because I have found one exciting solution

    How to manage the Portfolio Expert Advisors after you follow their performance.

    I continue now from the account where I have left the ten Portfolio Expert Advisors:

    Robot trading results
    100 Robot trading strategies in one account

    The portfolio of Expert Advisors has been trading over here for nearly ten days. And, you can see my profit is just that 61 dollars a little bit more of a profit. But the important thing is that if you look at my statistics, I have something unique taken here and something that makes me very happy when I am using Robot trading.

    If I click on net profit, I will arrange the strategies according to the net profit. So, let me click it one more time, and the profitable ones will go on the top:

    statistics in fx blue
    Statistics for each strategy trading on the account

    Then you see here, I have the profitable strategies that made a total net profit. And, if I go down, this will be showing the strategies that made losses.

    That is not a bad profit trading with Portfolio of Expert Advisors having in mind that I did not do anything manually.

    Keep in mind that we’ve been Robot trading with 0.01 lot size.

    And I have 26, 25, 24, 21, and if I scroll down, you will see I have negative of 19, 18, 16 15, 14. So, more positive trading here you can see as a result, but with 0.01 guys, this is 26, 25, 24 dollars. And if I were trading with 0.1 lot size, this would be 260, 250, 240 dollars.

    And if I were trading with a complete lot, obviously this would be 2600, 2500, and so on.

    The total net profit I’m having is $63, but this is one more time I repeat with 0.01. And if I scroll to the right, you will see so many statistics that you can have a look at. But, if you look at the pips that were made, this is total net pips of 1124.9 net pips, which for me, is a fantastic result for this short period of trading.

    The thing that makes me happy with this Robot trading Portfolio Expert Advisors that I have created is this profit factor. And, you can see there is no profit factor. Simply because with these strategies, how many are day 1, 2, 3, 4, 5, 6, 7, 8, 9, 10, 11. I can see one below 12, 13, and I have 14.

    14 profitable strategies that had only winners trades and no losers

    This means that all trades opened and closed on profit. Not even one single trade on a loss. And I can bet you that this is something very rare, that you will see something that you cannot find with other Expert Advisors or any Robot trading.

    Such a Portfolio of Expert Advisors is unique.

    And I feel even surprised when I looked at the statistics this morning. So, what is the crucial thing here also I have this net profit of a total of 63 dollars, which we said is just because we are trading with 0.01. If we were trading with more for each strategy, it would be much more. And more it is, above 1,000 pips.

    There is something more important here. I see very clearly which strategies are making such a profit by their magic numbers.

    What is the solution that I have found the recent days as I told you to manage your robot trading Portfolio Expert Advisors?

    So, when you have already sustainable statistics, you want to trade the ones that are currently profiting. And, we want to eliminate the ones that are losing, right?

    What is the thing that I have found? If I arrange the strategies according to magic numbers, what you see is that with the first robot trading Portfolio Expert Advisor trading on M1, all of the strategies open trades. From 000, 001, 002, these are all strategies, they all open trades, and you can see how many trades they opened:

    Robot trading in order aranged
    Arrange by Magic Number to see the performance of each Portfolio Expert?

    What I see is that these two Robot trading Experts are negative at the moment, and I want to remove them.  Let’s have a look at the second one. This is the second one for the M1 chart, and you can see I have a negative, a positive one. This is one of the best ones. You can see profit factor zero.

    It made 12 consecutive trades with no one loss

    And, then I have a negative of 16, positive 4, negative of 19, positive, small negative, small negative, slight negative, positive, negative. This is actually from the next Portfolio Expert Advisors.

    When you see the results from one Portfolio Expert Advisor in your statistic, you need to remove the ones that are making huge losses. This way you can increase your total profits. So, how can I remove these two strategies? This is the thing I will show you right now.

    These are the strategies with number 2 and 4, but keep in mind this is the third and the fifth strategy from this Portfolio Expert Advisor because we said the first one is with a number ending on 0 0 0. This is the first strategy from this Robot trading Portfolio Expert Advisor, this is the second, and third, and the fourth. But anyway, to remember it, this is the ones ending on two and 4.

    You can see they made the most significant loss on this Portfolio Expert Advisor, and I want to remove that.

    How can I remove the losing strategy from the Portfolio of Expert Advisors?

    I will go to the Expert Advisors, and this is the second Robot trading Expert Advisor from the M1 chart. I right-click, and I go to modify:

    easy way to modify the robot
    Path to modify the code of the Expert Advisors.

    Here is the code for the strategy. You don’t need to be a vast developer to do that. I’m not a developer at all, I don’t know all of these things, but I have learned something exciting here.

    If I scroll down, you will see where are the strategies. Here are they; you will recognize them easily. It says on the top – set signals, okay? And below, you will see all the strategies and their parameters. So, this is the second Expert Advisor from the M1 chart.

    And what we said – let’s have a look at the statistics – we said we want to remove this one negative of 16, negative of 18. So, they are with numbers ending on 2 and 4. The same numbers you will see over here 2 and 4, okay?

    These are the two strategies inside the Robot trading Portfolio Expert Advisor that are making losses at the current moment.

    So how can I remove them very quickly? I type 2 times slash in front of the both of them, and they become as a comment:

    Robot trading code
    Two slashes stand for comment.

    You see, it changed color. So, this means that the strategy is not active anymore. It’s still inside this Portfolio Expert Advisor, but it’s not active anymore. If I delete those, it will be active again.

    So, the first you can see is get exit signals, alright? And the second one gets entry signals. If you want your strategy to stop entering the market, you can put the two slashes in front of this line only. I will stop opening positions. And if I leave it this way, it means that if I have open trades at the moment.

    This strategy will still manage them, and it will close them. If I put two slashes here, it means that the strategy will not close the trades. Anyway, they are with Stop Loss and Take Profit one of the two levels is hit. The trade will close.

    The first is to exit the signal, and the second one is to give you the new entry, all right?

    So, if I put two times slash and then for the fourth strategy, I do the very same thing. And, if I move it down. If I compile now the strategy, it will save the changes, and basically, these two strategies will not take any action anymore. And I will continue trading with the rest of the strategy for this Robot trading Portfolio Expert Advisor.

    So, you don’t need to drag the Portfolio Expert Advisor over the chart one more time. In your Expert stop on the Meta Trader, the Portfolio Expert Advisor will be loaded again, and it will continue the work without these two strategies.

    This is an excellent solution on how to manage your trading after that with the Robot trading Portfolio Expert Advisors

    How to trade with Portfolio Expert Advisors?

    • follow the statistics from the account
    • arrange them by the magic numbers
    • remove the strategies that are losing

    You can see here most of them are with good profits:

    Robot trading results
    Net profit is the most crucial statistic at the end of the day.

    This one, for example, more losses negative of 16, I can remove it from the second Portfolio Expert Advisor that is trading on M5. And this is the strategy ending on 008, okay? This is the one great method that I found recently, to remove it from the code this way.

    One more thing here – I will make it as a comment. When I drag this Robot trading Expert Advisor later on back into EA Studio to recalculate it, it will be still inside. If you see that the strategy is losing what you can do is you can delete it, okay? If I delete these rows and this strategy, these strategies will be removed totally from the Portfolio Expert Advisor.

    So, this is a easy method to eliminate the losing strategies from your Portfolio

    And, you don’t need to have any programming skills, as I told you. I don’t have any programming skills, but it’s easy to do it. Just two slashes in front of the strategy, it’s not going to open any trades. This way, you can filter your Portfolio Expert Advisors and you will leave at the end always the ones that are profiting the most. These that are profiting currently, on the current market conditions.

    Also, as you know, every month, I will provide you with new Robot trading Portfolio Expert Advisors. So you can do the same with them. It’s up to you how you will manage it. I want to give you different possibilities, different options, and methods. And you can find which one works best for you.

    Thank you very much for watching, and I will see you in the next lecture.

    Cheers.

    If you have any question you can always write in our support forum

    If you are interested in the complete course, you can click on the discounted link below:

    Trading Portfolio Expert Advisors + 100 Strategies included

    The Portfolio Expert is a combination of many trading strategies grouped into one single Expert Advisor. This allows the traders to diversify their risk by trading many strategies simultaneously using just one Expert Advisor

    The Portfolio Expert works just the same as a regular Expert Advisor. It is an MQL code that should be compiled in the Meta Trader platform. After that, the Portfolio Expert Advisor must be attached to the trading chart for the desired asset.

    Trading with portfolio Experts is similar to the trading with single Expert Advisors. The only difference is that you will open many trades at the same time which is considered as hading. It is recommendable to test it on a virtual account.

    This is possible from the source code of the Experts. The usage of // sets the strategy as a comment and it is being disabled from the Portfolio Expert Advisor.

  • Bitcoin Expert Advisor – How to Trade With BTC EA

    Bitcoin Expert Advisor – How to Trade With BTC EA

    In this lecture, I will show you how to place Bitcoin Expert Advisor on the MetaTrader platform. And I will show you the whole process step by step. So no worries if you haven’t done it so far. It’s nothing really hard. It will take you, I guess, 10-15 minutes to place the BTC Expert Advisor and start auto trading.

    Bitcoin Expert Advisors – the easiest way to trade like a professional trader

    Bitcoin Expert Advisors are what we are focusing on in the Bitcoin Algorithmic Trading course + 99 Bitcoin Expert Advisors. In the course, we provide 99 Bitcoin Expert Advisors we update the course every month with 99 new BTC EAs.

    This method of trading is created and tested by Trading Academy for a long time. The idea came as a solution to one of the most significant issues in algorithmic trading – the Bitcoin trading Experts fail after a certain time.

    Looking for a free Bitcoin trading Expert to download with no strings attached? You’re at the right place! Scroll down to the bottom of this article to receive a free Bitcoin EA for MT4 or MT5.

    Or you can read this article and understand what are Bitcoin Expert Advisors and how to use them to automate your trading.

    Why do Bitcoin Expert Advisors fail after time?

    The answer is simple – the Bitcoin market changes, like any other market. A trader can not expect that one Expert Advisor will remain profitable for a long time. Why? Because of the market changes.

    We can not expect that a single Bitcoin EA will stand in time when the price is going up, and the same EA will still make a profit when the price goes down.

    But when we trade with many Expert Advisors, we can diversify the risk. And this rule is not just for Bitcoin EA, but for any other trading asset.

    That is the reason why we provide 99 Bitcoin Expert Advisors in the Bitcoin Algorithmic Trading course. This way, we test many strategies simultaneously in a single trading account. Then we place the best performing Bitcoin Experts on another trading account. These could be the top 3, the top 5, or top 10 Bitcoin Expert Advisors.

    If any of those selected strategies start to fail, another one is being placed. This is precisely what you will learn in this article.

    Keep the Bitcoin Expert Advisors up to date

    The Bitcoin Expert Advisors are always created over certain Historical Data. This means that the parameters of each strategy are fit to the trading period before each release of the EAs. The trading mentor generates every month new 99 Bitcoin Expert Advisors, always including data from the recent month.

    This way, the traders have every month new 99 Bitcoin Expert Advisors that were created according to the most recent market conditions.

    And this way they have massive diversification of the risk, and a tremendous amount of Bitcoin Expert Advisors to choose from. This way, the traders do not rely on a single BTC strategy or Expert Advisor.

    No, trading or programming experience is needed to apply this system.

    Usually, if you use the MetaEditor of MetaTrader, you would need two things to create Bitcoin Expert Advisor:

    • profitable strategy to rely on and code
    • programming skills or hire a developer

    The problem is that you can not understand if a trading strategy is useful if you do not have the Bitcoin Expert Advisor. It’s like a dead-end street. You need a profitable strategy to build the Bitcoin trading advisor, but you do not know if that strategy is profitable if you don’t backtest the robot.

    That is why, with this course, you will receive 99 EAs, and you will be able to test them and see which are the profitable EAs for your broker. The problem is solved.

    The Bitcoin Expert Advisors are ready to use, and any beginner trader can easily apply them. The only work is to follow the performance of the strategies, and this process is described in the article.

    Hello, everyone, I continue with the next video where I’ll show you how to place the 99 Expert Advisors on the MetaTrader platform. And I will show you the whole process step by step. So no worries if you haven’t done it so far. It’s nothing really hard. It will take you, I guess, 10-15 minutes to do it.

    How to trade Bitcoin with Expert Advisors

    Now, in my downloads folder, I see all the BTC Expert Advisors that I have exported from EA Studio and I will just arrange them according to the type. On the top, I see the collections that I will grab all of the MQ4 files since I use MetaTrader 4 with the HotForex broker.

    So if you are using MetaTrader 5, make sure to select and use the MQL5 source files. Sample Bitcoin Expert Advisors will be attached at the end of this lecture.

    So how you can do that, you need to select the files.

    Click on Copy.

    I click on Copy

    And then all you need to do is go to File, Open Data Folder,

    I click on Open Data Folder

    and you click on MQL4,

    Select MQL4

    then Experts.

    Then select Experts

    And this is where I will paste the Bitcoin trading EAs. I will remove one that I have used before.

    I paste them here

    And after that, I will close the folder and I will go in the Navigator, Expert Advisors, right-click, and hit on refresh.

    I click on Refresh

    This will compile the Bitcoin Expert Advisors. It might take a little bit of time because these are 99 BTC Expert Advisors and once it is ready you will see all the Expert Advisors listed in your Navigator tab. You can increase it, decrease it. Doesn’t really matter.

    I usually keep it a little bit bigger window when I have many Experts and I make smaller the Market Watch. So I will be just seeing cryptos in this case. And actually, I will just need Bitcoin for the purpose of this lecture.

    With the EA Studio you don’t need the MetaEditor

    So we have all of the BTC Expert Advisors and you saw that is very easy with 1 click to compile them. Now, if you use MetaTrader 5, it takes a little bit longer time because what you will need to do is you will need to open each Bitcoin Expert Advisor from the Experts folder, and you will need to double-click on it.

    And this will open the MetaEditor. The MetaEditor is where the developers are programming Expert Advisors. But we don’t need to do that when we have EA Studio. I don’t do it by hand.

    So this is the code of the Bitcoin Expert Advisor and on the top, you can see there is Compile button.

    code of the Bitcoin Expert Advisor
    The MetaEditor

    I can compile the Expert from here, and for MetaTrader 5, you need to do it one by one.

    So this is 1 of the reasons I use MetaTrader 4 because when we trade with many Expert Advisors, right-click refresh works really fast and easily. After compiling the Bitcoin Expert Advisors I have for each one the EX4 file, which is compiled and a ready-to-use Expert Advisor.

    Enabling AutoTrading

    So I’ll close the folder and what I will do now? I will start with the 1st Expert Advisor for Bitcoin. I will just double-click on it, a small menu comes up. What I will need to do, is just click on OK. But in Inputs, we have the parameters of the strategy and on the bottom, we have the Magic Number, which is very useful when we trade with many BTC Expert Advisors.

    The Magic number

    You can see it as well with the name of the Bitcoin EA.

    This is how we follow the results. And later you will see that using the Magic Number, I will know which of these Expert Advisors profit the most at the current market, and this way I will be able to put the best Bitcoin EAs on my Live Account.

    So I click on OK. And actually before doing that, something very important. We need to enable the AutoTrading.

    autotrading with Bitcoin Expert Advisor
    I enable AutoTrading

    Click on it and it becomes green. It is very important to enable it before I put the Expert Advisors on the chart because if you put the Expert Advisor on the chart, and then you enable the AutoTrading, it might not work.

    The Bitcoin doesn’t trade on weekends

    OK, so 1st enable the AutoTrading, then double click on the Bitcoin Expert Advisor. Click on OK and you will see the smiley face in the upper right-hand corner, which means that Expert Advisor is attached, and it is ready to trade.

    You should see the smiley face

    However, today is Saturday.

    We don’t have quotes for the Bitcoin on Hot Forex and with most of the brokers, there is no trading with the Bitcoin during the weekend, as I’ve said. On Monday, the BTC Expert Advisor will start trading and now I will do the very same thing for the rest. So we have all the 99 Expert Advisors and I will need to open 99 charts for Bitcoin.

    So I have 1, I will open the 2nd one and I will just double click on the 2nd Bitcoin Expert Advisor. Click on OK. The 3rd chart. I will double-click and click on OK. 4th, click on the Market Watch over the Bitcoin chart window and I double-click and click on OK. It’s very fast to do it. Some people complain that it takes a lot of time but I don’t think it is.

    Many Bitcoin Expert Advisors in 1 account

    It will not take you more than, as I said, 15 minutes. If you are doing it for a 1st time, and when you do it a few times, you will see that it works really fast.

    And I am just on the last Expert Advisor for M30, I will double-click on it. So I have attached now 99 Expert Advisors. 33 for M30, 33 for M15, and 33 for H1. I will just scroll left a little bit to show you that it is very important, as I already said, to put the M30 Expert Advisors on M30 charts. This is the 1st chart that I have for M30 and it is the Expert Advisor ending on 016. Here it is.

    The 1st M30 chart

    And before that, I have all the Bitcoin Expert Advisors on M15, the one ending on 174. We have all the M15 Expert Advisors and at the beginning, I have all H1 Expert Advisors. So now I will leave the Expert Advisors on the MetaTrader.

    My AutoTrading is enabled and I have the smiley face on all of the charts, which means that I have attached all of these Expert Advisors on a Demo Account and I am ready to test them. So on Monday they will start trading.

    How to track the performance of the BTC Expert Advisors?

    I will log in to my demo account, where I have placed the top 3 Bitcoin Expert Advisors that were performing best among the 99 Bitcoin Expert Advisors. Currently, I have a balance of 1101. This means that I have succeeded in making $100, and this is around 10% of my initial capital.

    I will show you some results and as well, I will show you how to follow the results using the Magic Numbers. And after that, I will show you how I select which of these Bitcoin Expert Advisors to put on my Live Account.

    So, let’s see in detail what are the results of each Bitcoin trading strategy. I will use FX Blue which is an online app for analyzing the results of trading strategies.

    If you don’t have an FX Blue account, just visit the FX Blue website and click on FX Blue Live to create a new account. Then you need to select your broker’s server, enter your MetaTrader account details and the FX Blue account will be registered.

    I’m using Peppersone Demo 01 server for the purposes of this article and my account number is 875720.

    Let’s see the statistics

    Initially, the account doesn’t have a published trading statement. I need to click on account sync, and then Save changes without changing anything. Now I will go back to the Stats. And here you see that actually, I have a History only for 2 days. I have a Floating Profit/Loss of $8, a Balance of 1100. The Equity is 1092.

    The Weekly return and Monthly return are like the expected returns. We have only two days of historical data. So, based on these results, FX Blue is calculating how much would be your weekly return or monthly return. But there is no guarantee actually that it will continue the very same way. Because for two days to make 10% it’s a very, very good result.

    trading results
    Expected results dues to current performance

    Let’s go to the Strategy tab and see what I have here.

    You can see I have just a couple of trades opened, 7 trades actually. And my best profit was made by a strategy with number 57144865. It had $134 of profit and $0 loss. The second strategy made a profit as well with one profitable and one losing trade. And the third one had one profitable and one losing trade and it has a negative result.

    Bitcoin Expert Advisors performance
    Statistics from the separate account

    Here you see an excellent example of risk diversification with Bitcoin Expert Advisors.

    You see now that if I have placed only the top Expert Advisor to trade, I would have only profit. But you never know this for sure, and I didn’t know which BTC Expert Advisor will have the best profit in the next days when I was setting the 3 Bitcoin EAs. That’s why I prefer to put 3, 5, 10 Bitcoin Expert Advisors in a separate account. This way I’m sure that if one of those Bitcoin trading Experts starts to lose, the other two will profit. And at the end of the day, I will have a positive balance.

    Why is it better to trade with Bitcoin Expert Advisors?

    There are many benefits in using Bitcoin trading Experts, but some of the key are:

    • risk-diversification is achieved
    • more stable results compared to trading a single Bitcoin EA
    • easier to follow the results with websites like FX Blue
    • emotions are removed from trading (emotions are the main reason why 99% of the Bitcoin traders lose their money)

    Every Bitcoin EA has losing moments. That is quite normal because every strategy has profitable periods and losing phases. Many people are looking for this perfect strategy that makes profits all the time, but that is not the reality. Every single strategy has losses.

    The point is to select the strategies that are profitable at the current moment, for the current market conditions.

    And if we have many strategies and we test them on a Demo account, we can choose which Bitcoin EA to trade on the live account. Because we will see which one makes a profit for the current market conditions. This is very, very important.

    How to compare every BTC Expert Advisor performance in multiple trading accounts?

    I will exit from this demo account and I will log in to another demo trading account where I have placed the 99 Bitcoin Expert Advisors and I will check if these three BTC EAs are still on the top or I need to change some of them. I go to Stats again, and I click on Strategy, and I see here that the magic number of 57144865 is on the top here. And it’s on the top of my top 3 Bitcoin trading Experts account. So I will not move this trading EA.

    Bitcoin Expert Advisors MT4 trading account
    The test account with 99 EAs

    The second Bitcoin trading Expert ends with 275. And the third one ends with 234. My top 3 strategies were ending with different numbers, they were ending with 865, 734, and 478. You can see in FX Blue that the BTC Expert Advisor ending with 734 is still profitable but other trading strategies are on the top 3 spots in the 99 EAs account.

    What I do to manage this Bitcoin Expert Advisors account?

    I will copy the second and third most profitable Expert Advisors from the folder with the 99 Bitcoin Expert Advisors and I will replace them with the two BTC EAs that went down.

    I need to navigate to the MT4 installation folder on my computer and open the Expert Advisors subfolder where I will search for a Bitcoin EA that was performing well in FX Blue. Let’s start with the EA with number 56713275. This is the Bitcoin trading Expert that was in second place in the 99 EAs account. I will copy it and I will place it in the account where are the top 3 Expert Advisors.

    finding a Bitcoin Expert Advisor in the MT4 folder
    Finding the BTC Expert Advisor in MT4 folder

    I will go back to the MetaTrader 4 platform where the top 3 Bitcoin EAs are trading, I will navigate to File -> Open Data folder, and I will click on MQL4, and then open the Experts folder. Now I will remove the other Bitcoin trading Experts that are already down with the statistics. I need to keep only the EA ending with 865. So, I will remove the rest and I will paste the Bitcoin Expert Advisor with number 56713275 here.

    Now, I will go back again to the 99 Bitcoin Expert Advisors. I will look for the Bitcoin trading Expert with the number 856891234. I copy it, and then I go to the other folder for the top 3 EAs, paste it here, and pretty much that’s it. Now, I will close the folder, and I will return to MT4, Navigator section, and find the Expert Advisors. And I will refresh them.

    Many traders are asking me when I change some Expert Advisor do I need to close the current position.

    So, this is totally up to you, guys. As you saw, one of the stopped Expert Advisor was making a profit. It’s okay if you leave the trade open. Let’s see which trade is opened. It’s the one that I have removed. So, what I will do?

    I will close this trade now.

    Closing the trade
    MetaTrader 4 separate account

    I will close it because I have new Bitcoin Expert Advisors that I want to replace. And if I keep this trade open and I put the other Expert Advisor, obviously, if this Bitcoin trading Expert has an exit condition, it will not be able to manage this trade. I prefer to close the trades. Straight away to place the new ones. Or if you want you can wait until the trade is closed and then replace it. It’s up to you.

    It’s not that huge importance how you will do it.

    Just make sure not to mess up. And that’s why I show you an example with just three BTC EAs, and with time, you can increase the number of Expert Advisor.

    I have now again M15, M30, and H1. Which is very nice.  I’m having three different time frames. And on M15, I will place the M15 Bitcoin Expert Advisor.

    It is asking you do you want to stop the current Expert Advisor and execute the one that you have placed on the chart for Bitcoin M15.

    Yes, I want to. I click on OK, and you see I already have the new Expert Advisor.

    Expert Advisors course explanations
    Replacing the Bitcoin Expert Advisors

    I go to M30, and I will do the very same thing for the third Bitcoin trading Expert. And I double click on it I click Yes, and then I click OK. Then I have my new Expert Advisor. And on H1, I still have this most profitable Bitcoin Expert Advisor, currently going on.

    OK, guys, so that’s it. This is the whole process. This is how we follow the results and trade with the best performing Bitcoin Expert Advisors.

    It’s up to you to decide how often do you want to do this.  Do you want to do it only over the weekend, or you want to do it every day, or you want to do it once every 2-3 days.

    I change the BTC trading Experts every 2-3 days.

    I’m following the accounts that I am trading on, and I change the Expert Advisors that are currently making a profit. Of course, for some people, $100 of profit probably is very small. For some, it is more. I am satisfied with such a benefit for just two days. Let’s be realistic, and let’s not be greedy. This is very important. I’m satisfied to have such a result, especially over a thousand dollars of an account. It is a good result for me personally.

    Thank you very much for reading this article.

    And please don’t take any of the brokers mentioned, any of the websites as a recommendation, any of the trading amount.

    I just wanted to show you how you can trade with an average account of $1000. Of course, I suggest you start trading with 0.01 lot on a real account if you want to trade actually with Bitcoin Expert Advisors on a real account.

    If you practice it on a demo, I admire that keep practicing on demo until you get used to the process. Until you find yourself comfortable. How many Bitcoin Expert Advisors you want to trade, on what balance you want to trade them. And don’t take huge risks.

    Thank you, guys, for reading this article. It was a pleasure for me to share the strategy we used in the Bitcoin Algorithmic Trading + 99 Bitcoin Expert Advisors course.

    And if you have any questions, as always don’t hesitate to ask in our SUPPORT FORUM. Just ask, and I will be there to answer. For more cryptocurrency trading courses, please visit our website.

    Trade always safe! Cheers, guys. Bye!

    Additional information about trading with Bitcoin Expert Advisors:

    • It is possible to trade the EAs only with MetaTrader. The exchanges do not offer to trade with Expert Advisors with MQL code.
    • Trading with Expert Advisors needs a constant connection to the internet. No matter you are using a laptop or desktop, you need to have a 24/7 connection with the internet. This way, you will have a constant connection to the server of the broker.
    • If, for any reason, you are disconnected from the net and the MetaTrader, no worries, here come the magic numbers in hand. Once you are connected back to the server, the magic numbers will detect the opened positions and continue managing them
    • Make sure you place the Bitcoin Expert Advisors in the right time frames. If by mistake you place the EAs on a different chart, they will open trades when the entry conditions are met, but these Bitcoin Expert Advisors were not created for this time frame
    • Trading with Expert Advisors requires proper money management. That is why Petko Aleksandrov always suggests the traders start trading on Demo account, before trading with real money

    You can enter your email address here to receive the free BTC Expert Advisor for MT4 and MT4:

    What is Bitcoin Expert Advisor?

    This is an automated strategy for the Bitcoin, which opens and closes trades according to entry and exit rules that are coded in the Expert.

    How can I create a Bitcoin Expert Advisor?

    If you are not developer you will need to use strategy builders as EA Studio or FSB Pro which allow you to automate trading strategies as Expert Advisors.

    Where can I trade with Bitcoin Expert Advisor?

    The most popular trading platform for Expert Advisors in MetaTrader. The exchanges for cryptocurrencies do not allow algorithmic trading.

    Can I trade with more than one Bitcoin Expert Advisor?

    Yes, it is even recommendable to trade with more than one Expert Advisor because this way the trader does not depend on a single strategy and diversifies the risk in the trading account.

  • FSB Pro: The Ultimate Forex Strategy Course + 12 EAs

    FSB Pro – the professional strategy builder for algorithmic trading

    FSB Pro is a software used by many professional traders in the last ten years. It allows the trader to automate strategies into Expert Advisors without any programming skills. This saves a lot of time and resources to the trader.

    This lecture is part of the Forex strategy course – Portfolio trading with 12 Expert Advisors, and you will learn more about the strategy builder FSB Pro. Enjoy!

    Hello dear traders, my name is Petko Aleksandrov, and I continue with the results from M1 trading plus MACD and moving average filtering on M30. And I also selected the H1 MACD to be another filter. The unique thing with the FSB Pro strategy builder is that it allows higher time frames as filters. This is not permitted with other strategy builders, but that is an essential difference.

    When we trade on the small time frames as M1 and M5, the market is very chaotic. That is why we need to have an idea where the longer-term trend goes. One of the best ways is to use higher time frames as filters. So if on H1 the market shows it is going up, but on the small time frame it shows that it is going down, the trade will not be opened by the Expert Advisor. So stay with me about the details around the FSB Pro strategies!

    As you can see in collections that are repository up in the bar, I have more than 100 strategies.

    FSB Pro collection
    Collection outlook

    It says 100 because this is the maximum we can have in a repository of FSB Pro. But if you delete one of these, another one will pop up on the bottom. And there will still be a hundred. I can now see precisely the number of strategies created. But you can see that a hundred strategy is shown.

    And there, by results, the first one is with a fantastic effect. Actually, with 8441 as a profit. I will click a second time on it. Before I click, you can see that if I select a strategy, all the strategy slots are displayed on the right. And actually, the important thing when you’re selecting strategies that I like to look at is the profit line. I don’t want to see significant drawdowns like this one. I don’t want to see colossal stagnation sideways as well.

    The first strategy generated by FSB Pro so far looks the best.

    You can see that the equity line is very stable, going upwards — no huge drawdowns and stagnations. The FSB Forex software does not have a purpose of showing you a perfect equity line, but an excellent curve-fitted range. This way, the strategies are not over-optimized, and by running some robustness test, we can decide if this strategy is reliable for trading or not.

    And I will start with it. But these significant drawdowns, of course, you can change after if you replace some of the indicators. Or if you add some new signs or if you do some change in the input. If there is a significant drawdown, it doesn’t mean the strategy will be not good. You can still try to change it. But let’s start with the first one.

    As you can see, the first strategy contains the filters that we choose the MACD, the moving average crossover. And we have RSI convergence divergence. Which uses weighted as RSI smoothing method and base price is median(methods in FSB Pro as in Meta Trader). Also, the RSI smoothing period is 162. And reference MA period 86. I’m a little bit worried here if this indicator over optimizes the strategy.

    So, the first thing I will do, I will change it to a round number.

    Let’s see if I will have any change. Here I will go to 90 because it’s a more roundish number. Let’s wait a little bit for the program to calculate the new result. If there is a considerable change, it will give me a sign that this strategy is over-optimized. And if there is no chance, it’s all right for me. And you can see that the change was not big. The profit line is the same. Just the result is a little bit smaller.

    strategy conditions
    Entry conditions for the strategy

    So, what can I do next? I want to go to the trailing stop.

    There is a trailing stop of 236 pips. But I can see that Stop Loss of 82 and Take Profit of 20 pips is there. This trailing stop doesn’t mean anything at the moment. I will go to the settings to the strategy properties, and then I will round this Stop Loss to 80 pips. In FSB Pro, the values of SL and TP are in points. And also the Take Profit I will round 20 pips. Let’s see the result now. This way is even a little bit better.

    What will I do now?

    This RSI converges divergence. What I don’t like is the weighted smoothing method. I want to use simple, but I’m pretty sure now there will be a massive change in the profit line rest. And the base price also likes to use always close. So, what we do? We stay simple and close. You see, there is a margin call with this one. I can give it a try.

    What do I mean? I will go to the optimizer of FSB Pro, and I will do one optimization for this strategy.

    I will keep all of the indicators the same. But I want to see with this simple and close method if I will have a good strategy using those. If not, I will go back. What will I do to stay round? I will choose a step of 10 over here. The trailing stop as we said it doesn’t matter so much. But let’s make it round as well. Maybe when I’m optimizing, it will find some good trailing stop there. So, I will go to 200.

    And then, if I go to the optimizer, I will choose a step of 10 pips. Here I need a step of 10 to stay around. Fast-moving average shift and slow-moving average shift. We always try to stay away from shifting the indicators. And then for the moving average crossover, we have 10 and 20 as default. Here we can have a look for a better moving average crossover.

    For those who did not try the FSB Forex software before with simple words, we can say that this tool improves the strategy by changing the parameters of the indicators. However, that might be risky because the strategy might fit the past Historical data, and it will show better results. But this does not guarantee future success. This is why in FSB Pro, we have the Monte Carlo and the Multi-Market, which are tools to check if the strategy is over-optimized or not.

    I will give it a try with the optimizer. The MACD, when I’m using MACD on a higher time frame, what I like to do is to optimize only the slow moving average. This way, I’m staying away from the over-optimization. Because if I over-optimize the slow, the fast, and the signal line period, the program will find the best input for 3 of those. And the strategy will be over-optimized.

    This is what you need to be careful of when using the FSB Pro optimizer.

    I optimize only the slow-moving average period. Then for the moving average, I can see also if there will be a better entry on the moving average. And the Stop Loss I will stay with ten as a step. And then, if I click plus-minus 20, I need to arrange the minimum and the maximum. Here I would like to stay at 10. The ceiling will be 100 pips. Now, we wanted to Stop Loss from 50 to 100. And Take Profit from 10 to 50 pips:

    Fsb pro optimizer
    Optimizer find the best parameters for the strategy

    And then moving average 1 to 21 is ok for me. The MACD in FSB Pro is just the same as in all platforms, no matter the look is different. It is the same formula.  I need to have a slower moving average more significant than the fast and will put as a minimum 13.

    I will do the same with add the MACD. The moving average crossover to keep the fast-moving average smaller than the slow I need to put kind of border between them. Here I will place 15 as maximum, and I will place 15 as a minimum for the slow-moving average.

    This means that the fast-moving average will be between 1 and 15. And the slow will be between 15 and 40. Then for the RSI convergence divergence, I need to place here 10 and 10. Here I will stay at 100.

    So, now, actually here I need to place 200.

    Because the RSI smoothing period could be more significant than 100, actually, both of them could be bigger. Let’s say what will happen if I stay with the 200 as the maximum because this is the maximum of the inputs that come with Forex Strategy Builder or FSB Pro. And then the trailing Stop Loss I will go from 10 to 200, which is the maximum for the trailing stop. But I don’t think this will have any impact on the strategy.

    But let’s see what will happen if a good strategy will come up with this optimization. And if it doesn’t, I will go to the properties of RSI convergence divergence. It will take a couple of minutes to do this optimization because we are using a lot of indicators here. I will continue with this video once the optimizer is ready.

    After the optimizer in FSB Pro is ready, I can see that I have a much better profit line with a lovely result.

    And let’s see the differences.

    I can see a little bit bigger Stop Loss of 90 pips, which is all right. Here we see the initial input, and here is the best data, which is after the optimizer. The moving average didn’t change, which is all right. MACD went to 35, and the other MACD stay it 26. The moving average crossover the fast change to 3 and slow went to 21, which is all right as well.

    The RSI convergence divergence 140 and 20. But there we have the simple and the close, which is better for me. We have a trailing stop of 90, which is the same as the Stop Loss here.  I think we have a better strategy:

    new parameters for the strategy
    Results after the optimization are over.

    Let’s go to the editor and over here what I think now is the right thing that the trailing stop is having an impact. And then the RSI converges divergence is with the simple as a smoothing method, and the base price is close.

    I think this FSB Pro strategy is good.

    I see here one significant drawdown. Let’s have a look at how much is that. The maximum balance drawdown is above $1000, which is not nice. And in the beginning, as you can see here, there is drawdown also, which is almost leading the strategy to the margin call. The thing here is that this strategy starts from 1000, and I’m adding three times 0.1 lot size.

    Normally, I wouldn’t do that if I’m trading 1000 account. I trade 0.1 of my strategies when I’m trading 10 000 of account. Here I would usually trade it this way. If I have $1000 of account, I will trade it with 0.02. And then the maximum position would be 0.08. Which is four times, and here on the winner, I will add 0.2? And then the amount to close on the reduction will be 0.2.

    Now you will see a vast difference there. With 1000 account, there is a maximum equity drawdown of 236, which is all right. And as you can see here, the result is $2567. As you know, our money management is according to the account. And we don’t use percentage when using the FSB Pro strategies.

    We trade with 0.01 lot if we are trading account below $1000.

    Between $1000 and $2000 of account, we trade with 0.02. So, let’s say our account now is 1000, we reached above 1000. Or we start with above 1000 account between 1000 and 2000 of account. What do we do? We trade with 0.02. And when the account reaches 2000 let’s say it reaches at this point 2000.

    OK, let’s say we’re trading one strategy only. Which we never do. We always trade portfolio strategies. But I want to be clear with my explanation. The example I would give you, let’s say, we started with a $500 account. What do we do? We will trade with 0.01, which is the minimum amount allowed? And then I’m trading, for example, a couple of days and weeks, and the account reaches 1000, above $1000.

    Then I will change to 0.02, and then when the account reaches 2000, I will change to 0.03. This is very important to be understood that the amount of a lot size traded should be according to the amount of the account. And when you are using a portfolio, you are diversifying the risk. Everything is all right. In this case, I would stay with this example. So, here, the maximum drawdown is all right, which is above 14%.

    And if your account is between 1000 and 2000, you should be trading with 0.02 as a lot to enter. This is a money management system, and it has nothing to with the FSB pro.

    Let’s go now to the Monte Carlo of FSB Pro.

    I want to see one more time if this strategy is over-optimized or not. Here I am always checking the randomized history data, randomized spread. I don’t think I need this because EURUSD is a really small spread in Pepperstone.

    The strategy variation – this is the most essential randomize indicator parameters.

    It means the program will do simulations with different indicator parameters. And if there is a losing strategy, it means that the strategies over-optimized with the current inputs. And the randomize backtest starting bar is important as well. We want to check what the strategy started on a different backtesting date. And then I will click on start, and let’s see what will happen.

    It will take a couple of seconds and minutes. And I will continue the video after that. Once the FSB Pro Monte Carlo test is ready, I can see excellent results there:

    test to perform robustness in the strategy builder
    Monte Carlo results

    As you can see, the profit line is pretty much the same everywhere except its different results. Which is reasonable because the strategy starts on a different backdate. And then I will go back to the editor.

    Multi-Market is one of the other tests you can do. This is the type of analysis that I’m not always doing. And I will tell you why. It’s an excellent option for the Forex Strategy Builder professional, of course. But the idea behind it is different for me.

    What I mean is, we do the Multi-Market test in FSB Pro, I will run it now. 

    And I will explain while the Multi-Market is doing the test. The thing here is that EURUSD is a different market from all the others. The cable is different from all the others and the JPY and so on, and so on. What I mean is there are various markets. There are currencies of different countries, and this doesn’t mean that if this strategy fails here as you can see, it fails on 4 of the market, and its profitable a lot of 2.

    This doesn’t mean that this strategy will not work on EURUSD. Because it’s created based on the backtesting data of the EURUSD. I’m expecting it to continue working on the EURUSD. What I mean is that I use this Multi-Market to see in which other markets I can use this strategy.

    That is why the FSB Pro comes very useful. It shows the results in seconds and saves so much time for testing on Demo account

    And there will be video in the Forex Strategy Course – Portfolio Trading with 12 Expert Advisors actually how we change the strategy from one market to another mostly using the optimizer.

    You can do this Multi-Market test. I recommend you do this all the time in the beginning. And with the time you will decide for yourself, is it all right or not to right to use it. Of course, if this Multi-Market analyzes test shows that all the other strategies are losing, this will link me to the thought that probably there is something wrong with the strategy is over-optimized by the FSB Pro optimizer.

    But with the result like this, this is very normal.

    There are two markets more that are profitable. There is four losing, but they’re not really like losing dropping down, which is all right. And if I play with the inputs a little bit more there, I use the optimizer with a roundish number. I’m sure this strategy will work on the other markets as well:

    robustness test for the software
    FSB Pro Multi-Market test

    So, pretty much, I’m ready with this strategy. What will I do now?

    I will go to the strategy properties in FSB Pro. I will go back to 0.01 because I need to test this strategy first with 0.01 lot size before I place it on a more significant account. And that’s why I’m here using 0.01 as always, and this is actually suitable for using on accounts smaller than $1000. Then what I will do? I will save this strategy. I will save it in the folder that I’ve created.

    It says to add three times M1 means we are adding three times with the strategy. M1 is the trading period we are using. We have MACD and moving average filters on M30 and H1 MACD. All these strategies from the collection that I will select, I will put them in this folder.

    I will have a pack of Expert Advisors, a package of strategies that I know are in this folder because of these filters. The name of the strategy, I will have an exclusive video about how I name the strategyI always start first with the market I’m using, with the pair.

    So, this is EURUSD. It starts with ten; this is the magic number.

    Then I have the filters. I have 30 and H1 as a filter. But first of all, it is the trading period. It will be 1001 because we are trading on the 1-minute time frame. Then I have a 30-minute filter. And I also have a 60-minute filter. But then here I will place just one, or you can place 60, which is 30 and 60 minutes. Or you can place 30 and 1, which is 1 hour. It’s up to you which one makes you more sense in which one is easier for you to use.

    I will stay with 10 for EURUSD, 01 for the main trading period, 30 and 1, which I will know that this is 30 minute and 1-hour filters. This is what makes FSB Pro unique software because it allows the Longer Time Frames.

    And then I need to have a clue that here and this strategy I’m adding three times.  I will add three, and then I will go for 01. Three is because I’m adding three times and 01 because this is the first variation of the strategy. I will have another 98 possibilities to change this strategy.

    Once again, 10 for EURUSD, 01 because this is the main trading period. 30 because this is one of the longer time filters, and 1 is another long time filter that I’m using for the MACD. And then three because this is how many times we are adding to the position. And 01 this is the first variation of the strategy.

    Then I put some of the indicators that I’m using, and I have the MACD and the moving average crossover. And then, I have the RSI convergence divergence.

    And this is pretty much all about it. I will save this strategy over here in this folder. And it will come here with the name.

    What do I do after that? I will go to the repository, and I will select some of the other strategies:

    FSB Pro software
    Repository is where all the strategies are stored.

    But I will continue with this on the Forex Strategy Course – Portfolio Trading with 12 Expert Advisors.

    In this course, I show the FSB Pro and the EA Studio, which is the web-based strategy builder.

    Of course, I’m not going to do hundreds of videos about these strategies. Probably, I will do 1 or 2 more.

    What is the most important with FSB Pro?

    • build a strategy
    • optimizing
    • testing 
    • analyzing 
    • robustness testing
    • export with one click for MT4 and MT5

    And actually, here are the strategies. But here you can see there is Pepperstone EURUSD M1, which came after the optimization. The older strategies that I’ve tried and selected and tested. Here all the variations of these strategies. You can delete this from unload, and here is the collection where I selected the first strategy.

    If you have any questions about FSB Pro or the course, let me know in our SUPPORT FORUM. I’m always there to answer.

    Trade safe!

    [sc_fs_multi_faq headline-0=”h2″ question-0=”What is FSB Pro?” answer-0=”FSB Pro is a software that allows the traders to automate their trading strategies as Expert Advisors with one click. ” image-0=”” headline-1=”h2″ question-1=”How can I test FSB Pro? ” answer-1=”There is a 15-days free trial for everyone who wants to test the program. During this time, an unlimited number of Expert Advisors could be exported. ” image-1=”” headline-2=”h2″ question-2=” Is FSB Pro useful for beginner traders?” answer-2=”The program comes with a complete user guide and free educational videos. It is suitable for beginner traders.” image-2=”” headline-3=”h2″ question-3=”Can I use FSB Pro if I am not a developer?” answer-3=”The traders export the strategies as Expert Advisors with one click for MetaTrader4 and MetaTrader 5. No IT skills are required. ” image-3=”” count=”4″ html=”true” css_class=””]

  • Basic cryptocurrency trading course – how to place the best EAs in a separate account

    Basic cryptocurrency trading course – how to place the best EAs in a separate account

    .

    Basic cryptocurrency trading – the necessary steps for every trader

    Basic cryptocurrency trading course is actually a step to the professional algorithmic trading with cryptocurrencies. It is a course much further from the basic that could be found over the internet.

    In this course, the mentor Petko Aleksandrov starts with the basic cryptocurrency trading terminology and details that a beginner trader needs to know before start trading with cryptocurrencies. The students will learn how to install the Meta Trader platform, how to choose the currencies to trade, what are the pips and the points and so on.

    As a demonstration, he uses the four cryptocurrencies – Bitcoin, Dash, Ethereum, Litecoin. There is a demo with manual and algorithmic trading. This way the students can choose which option is more suitable for them.

    The manual trading system in the basic cryptocurrency trading course is based on the Counter trend line:


    basic cryptocurrency trading view
    Example from the manual trading system.

    This trading system is based on the trend direction on the longer time frames as a Daily chart and Weekly chart, and the counter-trend line on the hourly chart. The counter-trend line gives fantastic opportunities to enter on the market and Petko dedicates a whole course on it called Bitcoin trading course – Cryptocurrency never losing formula.

    In the basic cryptocurrency trading course, are placed many examples of live trades, that make the system clearer.

    The second part of the course is dedicated to algorithmic trading. For all new traders, algorithmic trading is possible with Expert Advisors. Expert Advisor is the automated version of a strategy. How exactly it is working you can find in our post Expert Advisor – the Reality.

    During the basic cryptocurrency trading demonstration with EAs, the students will examine 12 Expert Advisors trading on the four cryptocurrencies. The mentor has selected standard H1 chart, and created 4 strategies for each crypto.

    This way he puts equal weight on each cryptocurrency, and that is the idea in portfolio trading of Expert Advisors.

    Below you will read a free lecture from the basic cryptocurrency trading course, called How to place the best EAs in a Separate account?

    During the lecture, you will learn from Mr. Aleksandrov, how to maintain or manage the trading accounts. Why do we say account? As we said in one he is testing the strategies virtually, and on the other one, he places the top performers. If one fails at a current moment, he replaces it with another one that proved profitability.

    Enjoy the lecture:

    Hello dear traders, I continue with a little bit more of statistics that I have already:


    statistics website
    Following the stats and the EAs in the account.

    Still, I have the three profitable trades on the top. These are the ones with the Bitcoin.

    You can see if I just move it a little bit sideways that these are exactly the magic numbers for the Bitcoin 732374 and then we have 508. This is very, very normal because the Bitcoin is much more volatile than the other cryptos. It is normal that the Bitcoin at the moments will make a bigger profit. That is why for a basic cryptocurrency trading, I have selected these 3.

    But at the moments as well it will make bigger losses, much more volatile asset as you know. Anyway, what are the options now?

    One option is, you can put the top 3, the top 5. Or in this case, you can put the top 6 which are currently making a profit. You can see they are on profit. If I click on the Net profit you order the strategies according to the profits. You can do the same as with profit factor, with winners trades, with all the statistics here. But what we are looking for is the Net profit.

    As I said most of the time you will see the Bitcoin that is on the top because of its volatility.

    What you can do with this basic cryptocurrency trading system?

    Instead of taking the top Expert Advisors or strategies you can take the top 1 from each cryptocurrency. What I mean, is you can take only this strategy that ends on 508. And then you take the best one from the Litecoin for example. And let’s see which is this Expert Advisor ending on 065. 065 where is it? 065 it’s right over here. This is for the Ethereum.:

    Basic cryptcurrency trading tricks
    The magic number helps us to identify which is the Expert Advisor.

    Let’s see which one is the other one 314. 314 that is the one with the Dash. What you can do, is you can take the top ones from each cryptocurrency. Currently, we see that with the Litecoin not yet a lot of data. Or we have these losing strategies probably some of those are with the Litecoin. I see this 007 is with the Litecoin.

    Then we have 291. 291 is with the Dash. 979 is with the Ethereum and these last ones 005 is with the Ethereum. And 097 here with the Dash.

    It doesn’t mean that these strategies are actually losing. What it means, is that they are currently making losses. This is once again because the market is changing and it’s changing every day. And it’s normal every strategy, every Expert Advisor to has profits and to has losses, and you will see this in this Basic cryptocurrency trading course.

    We always keep in one account the top performers.

    I will show you exactly this system. So, it’s up to you once again if you want to take the top 3 from all of the strategies, the top 5, the top 10. It is your choice or if you want to have more diversification of different cryptocurrencies. Because if I put the top 3 I will stay only with the Bitcoin.

    But my idea in the basic cryptocurrency trading course is to trade the top 3 from different cryptocurrencies. 

    I will take the top 1 from the Bitcoin, the top 1 from the Dash and top 1 from the Ethereum.  I will just write them down on a piece of paper or in any file. I’m writing the magic numbers of the strategies that I want to use. The first one is 86638508. Now, the next one is the one here with 065. One more time let me check it 065, it is with the Ethereum.

    I will write it down 87254065. Then I will have this one over here which is 87110314. And this one as we saw it is with the Dash. I have this strategy, this strategy, and this strategy.

    Now, I will show you in this Basic cryptocurrency trading course how you need to select these 3 strategies.

    I’m going to File, Open data folder and then I’m going to MQL4 and I click on Experts. And here are the 12 Expert Advisors. What I will simply do?

    I will take the ones with these numbers. If you have many, many strategies like 99 with our other courses you can write down the magic number. It will be easier for you to find it. Anyway, with the 12 is very easy. The Bitcoin one was 508, it is this one. I press and hold ctrl. So, the other one is 065. It is this one over here with the Ethereum. And 314 is this one with the Dash.


    basic cryptocurrency trading with EAs is much easier
    Selecting the top EAs for each cryptocurrency.

    So, what I will do? I will copy this and I will create one new folder that says top 3. After that, I will just paste these Expert Advisors here. Now what I will do, guys?

    I will open another demo account and I suggest you do this whole process first on demo accounts.

    And not to hurry going into live trading, that is what I always suggest my students from the Basic cryptocurrency trading course.

    Just to master it and to see how it’s working.

    I will just copy this and I will go to another demo account that I have open. And I will paste these Expert Advisors over there. File, Open data folder then I click on MQL4 and I go to Experts. And I will paste these 3 Expert Advisors that I have selected from the other account. I am closing it. I’m going to Expert Advisors and I will click on refresh.

    When it is ready you will see them just below Expert Advisors and here they are. Now, I have here some Forex currencies open. I will just close this all.

    How to place cryptocurrency Expert Advisors on Meta Trader?

    • one chart for the Bitcoin and drag the Expert Advisor
    • one for the Ethereum and you can double click on the EA
    • and one chart for the Dash, any of the two above

    What I can do, is I can just drag the Bitcoin over here. I can drag the Ethereum over here and I can drag the Dash over here. Make sure to go on the exact time frame. I will make the others as well on H1 and the Bitcoin:

    basic cryptocurrency trading with 3 Robots
    A separate account to trade the top performers.

    The next thing is I need to enable the automated trading. You can do it also with Ctrl + E. Then I will drag it over here. I click on OK, I will drag the Ethereum as well, I will click on OK and I will drag the Dash as well and I will click on OK. You see the 3 Expert Advisors are smiling and they are working now as well on this account.

    So, this is how we are doing it. We move the best performers.

    You can create your own system, this is an example way in this Basic cryptocurrency trading course, you can create your own system for moving only 1 Expert Advisor. You can change it, you can do whatever you want basically with the Expert Advisors. This is a simple system that I’m sharing with you.

    Just take top Expert Advisors from each time frame and place it in another demo account. Now, this process just repeats. We connect this account with FX blue. We follow this performance, we follow the performance of the other account where are the 12 Expert Advisors.

    And if any of these 12 Expert Advisors start to show better results than any of these 3 I will replace it, I will delete it from the second account. I will put simply the better Expert Advisor.

    Very simple Basic cryptocurrency trading system.

    One of the most frequent questions that I get is How long time to test this basic cryptocurrency trading system?

    That is a really personal choice and with everybody is different. It is hard to recommend time because it depends on how much time you are spending. If a trader spends a few hours a week after work on testing any strategy, and another works all day long on it, obviously the second will get it faster.

    Patience is needed when testing a strategy. The huge mistake I have noticed with the students in the Basic algorithmic trading course traders do is to test it for a few days or a week. They see some quick profits and jump on a live account with huge trading lots.

    Why do traders need to practice on a Demo account?

    1. One week is a short period of time to test any trading strategy. A trader needs longer time to observe results, and especially if those are with Expert Advisors.
    2. A lot depends on the volatility that is on the market. In the basic cryptocurrency trading course, you will see that it takes time trades to open and close. And we can not depend on the results from one or two single opened trades.
    3.  Predefined period to test any Expert Advisor as 2 weeks, 1 month, 3 months, etc. This way you will avoid the emotions(get into live trading when there are profits on the virtual account).
    4. A minimum number of trades for the Demo account is a good method. For example, to move the top 3 on a separate account when they make a minimum of 10 trades. This way the trader eliminates the time as a factor.

    However, the EA Studio that we are using to generate strategies is limitless with its capability. We can generate daily strategies, test them and trade them. And that is the whole idea.

    Hope it’s clear. Don’t worry if you have any questions or if you didn’t understand something you can always ask me in our SUPPORT FORUM and I will be there to answer you.

    Thank you very much for reading. If you are interested in the whole course, the name is Basic Cryptocurrency trading course – from A to Z.

    For more cryptocurrency trading courses please click the link: https://eatradingacademy.com/courses/cryptocurrency-trading/