Blog

  • MetaTrader Expert Advisor [EXPLAINED]

    MetaTrader Expert Advisor [EXPLAINED]

    Today, I will tell you more about MetaTrader Expert Advisor, what are they actually, and how to use them in algorithmic trading.

    Are you looking for a free MetaTrader Expert Advisor to download? Scroll to the bottom of the page and learn more about how to get a free Expert Advisor for MT4 and MT5.

    MetaTrader Expert Advisor is something quite popular among traders. Many beginner traders think that Expert Advisor is actually a human or an expert that will guide you and help you while trading. Well, that’s not true.

    Expert Advisor is actually a programming code that we use to trade automatically. In other words, this is a trading robot.

    MetaTrader Expert Advisor is a Robot for MetaTrader 4 and 5 trading platforms
    Expert Advisor is a Trading Robot

    Everyone knows what is a trading robot I guess but the Expert Advisor, as a phrase, is the official name, or let’s say robot is the slang word. When we say Expert Advisor, it actually means a trading robot. So that’s a code or automated strategy that we use for trading.

    So if we have a strategy and we want to apply it on the Forex market, on the cryptocurrency market, on even the stocks market, we can use robots.

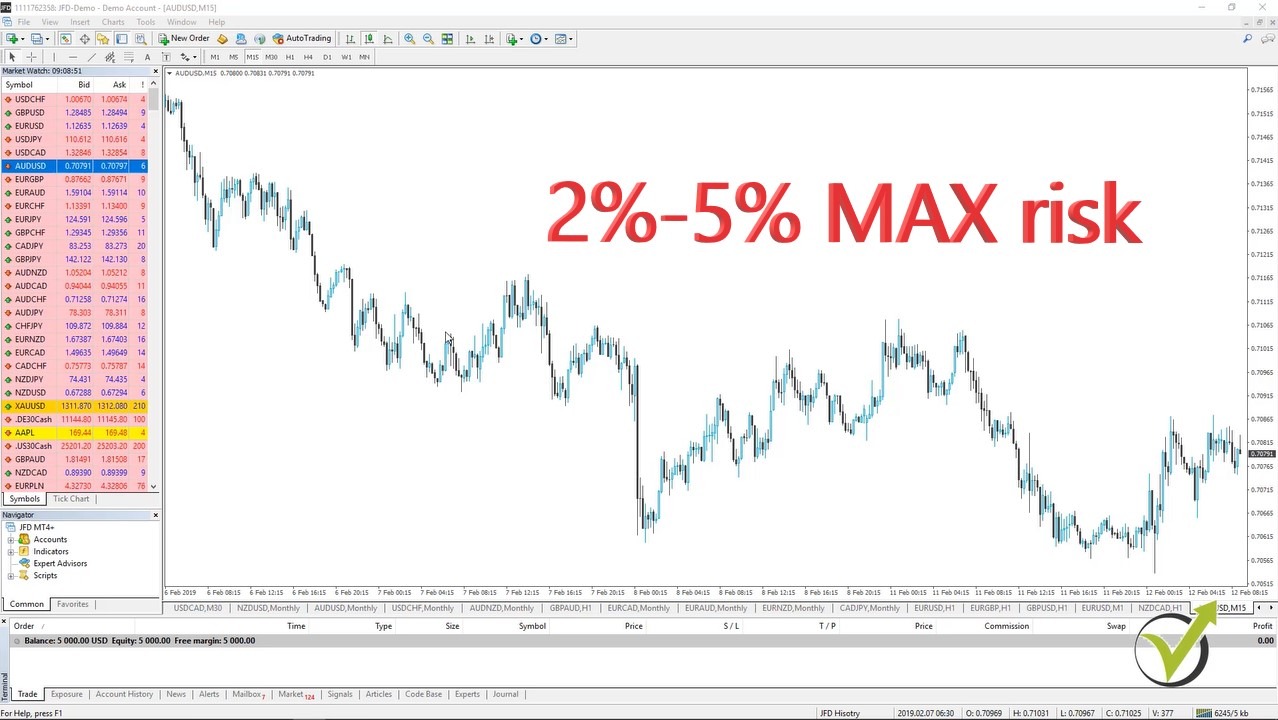
    But do you know why traders use Expert Advisors? Because this way we avoid the emotions. We don’t manually click and buy with the computer mouse. I don’t execute positions manually on the Forex market for a few years now. I use only MetaTrader Expert Advisors. And here comes the next question about Expert Advisors.

    What is MetaTrader?

    MetaTrader is the most popular trading platform which is free and most brokers offer it. So if you want to do algorithmic trading, then you better look for brokers that offer the MetaTrader platform. MetaTrader is a third-party company product, developed by MetaQuotes, which offers a trading platform to the brokers.

    MetaTrader is developed by MetaQuotes
    MetaTrader is developed by MetaQuotes

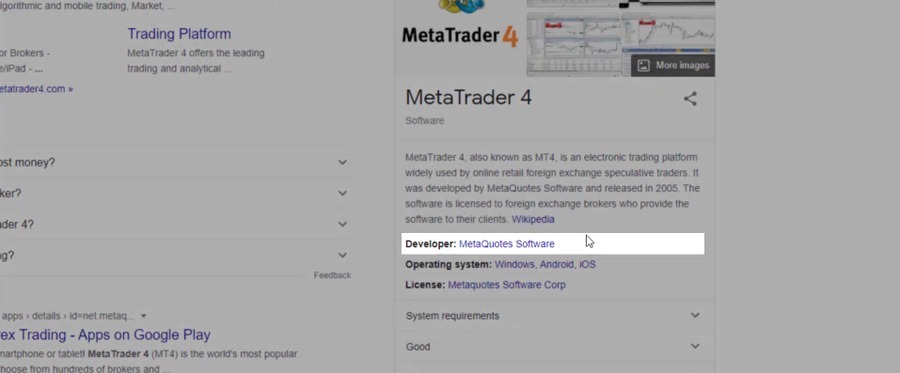
    So MetaQuotes actually sell the platform to the brokers and then the brokers offer it for free to us, the clients. It’s just the broker who pays to MetaQuotes. And it’s quite expensive, last year when I was at the Expo in Cyprus, the Forex Expo, I think the price for MetaTrader was was about $75,000 a year.

    So this could be one sign of a reliable broker. If they offer MetaTrader, it means they have $75,000 a year to pay to MetaQuotes company. So this is not just a group of people or someone who just established a broker and they don’t have $75,000 for MetaTrader.

    What is MetaTrader Expert Advisor?

    But why do I say MetaTrader Expert Advisor? Because the Expert Advisors and the robots are created for this trading platform. MetaTrader is the most popular trading platform in the world. Moreover, it is the most reliable platform for algorithmic trading with Expert Advisors.

    And by the time you’re reading this lecture, it could be that some other platforms or web-based platforms can actually offer algorithmic trading, but I’m pretty sure that MetaTrader will last for probably another decade on the market because already many of the brokers use it.

    The MetaTrader variations

    We have 2 major variations of the MetaTrader platform. One is MetaTrader 4, or MT4, and the other is MetaTrader 5, or MT5. In the last several years, the guys behind MetaTrader are pushing the clients to MT5. Even from the official website at mql5.com, you cannot download MT4 anymore. But most of the traders like me still use MetaTrader 4. And I will tell you why.

    Because there are bugs with MT5 that are still there. Moreover, when it comes to algorithmic trading and MetaTrader Expert Advisors, it is so much more comfortable to use MetaTrader 4 compared to MetaTrader 5.

    Compiling the Expert Advisors in MT4 & MT5

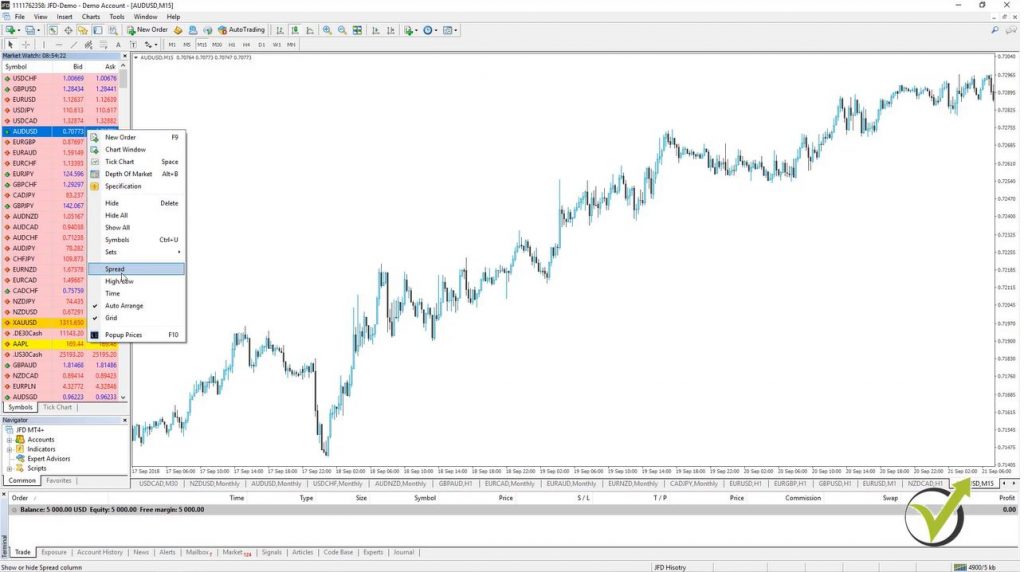
    First, when we use many Expert Advisors in MetaTrader 4, just like what I show in my courses, there is the Refresh trick. When you go to the Navigator and you just right-click and refresh, you can compile all the Expert Advisors.

    Click on Refresh

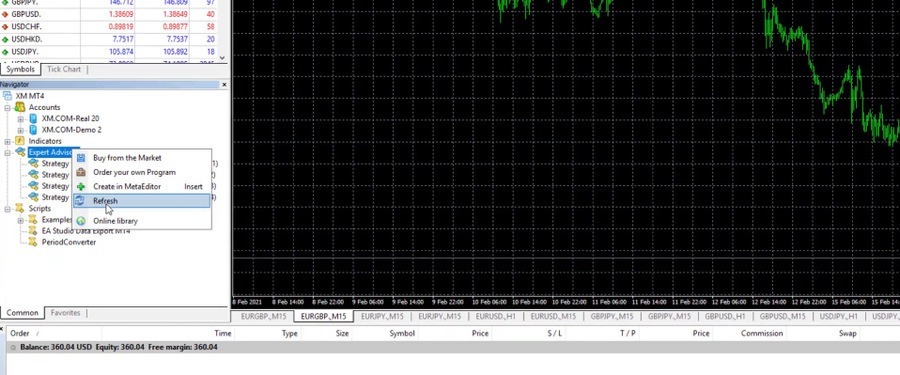
    And what this means for beginners? When we have the code for the Expert Advisor, we need to compile it to a ready EX4 file which is the ready-to-use file by the MetaTrader platform.

    And if you have like 50 Expert Advisors, with MetaTrader 5 you need to click on each one and compile from the MetaEditor, which is the place from where developers code the Expert Advisors.

    The MetaEditor

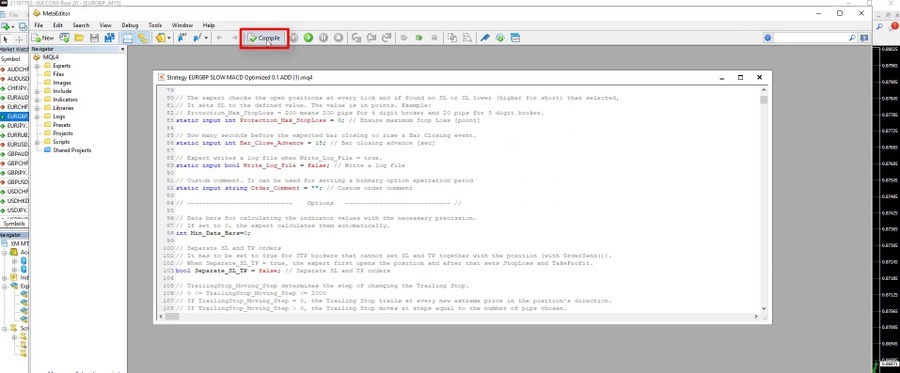
    Now if you close MetaTrader 5 and reopen it, they will be compiled. However, I’m not that sure if that method is reliable.

    So I definitely use MetaTrader 4 when I trade with many Expert Advisors because I just right-click with the mouse and compile all the EAs very quickly.

    Limitations when trading with Expert Advisor in MT5

    The second concern when we use MetaTrader 5 is that we cannot choose the direction for the robots. And with many semi-automated systems, you might want to choose a direction for the robot, Only Long or Only Short. In other words, you can set it only to buy or only to sell.

    What long and short position means

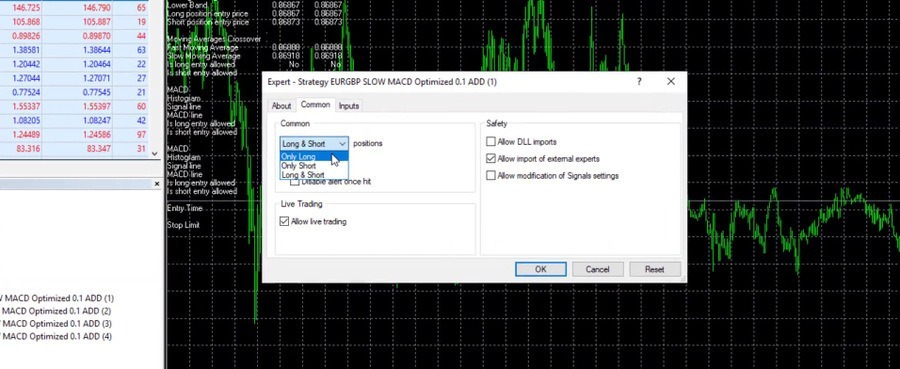
    If you see a clear uptrend with any asset and you just want to buy but you want to use a robot for that or MetaTrader Expert Advisor, with MetaTrader 4 you can set it to only long. Which means it will only buy. Or if you see the market going down, you want to sell, then you can use the Robot with only short mode. Which means that it will only sell. With MetaTrader 5 Expert Advisors, that’s not possible.

    And lastly, it depends on the broker you select to use. Some brokers offer MetaTrader 4, others offer MetaTrader 5 and the big brokers offer both MT 4 and MT5. So you can have an account in both of them if you wish.

    Courses with 99 MetaTrader Expert Advisors

    Now keep in mind that when you trade with Expert Advisors and if you want to trade with many, you can go maximum of 99 charts with MetaTrader. Meaning that you can trade 99 MetaTrader Expert Advisors simultaneously and that’s the maximum.

    That’s why I have 3 courses where I include 99 MetaTrader Expert Advisors. This is the Automated Forex Trading course, the Bitcoin Algorithmic Trading course, and the Ethereum Trading course where I include 99 Expert Advisors monthly. So everyone who enrolls in the course can actually test the 99 Expert Advisors. And to make the courses really useful, I have decided to update them every month with new 99 EAs. Basically, these are the EAs that I use for my personal trading.

    My system for trading with Expert Advisors on MetaTrader

    And what’s the system that I follow when I trade with MetaTrader Expert Advisors? I trade many EAs on a Demo account. And then for my Live account, I put the top performers.

    So I test, for example, 99 Expert Advisors on 3 different currency pairs, let’s say EURUSD, EURJPY, and USDJPY. This way I have equal exposure. Then I follow the results through statistical websites like TradingView, and finally, I put in my Live account only the top-performing MetaTrader Expert Advisors. This way, I always trade the Expert Advisors or the robots that are currently profiting on the market. That’s the system I’ve been using for the last 3-4 years, and it works pretty well for me.

    If you want to learn more about this system, check out the above-mentioned courses, where I show how I do everything step by step.

    How to create Expert Advisors for MT4 & MT5

    I want to say that I’m not a developer. I don’t know how to code Expert Advisors and I don’t need to. Why? Because in the 21st century there are strategy builders that create EAs automatically for us. These are software or programs which allow us to program or automate the strategies without coding experience.

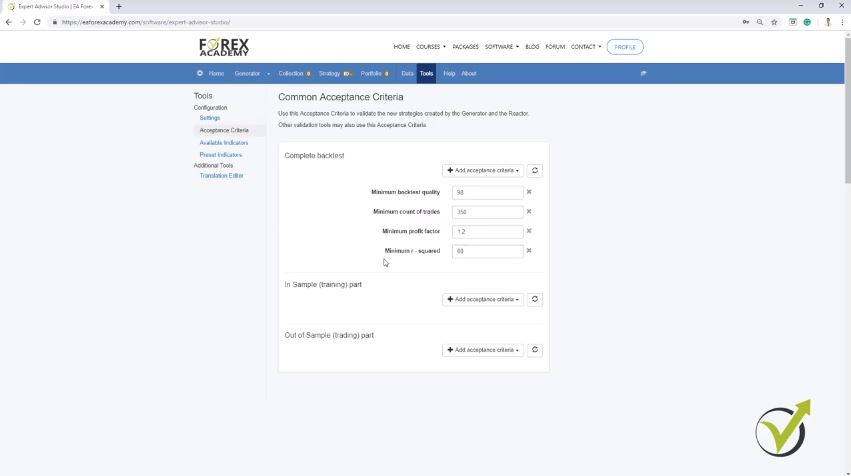
    Of course, most of these strategy builders are costly because they save a lot of time. They are professional tools for traders. I use 2 of them – one is EA Studio and the other one is FSB Pro. We have integrated them on the website for everyone who wants to try. There are 15 days free trial which you can use to export, generate, and automate as many Expert Advisors as you wish without limitation.

    Make use of the trial period

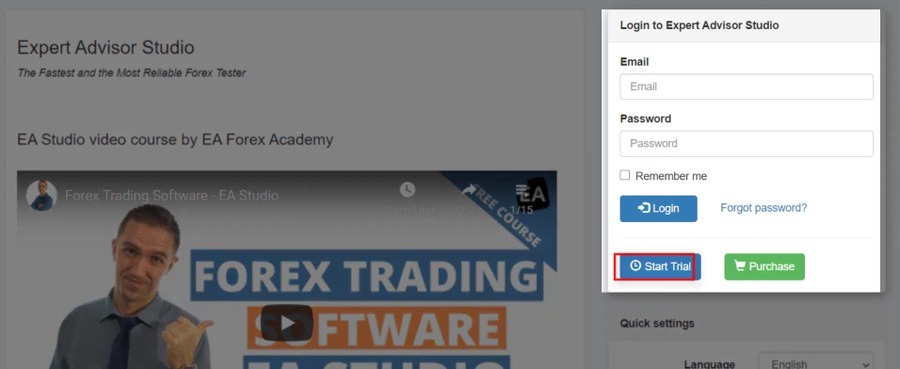
    And actually, you could use these programs without a license. You just need a license when you are exporting the strategies as Expert Advisors for MetaTrader. But that’s the easiest way to go. Anyway if you want to have your own Expert Advisor you need to learn to code or you need to hire a developer. Both will be costly as well. And because I don’t want to do both of them, I use the strategy builders.

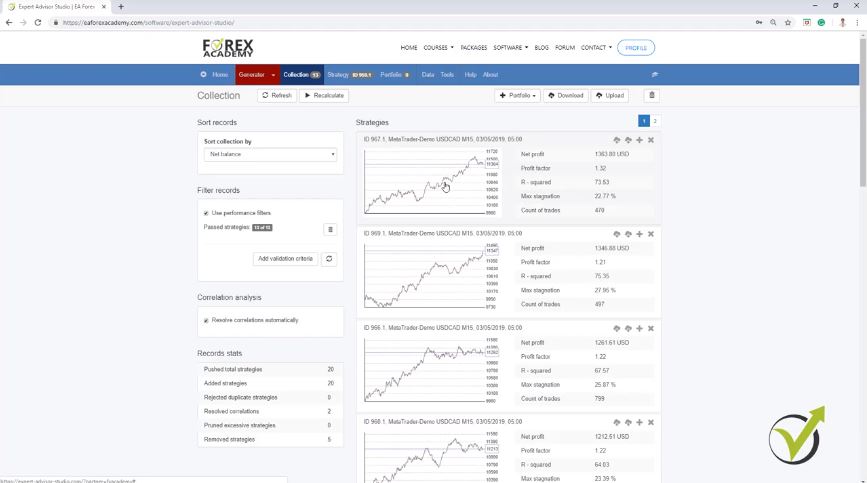
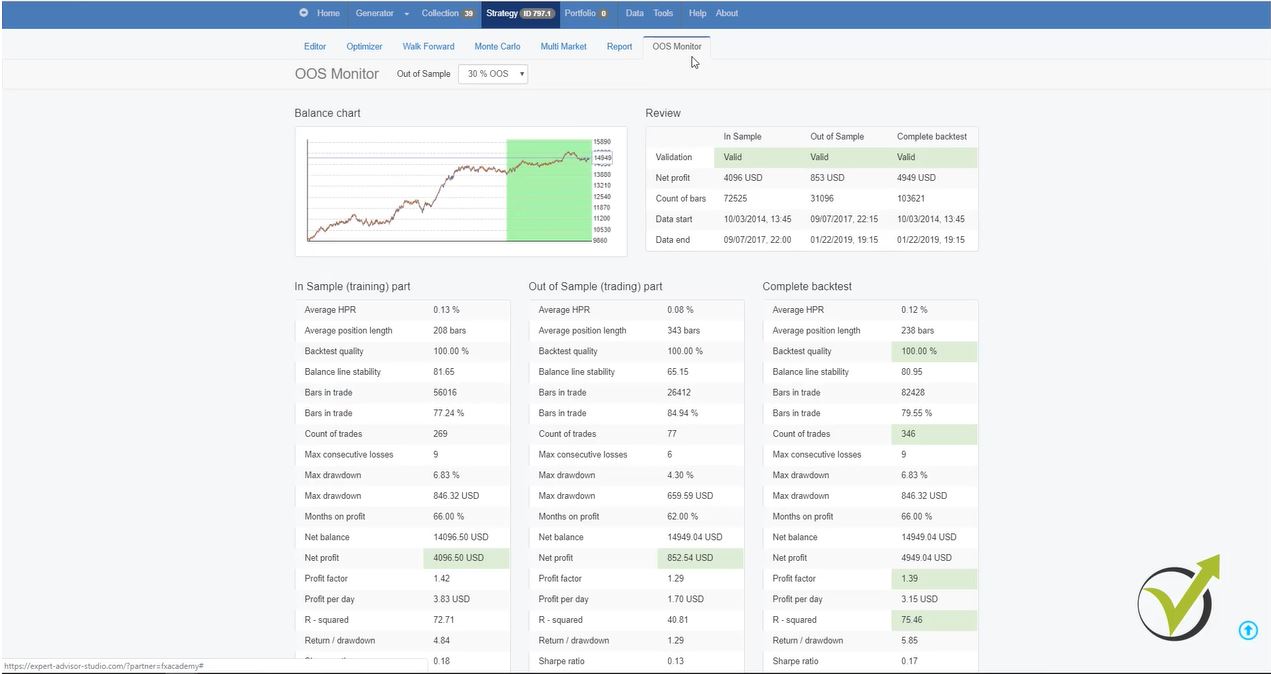
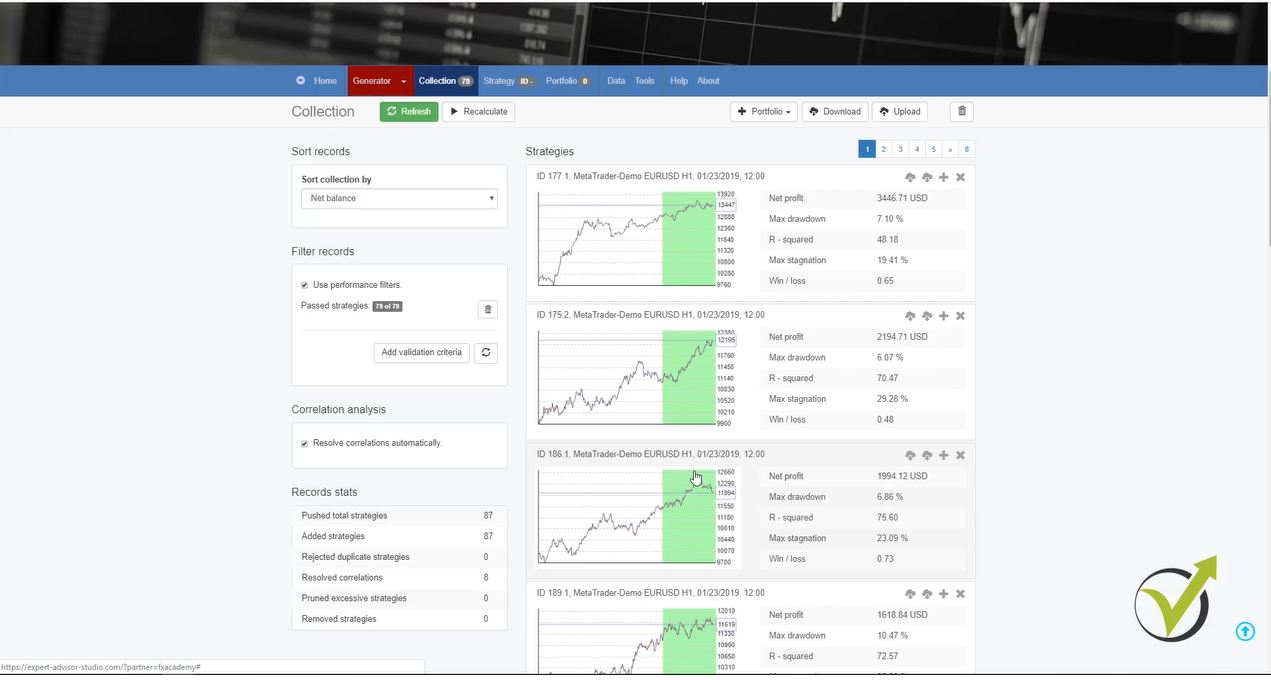
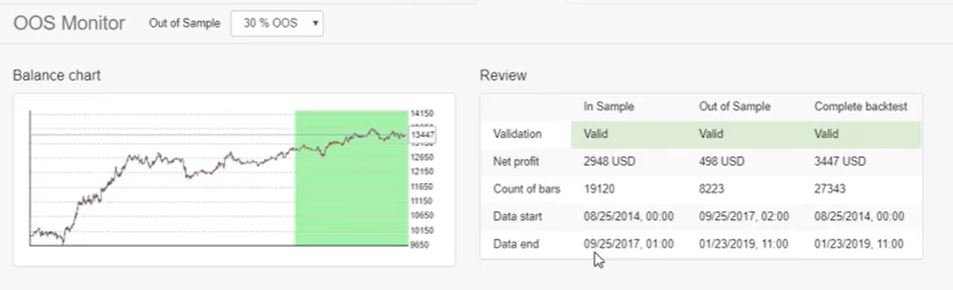
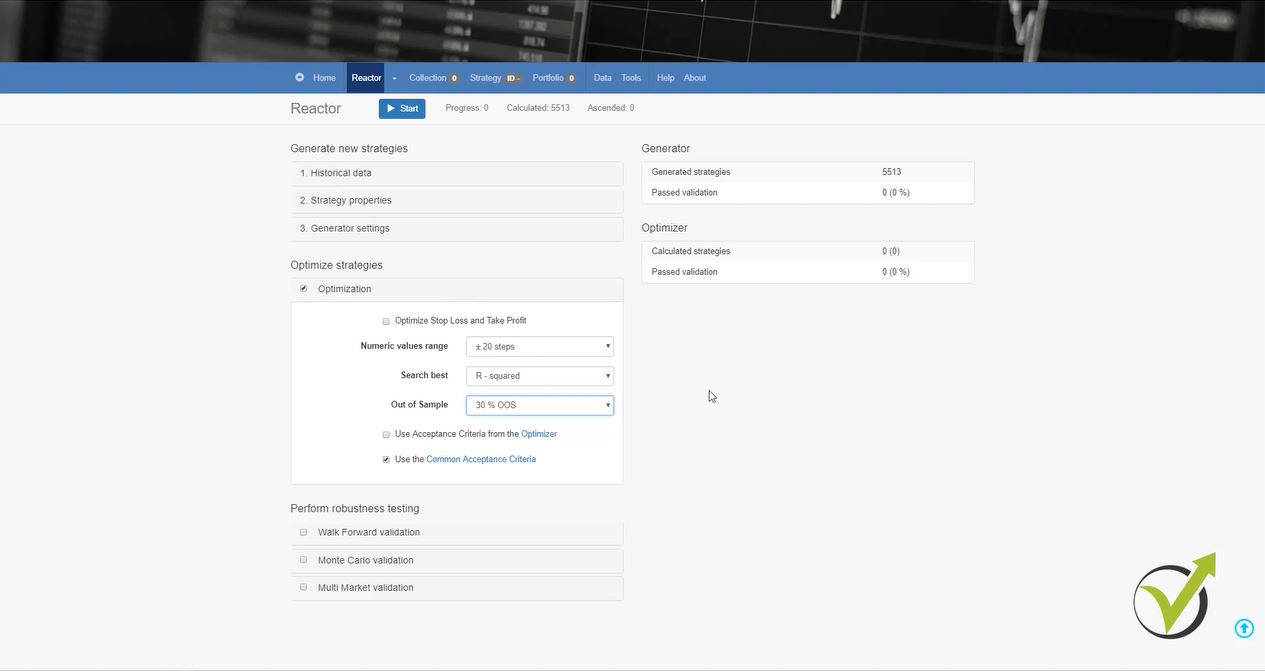
    In the Academy, we use the most EA Studio, which is a fast and reliable online software for creating and testing MetaTrader Expert Advisors. With EA Studio I can create my trading strategy and export it with one click as an Expert Advisor for MT4 or MT5.

    Exporting the strategy as an Expert Advisor

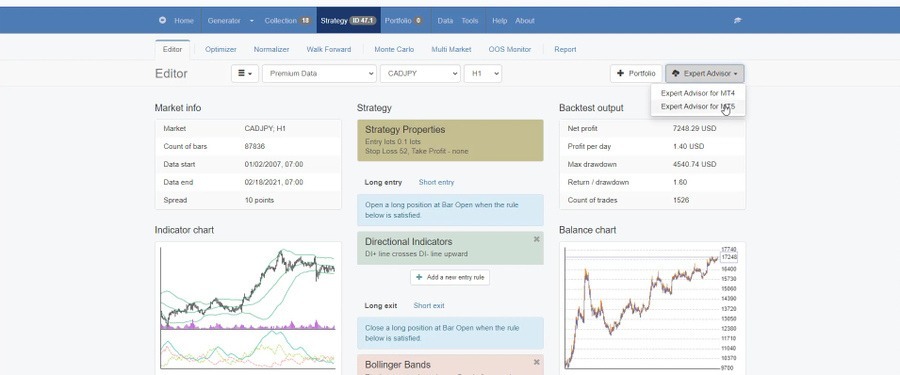
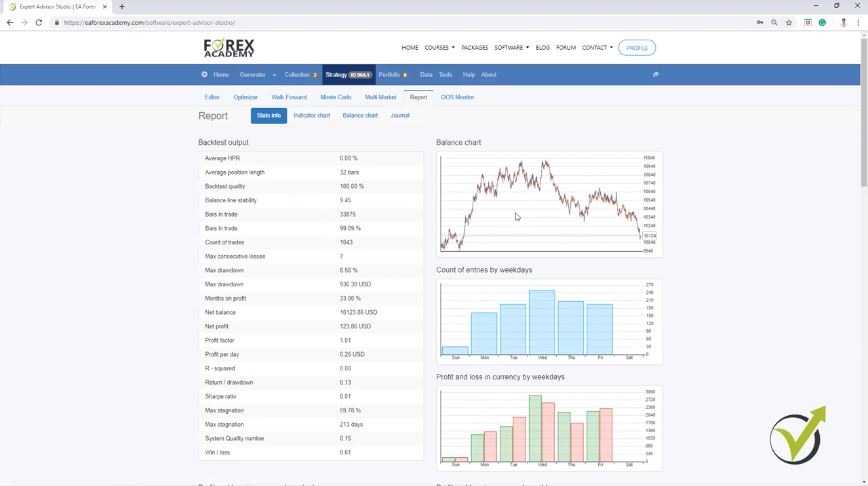
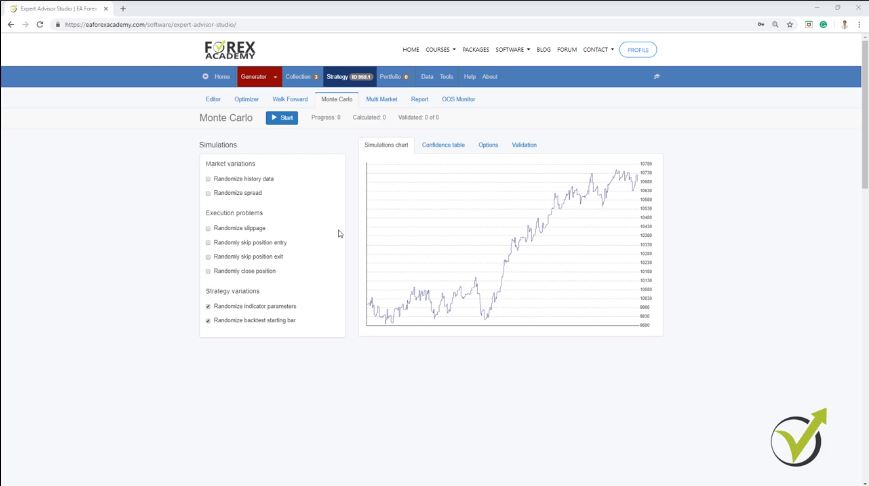
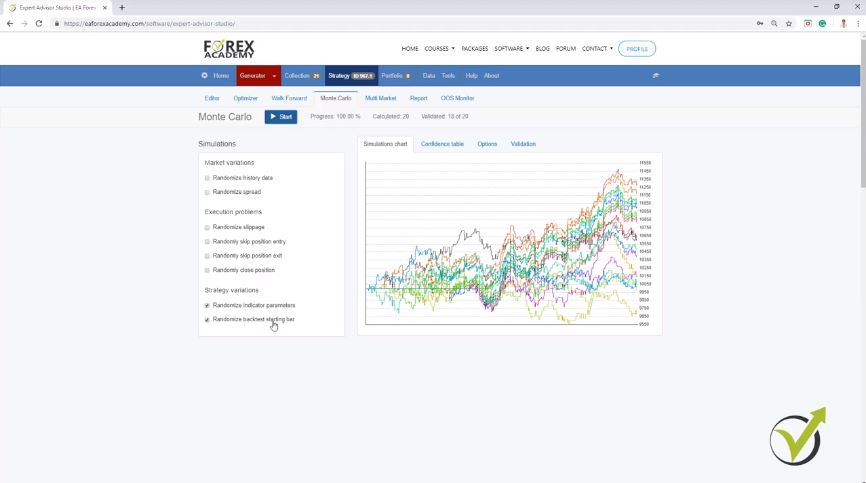
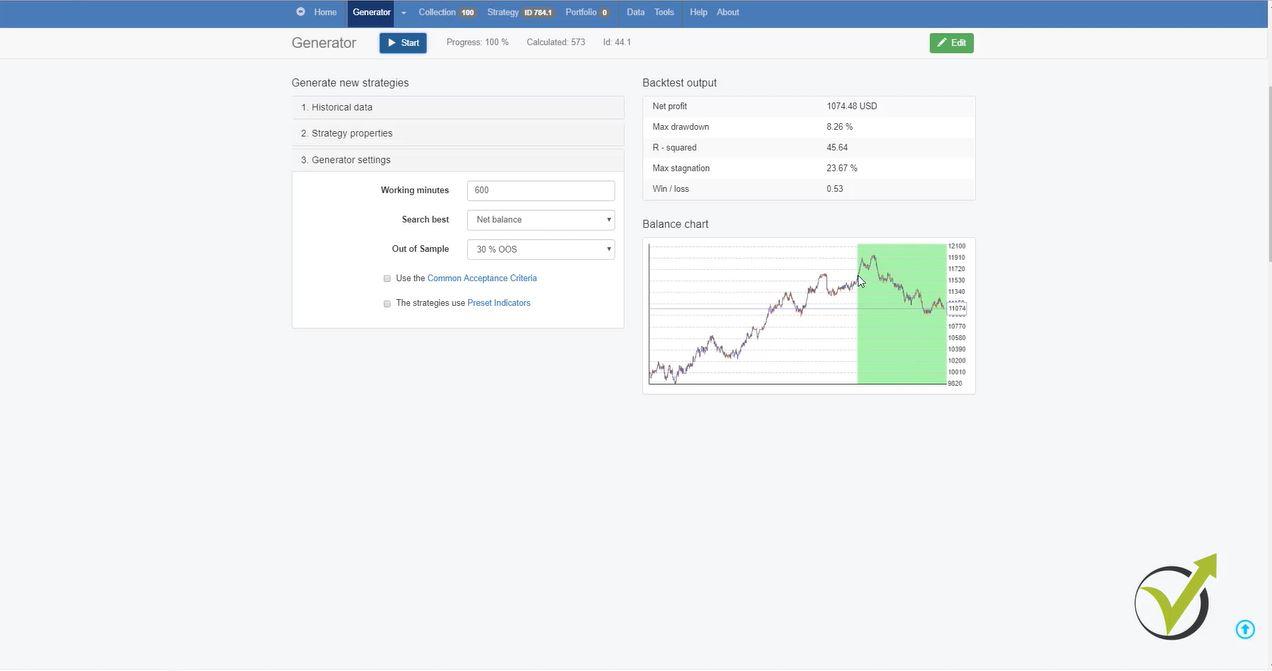
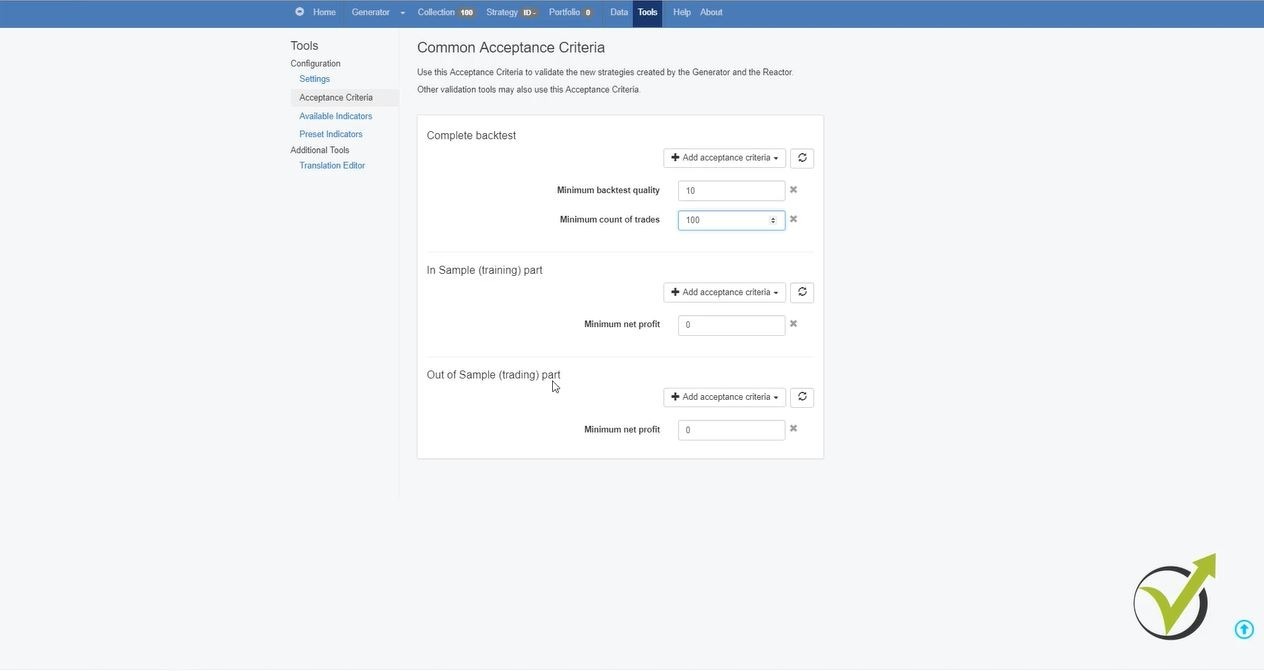
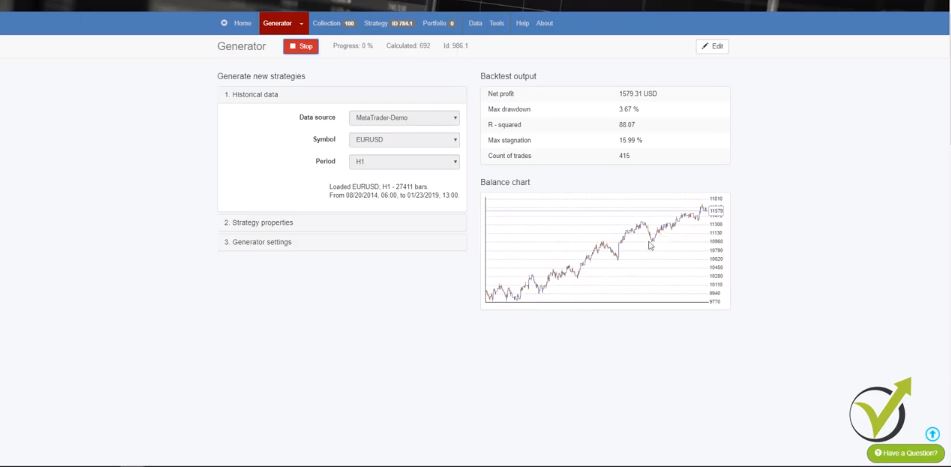
    More, there is the option to generate strategies, which is pretty cool. So I set predefined rules and then I just generate the strategies.

    The generator

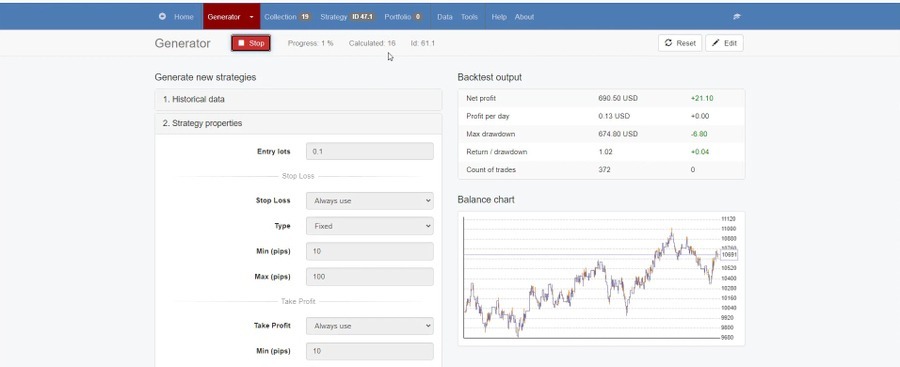
    The software will show me the trading rules, indicators, Stop Loss, Take Profit, and everything that predefines a strategy to open and close trades automatically. So I don’t need to do anything manually.

    Should you buy a MetaTrader Expert Advisor?

    MetaTrader Expert Advisors are very popular on the market, and there are hundreds of websites from where you can buy an Expert Advisor. I personally have tried many and I can tell you that 99% of them are really crap. It is super hard to find a profitable strategy because the person that has created it has to take care of it, has to update it, has to share results so you will know it’s reliable.

    Look for reviews for the MetaTrader Expert Advisor that you are planning to buy before you actually buy it. As well, be sure that the money-back guarantee features among these websites. We offer it as well on our website so anyone who is not happy with the results of the MetaTrader Expert Advisors, can always refund it. That’s the right way to go nowadays and not just to spend money for something and then you cannot get your money back.

    Everyone has different expectations, everyone is looking for different things. So make sure to read reviews before you buy any MetaTrader Expert Advisor, this way you will know what the others experienced and if that meets your expectations or not.

    Backtesting MetaTrader Expert Advisor robustness

    MetaTrader Expert Advisor is the way to trade automatically and avoid emotions while trading. Now, I will show you how to test the robustness of every МetaTrader Expert Advisor. This is very important, especially when you buy an Еxpert Аdvisor from the market. People sell Expert Advisors with over-optimized equity Lines. I will tell you what this means in the next rows, and I will show you how to backtest an Expert Advisor for MT4 or MT5.

    Basically, when we are doing a backtest, we see the result for a trading strategy in the past for some period of time. We are testing this strategy for some period of time and we see a backtest.

    Now, if you see a very nice backtest, this doesn’t mean that the strategy will continue profitably in the future.  So we want to find the strategies that are robust, that show backtests with nice results but with chances to continue trading profitably in the future. I will show you how to avoid over-optimization with a MetaTrader Expert Advisor later in this article.

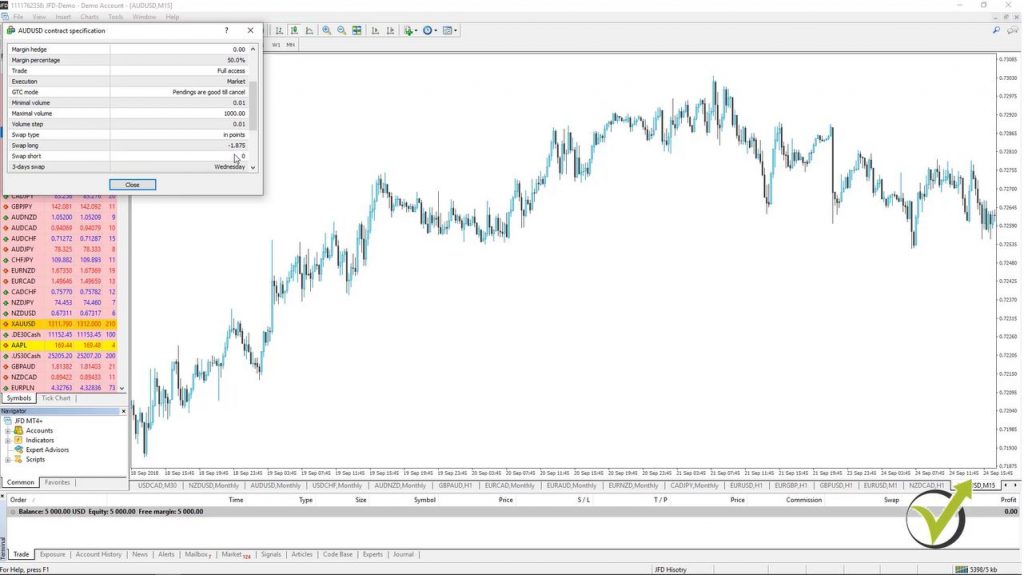
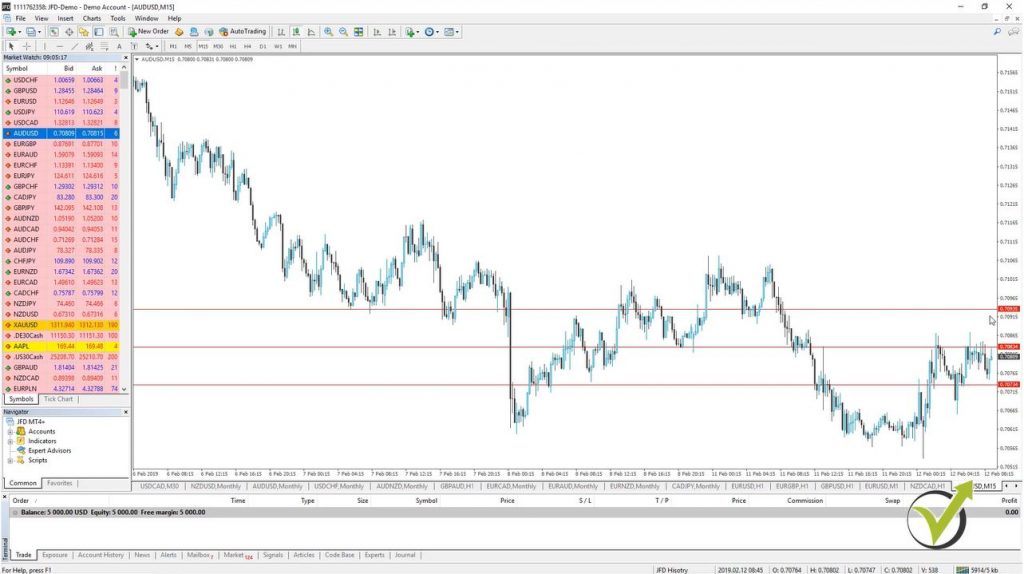
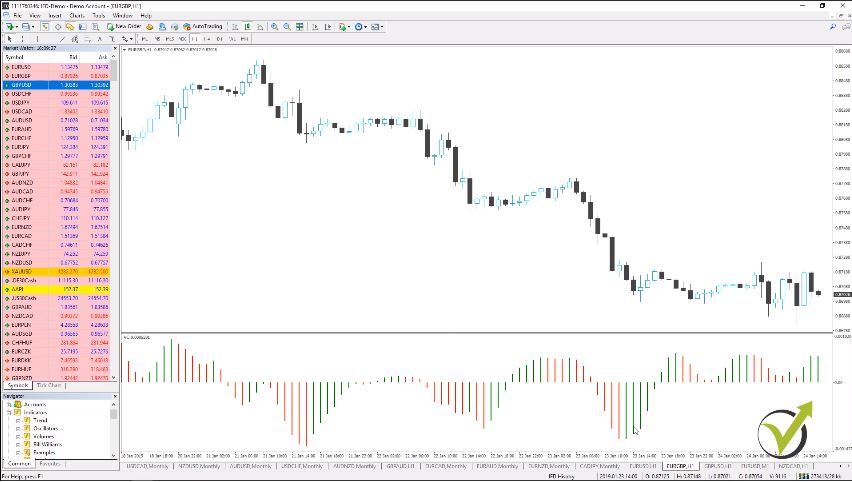
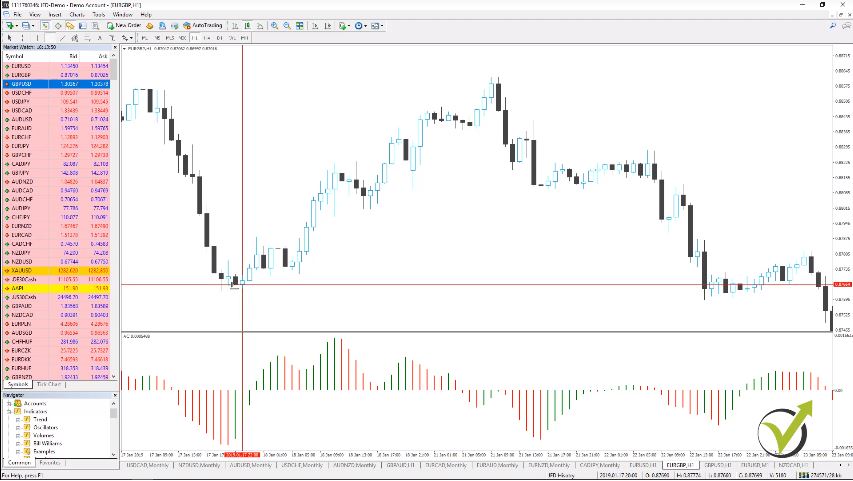
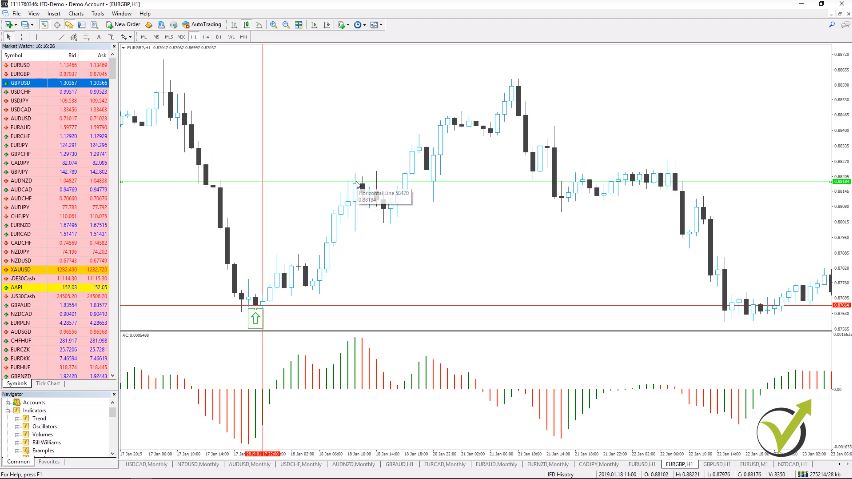
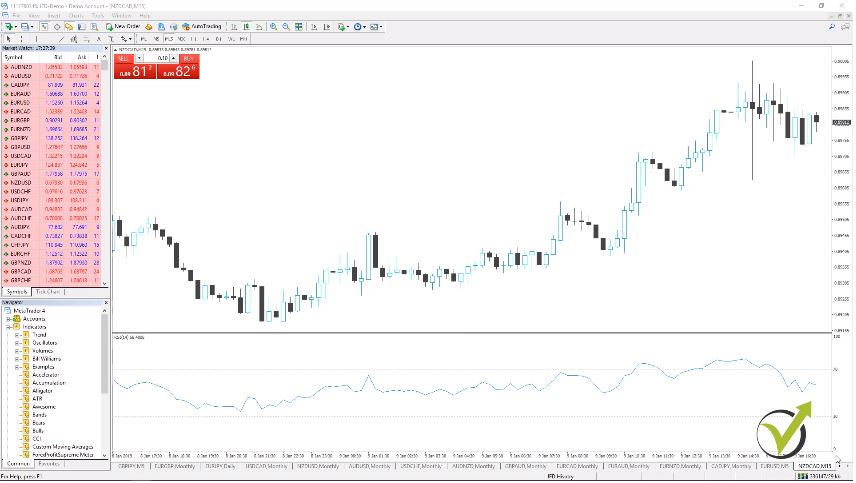
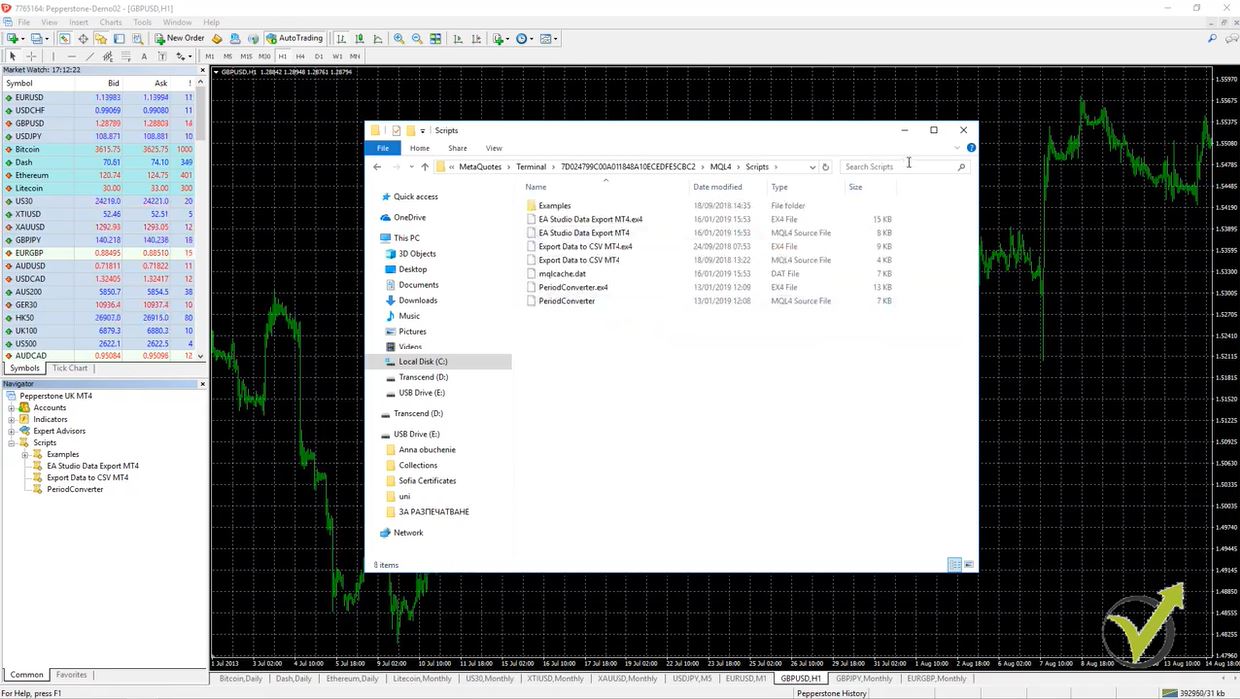
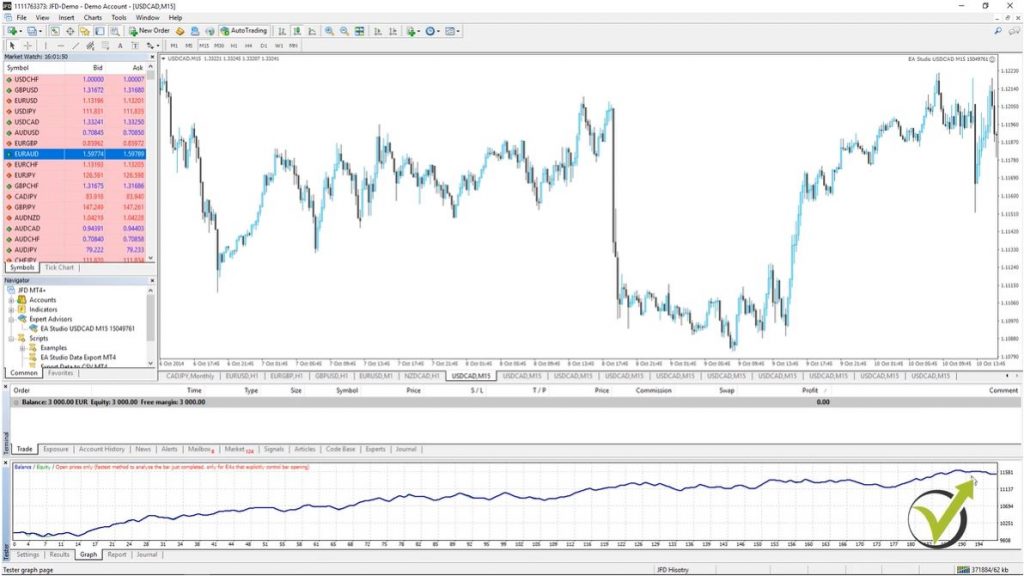
    Now, let me put a MetaTrader Expert Advisor back on the chart. I will drag it over the chart in MetaTrader, and I will click on OK and here it is.  So I have the MetaTrader Expert Advisor over the chart and I want to backtest it. I will right-click and I will go to Expert Advisors and I will go to Strategy Tester.

    Metatrader Expert Advisor options
    Input menu for the EA

    You will see the window that pops up below. And what we have here, we have this MetaTrader Expert Advisor, this currency pair. As a Model, I will use Open prices only because the Expert Advisors that I’m using and those that I will include in the Algorithmic Trading Strategies + USDCAD EAs course, as we said, are using the opening of the bar.

    What means Open prices only when backtesting MetaTrader Expert Advisor?

    • the Backtester will execute the trades on the opening of each bar
    • the closing price of the previous bar is very close but not the same
    • this method is most reliable when using EA Studio strategy builder
    • the brokers do not provide tick data, that is why it is good to use Open prices

    This is the moment when they check if the entry conditions are there.

    And what we will do in this example is to use the data from the 1st of January last year until the 4th of March this year.  So we’ll be testing it for one year and three months. Alright? It is on M15.  We will use the current spread that we have at the market for the moment.

    So I will click on Start and you will see how quick was the MetaTrader backtest. This is because the code of the MetaTrader Experts Advisor is really good, nothing complicated or nothing unnecessary there. That’s why it works extremely fast with the MetaTrader platform.

    You can see all opened and closed trades for any period.

    And if I go to the results you will see all trades that were open and closed. You can see this is the 2nd day, in the first, there was a sale, then we have another sale, sale. And here is the result and the balance and you can see all the trades that were opened with this strategy for the last 1 year and 3 months.

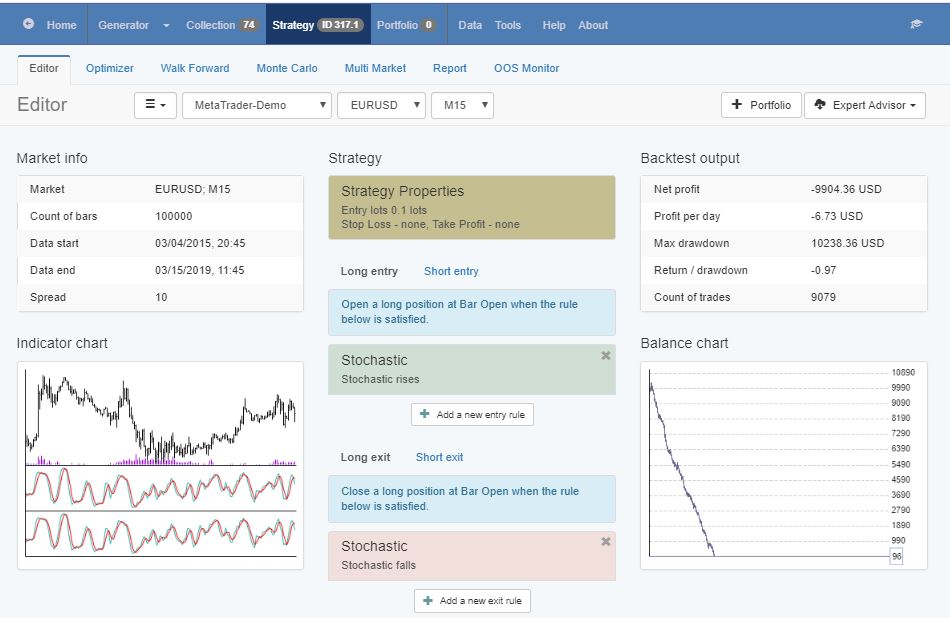
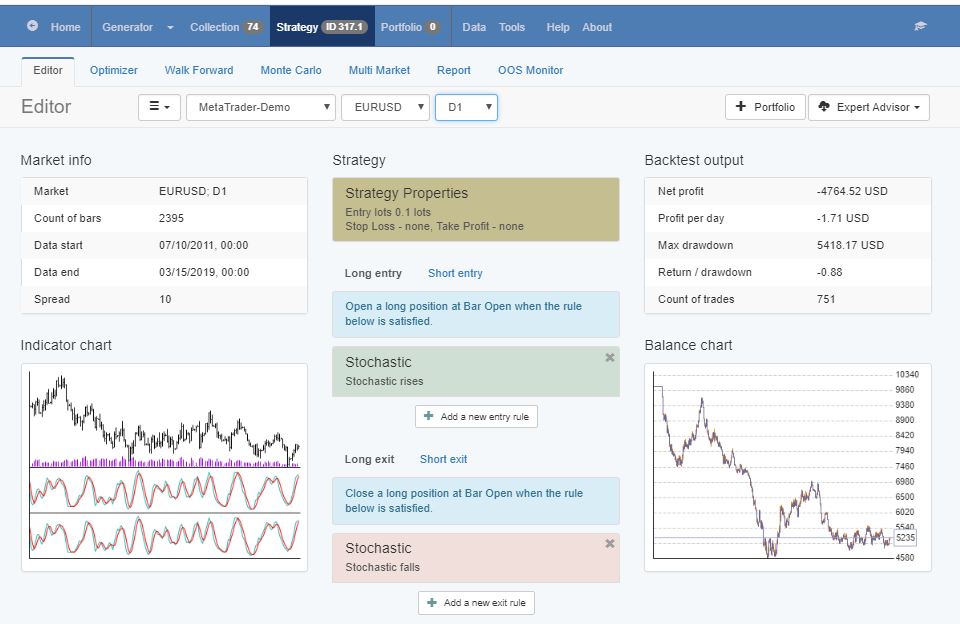
    Actually 2 months, because we are at the beginning of March.  So 1 year and 2 months, we can say, it’s a 14 month period. If I go to the graph, you will see we have this normal graph, we can say, for a MetaTrader Expert Advisor.

    Strategy results
    Backtest result with a Metatrader Expert Advisor

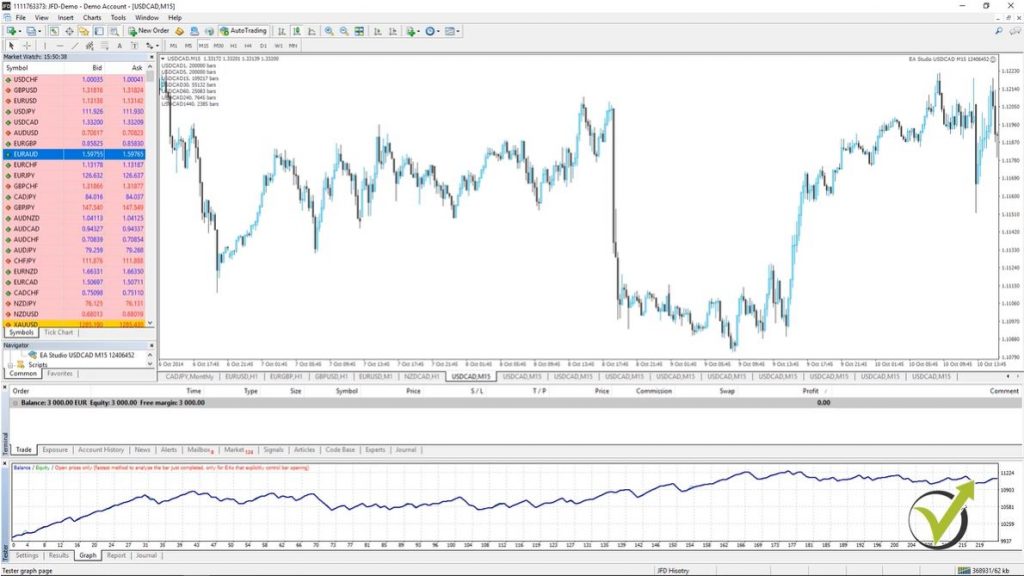
    It goes up and down. There are some drawdowns but not huge ones. There is some stagnation of course. But finally, we are on a profit.

    And now when we are talking about over optimization, this is what exactly we don’t want to see. One straight line which will show you only profit, profit, profit, profit, and nearly without any losses. And these are the Expert Advisors we want to avoid, where we have the perfect parameters for the strategy to show you this great backtest.

    What stagnation of the equity line means with a MetaTrader Expert Advisor?

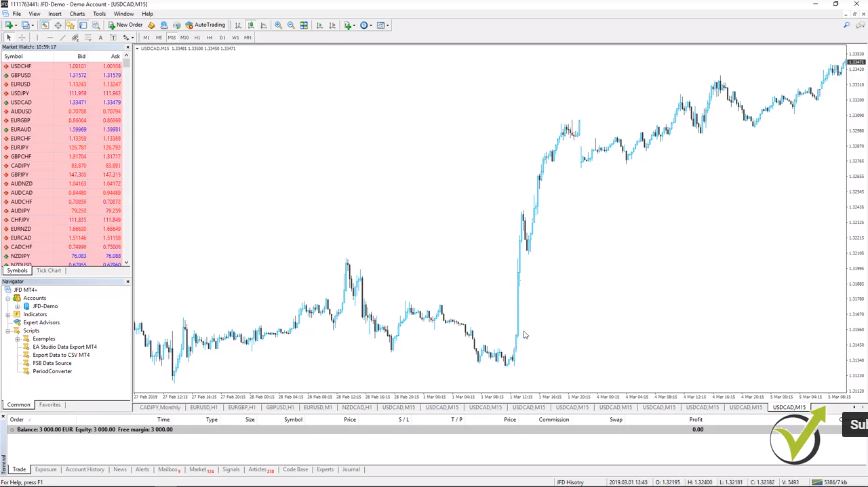
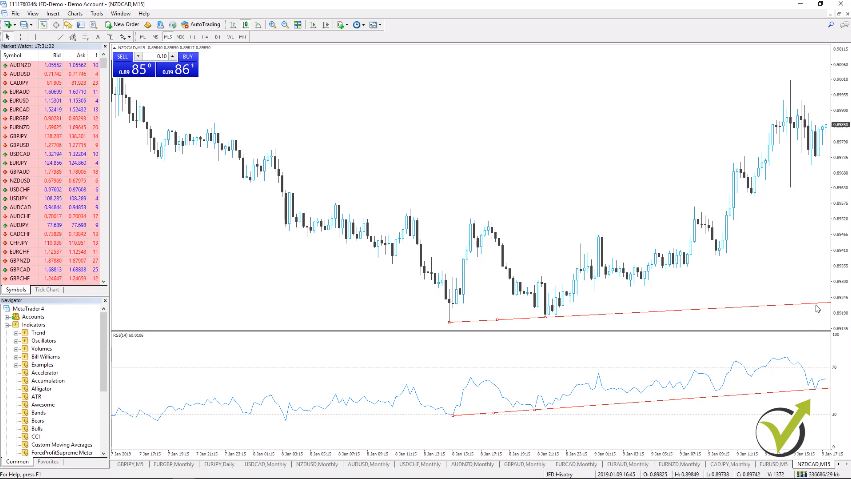
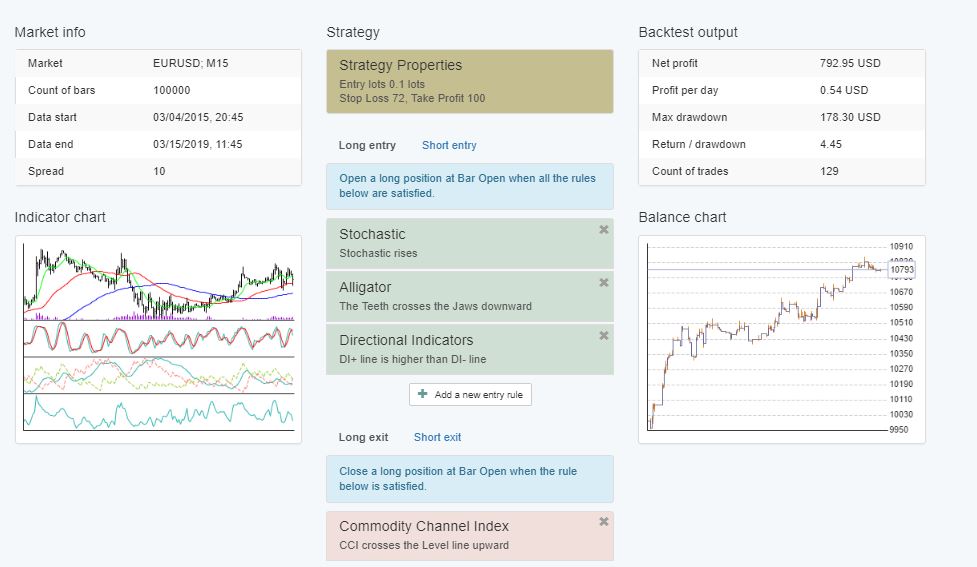
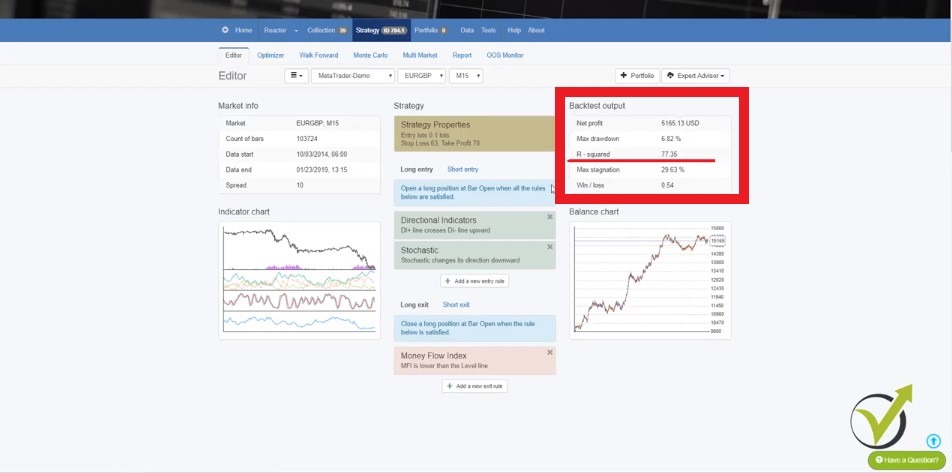
    I want to see in my trading, Expert Advisors that are having this curve line where we have up and down, up and down, but it goes up. Now I have selected here just a random, normal Metatrader Expert Advisor for the USDCAD where the equity line goals in a profit, goes down. You see there is a huge period here in stagnation.

    What the stagnation means is for a long time the price didn’t succeed to reach a better profit than the previous point. So, for example, here it reached this point and you can see after that for a long time until here it did not make a better profit than this moment over here. So this whole thing is called stagnation.

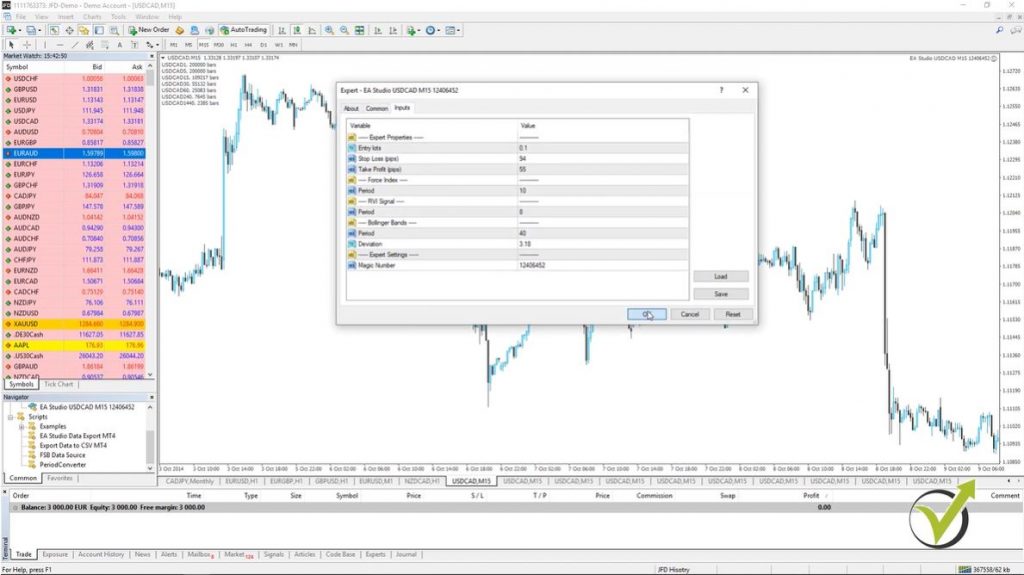
    But I just took this MetaTrader Expert Advisor really randomly to show you how you can check the robustness with the Expert Advisor. So here are the settings of this Expert Advisor, and finally, the result, what we have is 11,105. This is starting with $10,000 of account.

    You see if I go to export properties it is testing with $10,000 of account.  Here are the inputs. Now one of the oldest methods, I can say, in testing robustness with Expert Advisors is to change some of the values and see if the result will stay similar or not.

    What changing the parameters will do to the MetaTrader Expert Advisor.

    For example, here we have a Stop Loss of 94 pips and Take Profit of 55 pips. Now let’s make this Stop Loss 4 pips lower.

    Metatrader Expert Advisor backtester
    Backtester properties in MT

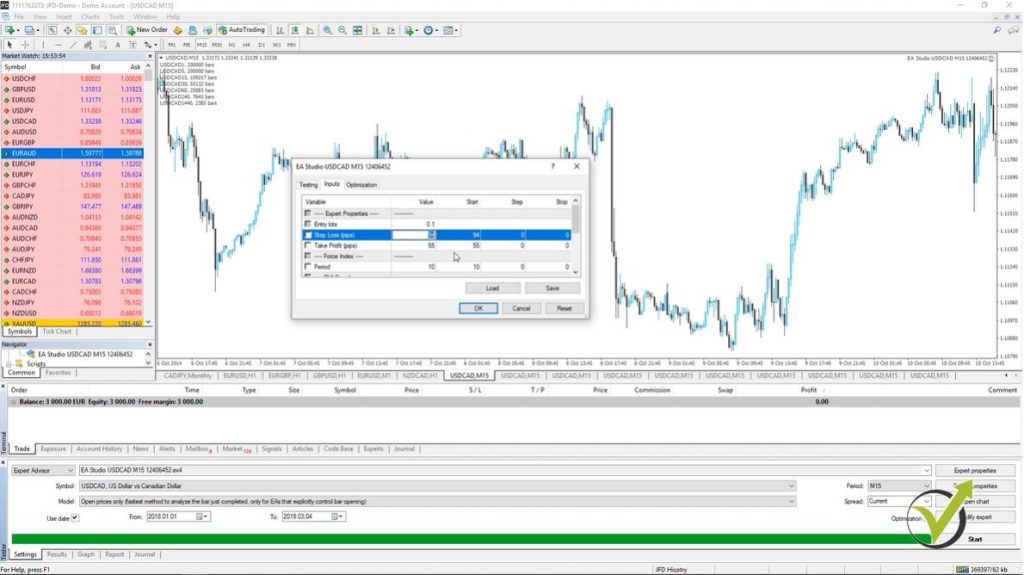
    I will do it 90 and I will click on OK. Alright? Now I will click on Start again and I will see what the result is.

    You see the line is pretty much the same. What we have actually is a better result. You see I have 11,201. Alright? So this means that with this Stop Loss the strategy was even a little bit better.

    But what it means actually for me is that the strategy is not over-optimized. Changing a parameter didn’t change crucially the strategy. Now let’s change the Take Profit as well.

    I will do it Take Profit of 60 instead of 55. I will click on OK and I will do the backtest again. You see the graph, it’s pretty much similar. Here you can notice that the stagnation is a little bit bigger I think, a little bit more of a drawdown here.

    What is an over-optimized strategy?

    • Metatrader Expert Advisor that was fit to the past Historical data
    • The parameters of the indicators are optimized for the tested period
    • There is a huge chance that this strategy will fail in the future
    • Robustness testing is a must to avoid trading with over-optimized strategies

    And the results, what we have is 10,895. So now it is getting actually worse when I changed this parameter. But one more time it didn’t change crucially, I’m having very same equity line.

    And what would be an over-optimized strategy is when we change some of the parameters and we see a totally different result. And I will show you such a strategy right now.  Let me remove this one from the chart.

    Right-click, Expert Advisors, I go to Remove and then I will drop another strategy and the Meta Trader. I will go to File open, Data folder, MQL4 and I will go to Experts and let me delete this one so I don’t make a mistake which one I’m backtesting.  Here it is, I will double-click on it and I will compile it.

    One more time you can compile it from the folder on the Navigator from right over here. If I just click right mouse and refresh, this will still compile the Metatrader Expert Advisor.  I will drop it over the chart and here are the parameters
    for this strategy.

    Chart attachment.

    I will click on OK and you see it is attached on the chart. Now I can change the Expert Advisor from here but actually, I deleted the old one, so I have only this one. Anyway, if you do it for the first time, one more time you go to Expert Advisors and you click on Strategy Tester and it will be the one that is attached on the chart.

    So you see if I click on Start, I will have the equity line which is pretty nice. Actually even better than the previous strategy. But if I go to Settings and I go to Expert properties and I go to Inputs, let’s say I will change here some of the parameters of the indicators.

    For example, RVI is 40. I will change it to 45. Actually, let me see first what the result was exactly with the backtest. So the graph is good, the result is 11,519. Alright? Let me write it down on my next screen, 11,519.

    I will go to Settings and I will change some of the parameters, for example, RVI, I will change it to 35 and I will click on OK and I will perform the backtest. I will go to the graph and you can see what a different graph I have. Still positive, what we have as a result is here, it’s 10,372.

    The Backtest of a MetaTrader Expert Advisor.

    So you see the difference, it was 11,519 now it’s 10,372.  Let me change some other parameters. So here it was 40, let’s increase it, let’s make it 45 instead of 5 lower.

    I will go to 5 higher and I will click on OK, I will click on Start and I will go to the results graph. Now you can see what I’m talking about. I see a negative equity line. Just a change in one of the parameters and what we have as a balance is 9,462.

    So this shows me that this strategy was over-optimized.  These properties that I had, exactly with the 40, exactly the Stop Loss and Take Profit exactly with the other parameters, it was over-optimized. So when I click on Start and I do the backtest I see a very nice equity line.

    Equity line of the Backtester is better
    Much better Equity line

    But this is because these parameters for these indicators were fit to this testing period. And we cannot depend that this strategy will perform well in the future. Maybe it will.  There is a chance that it will, but most probably it will fail.

    The indicators were set to show a good equity line with the MetaTrader Expert Advisor.

    Because the indicators, the parameters’ indicators were set in such a way so it will show me a good equity line during this test period with these parameters. Exactly with these parameters and one more time let me change something else to demonstrate it once again. For example, I will change the average true range from 47 to 50.  Very close number.

    I will click on OK, I will click on start and I will go to the graph. You can see it’s losing again.  So this is one of the best ways in Meta Trader that you can check if your Expert Advisor is over-optimized, no matter whether you buy it from the market, you take it from somewhere, it is always good to perform a few backtests with different parameters to make sure that you are not going to trade with over-optimized strategy.

    With a strategy that was fit to this trading period that you’re testing, or it could be actually for the last 10 years, or even for the 20 years it doesn’t matter, it could be any period. I just selected the last one here from 2018 till now. Alright, guys? This is how you can check if your strategy was over-optimized with Meta Trader.

    Just change in the Expert properties some parameters. Not too much, as you saw just with 2, 3 points or 5 points up and down and if you see a dramatic change in the equity line this will show you that probably this strategy is over-optimized.

    Conclusion about MetaTrader Expert Advisors

    So this is the most important information you need to know about MetaTrader Expert Advisors. These are automated trading robots for one of the most popular trading platforms, MT4 and MT5. And most of the regulated brokers offer these platforms. Of course, don’t forget to use a regulated broker when you start trading, this is very important so you won’t lose your money.

    Thank you very much for reading this lecture. If you enjoyed it take a look at the Algorithmic trading strategies Top 10 USDCAD EAs course where we share more tips and tricks about trading with MetaTrader Expert Advisors.

    If you have any question, feel free to drop them in our Forum and I will make sure to answer as soon as possible. Also, in the Forum you will meet fellow traders which will share their experience with you. This a great place where traders exchange ideas, test MetaTrader Expert Advisors together, and benefit from each other’s experience. The Forum is free to access and everyone with a registration on our website can access it, and write questions. Everybody is welcome to join!

    Enter your email address below to receive a free MT4 & MT5 automated trading robot.

    * indicates required
  • Forex MetaTrader 4 – introduction for the newbie traders

    Forex MetaTrader 4 – introduction for the newbie traders

    Forex Metatrader 4 – the most suitable platform for algorithmic trading

    Forex Metatrader 4 is the platform that allows manual and algorithmic trading. Hello, dear traders, My name is Petko Aleksandrov and in this lecture, I will talk about the most common platform for Forex trading. Basically, I will do a brief presentation on the Forex MetaTrader platform for beginner traders. So if you are an advanced trader with MetaTrader, if you have watched some of my courses already for MetaTrader, you can basically skip this article because I will make a brief introduction for the newbie traders about Forex MetaTrader 4. And this is one of the most common platforms for trading.

    Download the free MetaTrader 4 PDF guide

    It is suitable for algorithmic trading, which makes it a favorite of mine and to many traders. Most of the brokers provide this platform. So if you choose a broker, you need to look if the broker provides the Forex Meta Trader 4 platform. This is where you will be able to place the Expert Advisors that I will provide you with, in this course. OK?

    These 10 Expert Advisors for the Australian dollar versus the American dollar will be working on Meta Trader. I will provide it for Forex Metatrader 4 and for Meta Trader 5. Now I will use a virtual Demo account during the course. I don’t want to push anybody or I don’t want anybody to feel like trading on a live account. OK? We need always to practice every system on a Demo account. I want you to learn to practice every system on a Demo account.

    I will do a demonstration on a virtual Demo account.

    You can open such an account with every broker that provides Forex Meta Trader 4. So if you look at my screen you will see how Meta Trader looks. If you have watched some of my previous courses you will know that I prefer to use the white background for the Meta Trader.

    Forex Metatrader 4
    The trading platform MT4.

    And basically, this is the platform where I record most of my courses. Now what we have is the chart in the middle. You can switch the different time frames from right over here and you can go to M15, M30, H1 or whatever time frame you are looking for.

    Below the chart, we have the different currency pairs that we have open. So this I have opened manually for different reasons and I can switch between them. And these are some currency pairs for a previous course that I have launched here.

    You can open any new currency pair as a chart in Forex Metatrader 4.

    And then I have some analysis before that and so on. So below the chart are the currency pairs that you want to look at more frequently I can say, and if you want to open any new currency pair as a chart, you just need to click over it. Right mouse, and then go to the chart window and it will open.

    Normally, it will come with some indicators, this is set from the broker itself. What you can do to remove the indicators is right-click over the chart and go to indicators list and then you can remove the indicators from right over here. Just click over them and click on delete.

    Now using Expert Advisors, we really don’t need to have any indicators over the chart. Yes, the Expert Advisors are using indicators but they are inside the code of the Expert Advisors which I will show you later on in the course. So here is the chart, below are the different currency pairs that you want to look at more frequently.

    Actually, if you have 5, 6, 10 and you want to look at them at the same time, what you can do is right click and then go to tile windows and you will see what happened. They will all open because I have too many over here, it’s not really visual. So I prefer normally to keep it on the whole chart. OK?

    You can view in Forex Metatrader 4 all the assets provided by your broker.

    Now on the market watch are the different assets and normally when you install the Forex Metatrader 4 you will not see all of the assets that are provided by your broker. What you need to do is right-click and go to “show all.” OK? This will make the market watch complete and you will see all trading assets that are provided by your broker.

    On the top you will see the currency pairs then you will see some stocks, indexes, cryptocurrencies if your broker provides gold, oil. And you can see there are some cryptocurrencies right over here and we have the oil above those. So what we are focusing on in this course is the Australian dollar versus the American dollar.

    Now what we have more in the market watch, is we have the bid price and the Ask price. When we buy on the market, we are buying on the Ask price. If you look carefully, you will see that the Ask price is a bit more expensive than the Bid price.

    And the difference between the Ask and the Bid is called the spread. OK? This is what the broker benefits when we are trading. No matter manually, algorithmically, we always pay the spread to the broker.

    You can view the spread at any moment.

    And if you want to see exactly at each moment what is the spread, you can right-click and go to “spread.” It will appear as a third column over here and you see that for this currency pair at the moment, it is about 6 points. OK? Normally we have floating spread with most of the brokers.

    It means it is changing, it is not fixed. Depends on many things, on the volatility, but most of all it depends on the broker itself. And one more time here for the very newbie traders, we buy on the Ask price and we sell on the Bid price.

    right click over any asset
    Spread with Forex Metatrader 4

    That’s why when you open any position you will see immediately a small loss as a profit because if we immediately close it this will be on the bid price. OK? So always when we open a trade we start with a very small negative result and this is because of the spread. However, this spread is very small compared to exchanging currencies in the bank or at the Exchange Bureau.

    As you know, the difference between the Buy and the Sell price, we can say is quite higher. Alright? And below the market watch, we have the navigator. Normally, I say this is what makes the Forex Metatrader 4 a different platform from all web-based platforms because here we can place custom indicators, we can place Expert Advisors (what I will show you in this course) and we can place different scripts.

    How to place the indicators, Expert Advisors and scripts is similar.

    The way we place them is very similar for indicators, Expert Advisors, and scripts. Go to “file” and then we go to “open data folder” and here are the locations of these tools. We have MQL4 and then here we have the experts, the indicators, and the scripts.

    We just paste them over here and then when we refresh with the right mouse they will appear listed below. But I will show you that as well later on when I place the Expert Advisors in the Forex MetaTrader 4. OK? Below we have the terminal where we see the initial balance of the account and when we open trades we will have the time of opening, what type is it, is it a buy, is it a sell, what is the size…this is the trading lot.

    So again for the very newbie traders, the lot is the quantity that we are trading. When some of the brokers, where we have web-based platforms, we trade the currency pairs as an amount. So, for example, we can trade there 1,000 AUDUSD but here it would be 0.01 lot. OK?

    One complete lot is equivalent to 100,000.

    And if I right-click actually on the asset and I go to “specification” you will see some details but what you see here is contract size, 100,000. So one complete lot equals to 100,000. OK? 0.1 would equal to 10,000 and 0.01, which normally is the minimum quantity allowed by most of the brokers, is 1,000.

    And here it is actually, minimum volume. OK? Here in the specification, you can see what is the currency pair, what is the contract size, what margin percentage you have, the minimum volume, the maximum volume and we have swap long and swap short which I will just explain. And just continue, in the terminal we have the symbol which will show over here.

    What was the price when the trade was opened, what is the Stop Loss level and the Take Profit level and then what is the price at the moment, commission swap and the profit at the current moment…OK? So what I said I will explain is the swap. This is the charge fee from the broker when we are holding positions overnight. OK?

    Forex Metatrader 4 swap settings
    Follow the swaps if you trade in a longer-term.

    If I open one trade today, let’s say I buy right now Australian versus the American dollar and I close this position tomorrow, no matter is it on profit is it on loss, I will pay the swap if the broker has a negative swap. Sometimes for some currency pairs, you can see positive swaps. So basically they will give you some profit to your account.

    When swap short is zero, Forex Metatrader 4 won’t charge you anything.

    Now let’s have a look one more time, what are the swaps over here? I will go to “specification” and you can see that actually for swap short is zero. This means that it will not charge me anything if I am keeping short positions overnight if I sell the Australian dollar versus the American dollar currency pair. OK?

    Swap long is negative. This means that if I keep a long position overnight, I will be charged with some negative swap. With the regulated brokers, it is very small and the swap affects the trading when you are keeping your positions a long time like weeks and months.

    In Algo trading, we don’t keep our positions so long so the swap is not really an issue for us. OK? And just because I have mentioned long and short, we say we’re in a long position when we buy and we are in a short position when we sell. Just a tip for the very newbie traders if this is not clear.

    Now some of the brokers have commissions. This is for all trades open. No matter whether they are short, they’re long, you keep them overnight or not, if your broker has a commission it will charge you every time you open a trade.

    If the price reaches the Take Profit level, the Forex Metatrader 4 takes the profit automatically.

    And finally, here is the Stop Loss and the Take Profit, for the very newbie traders I will put some horizontal lines very quickly. For example, if I sell at 170.83 I can place a Take Profit at 170.73, for example. OK? Just 10 pips lower and if the price reaches this level, it will take me the profit automatically. OK? The trade will be closed automatically.

    drawing tools
    Support and resistance.

    And at the same time, I can place Stop Loss somewhere above 170.93, for example, so if the price reaches this level it will close the trade again automatically because I have placed there the Stop Loss. So this is just a very basic explanation for the Stop Loss and the Take Profit. It really depends on what your strategy in trading is, where you should place your Stop Loss and Take Profit…but you will see in the next lectures that with Algo trading, we know where to place the Stop Loss and the Take Profit based on statistical results and backtesting for the strategy. OK? Something that is absolutely impossible with manual trading. Alright, guys?

    And here what we have is the balance and equity and the free margin. So when we are trading with leverage, as you know, we can trade with more money from what we have into the account.

    Of course, there is a limitation, depending on how much your leverage is with the broker. But here, when you open trades you will see what is your balance, your equity, the margin used, and the free margin. So if you open, for example, one trade with a 0.1 lot you will see how much is blocked from your balance and how much is the free margin.

    Do not open positions with all the money in your Forex MetaTrader 4 account.

    So means how much more money you have to trade with. Of course, we never open positions with all of the money that we have in our accounts. This is a huge mistake that many new traders do because they want to profit very quickly.

    And when we’re doing algorithmic trading, basically we are risking no more than 2%, 2 to 5% maximum from our trading account.

    Forex Metatrader 4 account
    Risk management in Forex trading.

    And you will see later in the course when I have trades opened from the Expert Advisors, how much it will be blocked from the account. Alright, guys? So this is the Forex Metatrader 4 platform in a couple of words, very quickly just to have an idea how to use it.

    Anyway if you’re just starting using the Meta Trader, it will be really easy for you to place the Expert Advisors and to attach them to the chart because I will show it step-by-step. And we really don’t need to know anything more about the MetaTrader when we are training with Expert Advisors. It is very easy and you will get used to it quickly.

    As I said at the beginning of the lecture, I have a complete course dedicated to MetaTrader if you’re interested really to learn it in detail and to feel more comfortable using the Forex MetaTrader 4.  But for now, for the purpose of this course, this introductory lecture to Meta Trader will be just enough for all newbie traders who are reading the course. You will see along the course how I will place the Expert Advisors for trading.

    Thank you very much for reading and I will continue with the next lecture.

  • Forex Algo Software robustness testing in 2019

    Forex Algo Software robustness testing in 2019

    Forex Algo Software – the new tool in 21 century for algorithmic trading.

    Forex Algo software allows the traders to test the robustness of the strategies before actual trading. The problem with Meta Trader is that you can test the robustness of a strategy after you have it. After you have bought the Expert Advisor, after you have paid the developer to do it or after you have spent a couple of weeks to code it by yourself.

    And just then you can do the backtest and to check the robustness. Now when we have Forex Algo software, we test the robustness before we have the Expert Advisor, just when we have the strategy, the idea of the strategy. And we can see if it is worth to do it as an Expert Advisor.

    And actually, with the Forex Algo Software, it is very easy to have it as an Expert Advisor because we don’t need to have any programming skills or any trading experience even. With one click we can export it as an Expert Advisor and I will show you how to do that. Alright? Now when we have Forex Algo Sofware, we have different robustness tools that we will use.

    What are the robustness tools in Forex Algo Software?

    • Walk Forward
    • Monte Carlo
    • Multi Markets.

    These 3 are different tools to validate your strategies and to check if they are over optimized or not. Now on our website, we have 2 pieces of Forex Algo Software: one is EA studio or Expert Advisor Studio, the other one is Forex Strategy Builder.

    Now, Forex Strategy Builder needs to be installed on the computer. It’s a little bit of a heavier program, takes a little bit longer time to get used with it. I can say these two are just different software.

    I get the question all the time, “What is the difference between these two?” They simply create different Expert Advisors and they have some different features inside. But the idea is one and the same with both.

    The Algo trading software Expert Advisor Studio offers 15 days free trial.

    We are building strategies, Expert Advisors, we export the strategies as Expert Advisors with one click so no programming skills are needed and no trading experience is needed. You can generate strategies based on the historical data, which I will show you how to place in the Forex Algo Software. Now Expert Advisor Studio comes with 15 days free trial which you can use and during this time you can export or generate as many Expert Advisors as you wish.

    There are no limitations here. I will click on “Login” just to use it and I will just demonstrate to you how I will use this Forex Algo Software to test the robustness for the strategies. So if I click on “strategy,” you can see that I have the possibility to put entry conditions and to put exit conditions.

    So if you have a manual strategy that you are trading and you want to use it with Expert Advisor, you can build your strategy here. Now I will demonstrate it to you very quickly. Let me take randomly some indicators, for example, I have many indicators here but let’s pick some random money flow index.

    For example, there are different conditions, money flow index rises, falls, is higher than the level line, is lower than the level line. Let’s take money flow index falls. And I will click on “accept” and you will see that immediately I have a dramatic loss.

    You see the backtest result immediately you add an indicator to the strategy.


    Forex algo software
    The Backtest.


    So basically here is the backtest. OK? For this period that we have, from October 2017 till today the 5th of March, 2019? So whatever indicator I place or add to the strategy, I will see immediately the backtest result or the balance chart.

    Now let me place some exit condition as well and I will take, for example here, some of the indicators that I like the most. I will take the envelopes and here is the rule we have the bar opens above the upper band, the bar opens below the lower band, the bar opens below upper band after opening above it…let’s click on some of it randomly.

    When I click on “accept” and actually here you see I have a profitable strategy. I took these indicators really randomly. Just from my experience, I know which indicators are good entry and exit condition.

    Any indicator change you make will be seen immediately on the balance sheet.

    I didn’t place even a Stop Loss and Take Profit and you can see this strategy is on profit. Even if there was a huge Drawdown, still this strategy is on profit. And now what is the thing here guys, that whatever change I make in the indicators, I will see the effect immediately on the balance chart.

    This way the Forex Algo Software saves a lot of time for Demo testing on Meta Trader with the different parameters.

    So let me, for example, change the rule, the bar opens above the upper band and I will click on “accept.” And here I have a much better strategy. Even recently losing, you can see the equity line is much smoother but for the recent period, it’s losing. OK?

    And let me change some of the periods. So, for example, from 14 I will go up to 15 and I will click on “accept” and you see there is a small change. And I will go up to 20 and I will click on “accept” and you see it’s getting actually worse. Alright?

    Now I can add as well a Stop Loss and Take Profit. For example, let’s add Stop Loss of 50 pips and Take Profit of 100 pips and I click on “accept” and you see there was a small change. So this thing really saves us time.

    With a manual strategy, you don’t need to test on a Demo account for long.

    If you have a manual strategy, you really don’t need to test it a long time on a Demo account. What you can do is simply to build your strategy here and see what was the performance for the last months, for the last year or even more, if you load more historical data.  And now talking about data, I will show you how to place the data over here.

    I click on “data” and you see here is a drop zone, drop the files here or click to upload. So let me get the files. I go to file open, data folder, go to MQL 4 and here are the files.

    This is the historical data that I have exported earlier. OK? What I will do, I will drop it in this window right over here. I will just drag it and drop it and you see the data is imported and uploaded.

    Do not take the brokers on my trading courses as recommendations.

    Now whatever broker you see on my trading courses, guys, please don’t take it as a recommendation. We are not connected to any of the brokers. But, of course, I have to choose one to record the courses and I’m always looking for the regulated brokers.

    I dedicated many lectures in my courses how to choose the broker and basically how to avoid the scam brokers because this is the most important thing nowadays since there are really many scam brokers around. You can read more about it in our Forum, it’s free. There is such a topic called “how to recognize the scam brokers” which will help you to identify them. Alright?

    Now going back to the strategy, we said that here we can build a strategy and immediately we can see the balance chart or the backtest. OK? We have “report” where we see detailed statistics about the strategy, the backtest output such as balance line stability, maximum Drawdown, months on profit, net balance and actually let’s get back to this better strategy that I took randomly. It was actually using the envelopes, the bar opens above the upper band and I will remove the Stop Loss and the Take Profit.


    Backtest output.
    The Report.


    You can see all opened and closed trades in the journal.

    So in the report, you can see that you have some statistics such as count of entries by weekdays, profit and loss in currency by weekdays, here you have it by hour, entry and exit hour. We have count of entries, profits and losses by entry hour and monthly performance are below which is very interesting as well. Now we have the journal, same as with Meta Trader, where we can see all the trades that were opened and closed.

    And actually from here if I go to strategy one more time and I just uploaded the historical data, if you upload your historical data you will see it somewhere over here. So this is the one that I uploaded, you can see a very small difference right in my balance chart. Now if you upload historical data from the different brokers and you see a huge difference when you change the server, this means simply that the brokers provide different quotes.

    Different prices, which forms different historical data but the strategy is the same. On the left side, we have the indicator chart which is something very interesting to me. Here we have where the trade was opened, where it was closed, so if we have the green line this is a long trade, if we have the red line this is the short trade.


    Forex algo software.
    The Indicator Chart.


    So you see here we have a buy position until here, then here we have the entry condition for short and then here we
    have it for long. You can see when the price touches these envelopes. Actually, to be precise, we set the bar opens above the upper band, this is the exit condition for the long trade. The money flow index falls.

    In this case, we with the Forex Algo Software when we have a long trade and a bar opens above the upper band, it closes the trade. 

    And our entry condition is with the money flow index. In this case, we say the money flow index falls. Alright, guys?

    So this is how you can build a strategy over here and the best thing with the Forex Algo Software, that I always say, is that with one click we can export this strategy as an Expert Advisor. You can see if I open it, you will have the code for the Expert Advisor already without mistakes and you can compile it. Alright? So we have the Expert Advisor ready to use and if you want to do it for Meta Trader 5 you can export it as well for Meta Trader 5. Alright?

    So let’s make a quick check with the Meta Trader. I will copy that, I will minimize it and I will paste the Expert Advisor. So I go to “open data folder” and I go to MQL 4 experts and here I will paste it. So this is the one with 343 ending magic number, I will open it. OK?

    Zero errors and warnings indicate the code is fine. This means the strategies from the Forex Algo Software are reliable.

    Let me compile it first. I click on “compile,” you can see there are zero errors, zero warnings which means that the code is just fine. And now I will see it right over here if I click on refresh, it is this one right here. OK?

    Now I am on USDCAD, I will drag the Expert Advisor over the chart, I will click on “OK” and let me backtest it. I will go to Expert Advisors, strategy tester, open prices. We have the date for the last 1 year and 15 current spread and I click on “start” and let’s see what is the result.

    Over here it’s 11,137, the graph you can see, it’s the very same graph recently losing in this zone. The very same thing what we had here, but here it’s just in a small window while in Meta Trader it’s quite bigger. And if you compare the results with the open and close trades, you will see that these are the very same trades that were open and closed.


    The same trades that were open and closed
    The Meta Trader.


    Could be a small difference because of the spread. Because here I entered the current spread and when we export the historical data, I use 10 points because I rounded it to the high number. But anyway guys, this is the way that you can check if the Expert Advisors created with the Forex Algo Software are real, are showing the very same backtest as what we have in Meta Trader.


    Forex Algo Software and Meta Trader differences?

    • the spread might cause a difference in the report
    • date range should match to see the same trades
    • Meta Trader starts the backtest from the 100 bar
    • the Forex Algo Software takes negative ambiguous bars
    • the Forex Algo Software is faster


    This is is how to test the reliability of a Forex Algo Software.

    And this way you can see if a Forex Algo Software is actually reliable or not. Of course, I have tested that many times and there are thousands of traders who use these Strategy Builders. So it’s tested, all bugs were fixed a long time ago and actually, it works really nice.

    Now what we have here, more with the Strategy Builder, we have the generator. The generator is the smart thing or I can say the intelligence that stands behind this Forex Algo Software. Because with the generator over the historical data that we use and that we imported from our broker, we select the symbol, the period and we can select what range to have for our Stop Loss, for Take Profit, if we want to use it or not, if we want to use trailing Stop Loss or not.

    And we have some generator settings and when we click on “start,” I will just click on start randomly without making any setup here. You can see that there are strategies generated. You can see what is the speed of the Forex Algo Software. It calculates really fast strategies and all of the strategies calculated, you will see them in the collection.

    So even if you don’t have any strategies profitable, you can generate your strategies over here. And these are the very same realistic strategies. If I click on any of those, you will see the entry and exit conditions. Also, the balance chart, the indicator chart and everything else.

    We can create our own Expert Advisors with the generator of Forex Algo Software.

    So this way, with the generator we can create our own Expert Advisors. You can see this strategy has a really nice profit line. Balance line. We have the Force Index, the Average True Tange for entry conditions. As well, the average true range for exit condition and we have Stop Loss and Take Profit with the strategy.

    So this is how you can generate strategies. Of course, you need to set up some limitations because you can see it calculated thousands of strategies. And already we have hundreds of strategies into the collection. Actually, in the collection, we see the best 100 strategies.


    Forex algo software.
    The Collection.


    But here in the generator settings is where we set working minutes. So for example, you can run it for 10 hours like I normally do before I go to sleep. I run it and then in the morning I have already strategies to work on. And then I download them, I download the complete collection and I run it again for another 10 hours.

    We have the Acceptance criteria in the generator settings.

    So this way, I make it work all the time for me. Let me stop it. So here in the generator settings, we have these common Acceptance criteria.

    So here we place limitations. OK? We place criteria for this strategy. So we don’t want to see hundreds of strategies that are just randomly generated. We want to see strategies that perform well, that have a good Profit Factor, R-squared or they don’t have a huge stagnation.

    We want to see many count of trades because this is very important. The more trades we have, the more robust the strategy will be. Because we don’t want to base our trading on strategies that were showing backtest only with 100 count of trades, for example, or 200.

    The more the number of trades the more the chances of success in the future.

    We want to see at least 300 – 350. If it is more, of course, it’s better. When we have more count of trades, it means that this strategy was executed more times in the past. OK? So if it was executed only 100 times, obviously the chance to fail in the future is bigger. This is because it was tested, we can say, just 100 times.

    The word test is not even the right word. Or we can say the strategy was executed only 100 times. And if it was executed like 400 times, 500 even, 700 times. Obviously, this will give us a sign that probably this strategy will continue working profitably in the future. And what else we have are these robustness tools – the Monte Carlo, the Multi Market, and the Walk Forward Validation.

    These are different robustness tools that I will cover in the next lectures. I will show you how I’m using them in order to filter the strategies and to test the strategies even before I am exporting them as Expert Advisor. OK? I’m testing them and if I see that they perform well with these criteria, just then I will give them a try trading. Alright?

    Thank you guys for reading the lecture, and I will continue with the next one. If you have any question feel free to drop it in our Forum and I will answer you.

    Cheers.

  • Forex Monte Carlo – Algorithmic Trading Strategies

    Forex Monte Carlo – Algorithmic Trading Strategies

    Forex Monte Carlo – one of the greatest robustness tools in algorithmic trading

    Forex Monte Carlo turns out to be a preferable tool from most traders using strategy builders. Hello, dear traders, it’s Petko Alexandrov from EA Forex Academy and in this lecture, I will continue with the Monte Carlo robustness tool that we have in Expert Advisor studio. So let me get into it. I have some strategies here that are memorized into the collection, I will remove them.

    The Forex Monte Carlo, you can find it right here, just below strategy when you click on “strategy”. But I don’t have any strategy at the moment. So let me generate quickly some and I will stay with USDCAD and M15.

    I will have the range from 10 to 100 for Stop Loss and Take Profit. And as generator settings, here let’s use the Acceptance criteria in this case. I will click on it.

    You can add different criteria when generating strategies

    And here, I will add some criteria for the complete backtest. Now if you’re using In Sample and Out of Sample you can add different criteria. This is what I was talking about in my previous course for the top 10 AUDUSD
    Expert Advisors.

    But here I will not use it. I will put some criteria for the complete backtest so I always start with minimum backtest quality and I keep it on 98. So this is the criteria if our historical data is fine and what is the backtest quality.

    Before it was called Ambiguous Bars. So here the software detects the bars or the Candlesticks that we have in Meta Trader. Where, for example, we have an entry, OK?

    Forex Monte Carlo
    The Meta Trader platform.

    Let’s say on the opening of this bar, let me zoom it or any bar doesn’t matter really, on any bar. We have the opening,
    for example here and then we have a Stop Loss and then we have a Take Profit. And with Meta Trader, we have the opening, the high, the low and the close.

    These are the four values. But we really don’t know what happened inside the bar. And if we have such a bar, where we have the Stop Loss and the Take Profit within this bar, the backtest will take it as a negative as it was hitting the Stop Loss.

    Backtesting with Meta Trader takes Take Profit.

    Now the difference when we are doing backtest with Meta Trader is that it will take Take Profit. OK? It will give it a more positive result which I really don’t like because I prefer to see the negative result instead of the positive result. Because if we have many bars with the strategy, this one, for example, here or anywhere else and our backtest shows us that it always takes a Take Profit, obviously this could be misleading and it could be the case that it will hit the Stop Loss more. OK?

    So Meta Trader takes the positive and EA studio here is skeptical and takes the Stop Loss, which I believe is the better method as well. So we can say that we see a more skeptical result for the strategy while backtesting it.

    Anyway, I keep it minimum backtesting quality 98 and I will add Minimum count of trades, what I was talking about earlier. I want to have at least 350 trades. So each strategy that will be generated, I want to see at least 350 trades executed in the backtest. OK?

    I will add as well the Profit factor, one of my favorite criteria and I will increase it to 1.2. So the Profit factor, for the newbie traders, this is the ratio of the Net profit versus the Net loss. And then I will set the minimum R-squared, something new with the Strategy Builder, which I really like to use and for example, here I will go with 60.

    The R-squared is an update with the Strategy Builder
    Choosing Acceptance criteria

    Find out more about R-squared in our forum.

    Now R-squared is a little bit more complicated. For more information about it in our forum, let me just show it quickly to you. There is one section called EA Studio Updates.

    When I click on it, you will see here some videos and explanations about the R-squared and about some other features. This is about the backtesting statistics and you see there are many commands. And I explained in details about the new features and let me just show you where the R-squared is.

    Right here on the second page. So this is a video if you click on it, that you can watch for free. And below, are explanations.

    So in simpler words, the R-squared gives us the equity line that is very close to such a regression line. And the higher the value we have for the R-squared means that we have more points on the line. The more the equity line is far away from the line or we have a dramatic Drawdown or so on, then we will have a lower R-squared.

    But here, it’s in details and for me it’s very interesting especially if you want to analyze your strategies in details. OK? So you can read it here in our forum. It’s free and you can learn more about it. OK?

    What is a good acceptance criteria to use in Forex trading?

    • the minimum backtest quality,
    • minimum count of trades,
    • the minimum Profit factor
    • and the minimum R-squared.

    The Acceptance criteria filter all strategies with regard to what you select.

    Now going back to the generator, I will press on “Start” and you will see now what the difference is. I have many strategies calculated.

    You can see 100s of strategies calculated, but still, no strategy is shown. Because it filters all these strategies with these Acceptance criteria that I have selected over here. Alright? I will explain about the Forex Monte Carlo.

    I had one strategy already calculated. OK? So I will take it as an example. I will click on it and you see this strategy uses Moving Average, Force Index for entry conditions and the Bollinger Bands as an exit condition.

    Forex Monte Carlo settings
    The Monte Carlo in Forex trading

    We have a Stop Loss and a Take Profit and here is the Balance chart. Alright?

    What are the different simulations in the ForexMonte Carlo?

    • market variations,
    • execution problems
    • strategy variations.

    So we can say this is a simulator.

    The Forex Monte Carlo conducts various backtests with different variations.

    On some places you can see it as Trading Simulator or Forex Trading Simulator, basically, what it does, it performs a variety of backtests with different variations. Now I like to use the strategy variation. So randomized indicator parameters, which means that the software does exactly the same what I showed to you on the Meta Trader.

    Where I was changing the parameters for the indicators and I was doing a backtest. OK? Randomized indicator parameters. One more time it will perform different tests, different backtests, with different parameters, with randomized parameters.

    And normally when I run the Monte Carlo, I want to see at least 80% of the simulations to be profitable. Now let’s concentrate only on this one, randomized indicator parameters. I will click on “Start” and you see that this strategy had 15 out of 20 validated tests.

    So this is below my criteria of 80%, which would be 16 out of 20. OK? You can see here are the results for the different backtests that were made. Now you can set it in options.

    In the indicators, you can set the change for the parameters.

    You can set what would be the change for the parameters, in the indicators, the deviation range in steps. I keep it here as a default. OK? I really don’t touch these things guys, because they are set in a very nice way and I have tested it a lot and for me, it was just fine, if it is in this way.

    Of course, you can play around with that but I’m not going into details. It’s a little bit more complicated. And it’s not really the subject of this course and I want to keep it simple.

    And I want to explain what is most important in this robustness tool. OK? Now if I go to random backtest starting bar, it will perform a variety of tests that are starting from a different point in the past. OK? They will not start from the 16th of October 2017, but they will start later on. OK?

    And if I click on “Start,” you will see what happens. The starting points are here, here in this range. And you can see that actually, the strategy continues to perform well.

    We test the Expert Advisors over the historical data when creating them and combined with the Forex Monte Carlo.

    It doesn’t matter when we will place it on the chart. And this is exactly the point of having this test. Because when we create the Expert Advisor, we test it over the historical data.

    But we will place it trading on the Meta Trader in a future moment. And here this simulation shows us that, it doesn’t matter when we will place it on the chart, it doesn’t fail. OK? Even if it was placed on a different moment from the one that we used while generating the strategy.

    And actually, these tests prove something very important, that this strategy is not over optimized for this period of time. Because if the generator over optimized it, exactly from starting here, let’s say in October 2017 till the moment, it found these best parameters exactly for this period of time. Then here with this test, I will see a dramatic loss when the strategy starts somewhere over here, in a later moment from this moment here. Alright?

    possible to choose from many strategies
    Collection of strategies

    And let’s take some of the other strategies because you can see many were generated. Some with very nice equity lines. I will click on this one and let’s go to the Forex Monte Carlo. I will perform these 2 tests and I click on “Start,” and you can see I have 17 out of the 20. Alright?

    So here, I get a little bit more positive results. And this is exactly what I want to see. OK? Strategies that are robust or having simulations with randomized indicator parameters and we’re having simulations with different backtests starting bar. OK?

    Use a randomized history data in Forex Monte Carlo when having problems such as a floating spread, historical data problems, etc.

    Now above we have market variations, which means a randomized history data, randomized spread. If your spread is floating a lot, you can check and perform robustness with the spread. So if I click on “Start,” you will see that this strategy keeps performing well, even the spread is a little bit different.

    Now if I have a randomized history data, I will click on “Start,” again the strategy performs well. This normally is used if you have problems with huge spread or floating spread or you have problems with your historical data. And then you have execution problems like randomly skipped positions, randomly close position.

    It will perform you such tests and simulations to see how the strategy will perform if you randomly close position. Now I don’t test this, because simply in algorithmic trading, my goal is to do it 100% fully automatically. OK? I don’t interfere with the Expert Advisors, I don’t close the positions and I don’t remove them from the charts for no reason.

    Change your broker if you’re having execution problems.

    So I don’t test these execution problems. And if you have execution problems with your broker, like huge slippage or they close your positions for some reason, then you better change your broker. OK? So these are the 2 Monte Carlo tests that I am doing, these 2 simulations which are very interesting to me and for me they just make sense because they change the parameters for the indicators.

    Forex Monte Carlo results
    Validation of Monte Carlo

    And using the last one, we tested the Expert Advisor or the strategy, if it has started at a different moment. Alright, guys? This is the Monte Carlo, you can see how many strategies are already generated, some of them with very nice backtest output and very nice equity lines. So this is about the Forex Monte Carlo, very useful analytic tool that we have with EA Studio.

    If you have any questions don’t hesitate to ask me in our forum. If you see this for the first time I’m sure it’s a little bit more complicated, but if there is something unclear really don’t hesitate to ask me. I will answer any question.

    Thank you for reading and I will see you in the next lecture.

    Cheers.

  • Trading Strategy for EURGBP: MetaTrader 4 Course

    Trading Strategy for EURGBP: MetaTrader 4 Course

    Trading strategy is what every trader looks for.

    Trading strategy is not enough, everyone looks for the profitable trading strategy that will bring him profits. In this article, I will demonstrate such EURGBP trading strategy!

    This trading strategy is part of the basic master class from EA Forex Academy called MetaTrader 4 Forex platform: Start trading with a pro trader.

    In the course, you will find 2 more strategies that are shared, and three of them are for different currency pairs.

    Why this trading strategy is on H1 chart?

    This is because for three of them for EURUSD, for EURGBP and for GBPUSD strategies we use bar opening. So we’re looking at every new bar that opens. Let’s go to the end and this means that you don’t need to stay in front of the computer all the time. If you decide to trade these strategies manually not with the Expert Advisors that I will provide you later on in the course.

    You will need to look at your chart and every 1 hour. Don’t need to stay in front of the computer the whole time but you need to look at the 1 hour when the new bar opens or when the new hour is there.

    You can look at the screen and see if the entry condition is there, the trading strategy rule is there or not. So you don’t need to stay but just to have a look at every 1 hour on the new bar that opens. And one more thing why I have selected the 3 pairs let me put them together. So what we have? We have EURUSD, we have EURGBP and we have GBPUSD.

    There is a reason why I have selected these three.

    How can we have balanced exposure is trading?

    • Euro (one time with EURUSD, one time with EURGBP)
    • Dollar (one time with EURUSD, one time with GBPUSD)
    • Pound (one time with EURGBP and one time with GBPUSD)

    We have equal exposure and this is very important when you are trading a couple of strategies together. No matter you have a manual trading strategy or automatic and you place, for example, only Dollar currency pairs. This is very, very wrong and many traders are doing that.

    For example, they trade GBPUSD, USDCHF, USDJPY, USDCAD, USDAUD and they open many positions with Dollar currency pairs. And if something dramatic happens with the Dollar for the day. Some important news or anything you can have an actually huge loss on all of your positions. So make sure to diversify between currency pairs and to have equal exposure.

    That’s why I have selected these three trading strategies one for EURUSD, one for EURGBP and one for GBPUSD. And one more time on each one chart we are looking at the bar opening. If you want to trade these strategies manually you can have a look at the chart only on every round hour. So for the EURGBP strategy, we will be using the Accelerator Oscillator. And I will go to insert, indicators and I will go to Bill Williams and then Accelerator Oscillator:

    Here it is, it doesn’t have any parameters I click on OK and here we have it over the chart:

    trading strategy with the indicator
    Accelerator Oscillator indicator.

    The trading strategy rule for a long trade is Аccelerator Оscillator changes its direction upward.

    This means that we will enter every time long when we see the Accelerator Oscillator changing its direction upwards. And again the current bar is moving. When the price moves you will see that the indicator bar as well is moving up and down. So to make the signal clear you need to wait for one bar that is below the previous one for example, for the short trade. And when the new bar opens you can enter, for example, over here. Let me move the chart this way.

    I will just zoom it a little bit so here you see we have a negative bar and then right here we have a smaller bar. But during this time it’s moving because of the price that is moving during this one hour. And then on the opening of next one right over here I will see that I have already one bar smaller than this one with certainty. Because it will not move anymore.

    This is the entry moment for the trading strategy and I will enter at the opening of thе bar.

    So we always wait for one bar for confirmation that is smaller than the previous one. And then we enter the next one. So sometimes you see that the bars are nearly equal and if I put the mouse on it you can see that it shows the value. So it’s 9385 and here we have 9 169. But of course, the easier way is to recognize it by the color. So if you have a series of green bars and then you have a red one this means that this bar already is smaller than this one. Then on the opening of this one you can enter the market.

    Let me zoom it out. So one more time we enter on the market when the oscillator changes its direction. So when from red we have one green and then on the opening of the next one we are going long. And on the other side when we see a series of green bars and we have one smaller or one red bar on the opening of the next one. We go short.

    Let’s have a couple of examples in a row.

    So you can understand easier the trading strategy. We see right over here one smaller bar and then on the next one, we are entering long. We have it right over here:

    crosshair to help
    The entry point for the trading strategy.

    At the opening of this bar and this is at 1.87 66 this is the price when this bar opened over here just after the Accelerator Oscillator changed its direction upwards. And as well we are having a Stop Loss and Take Profit. Here we have a smaller Take Profit than the Stop Loss takes profit of 52 pips. Let me place it.

    I will just make the horizontal line green. And I will have the value of 1.87626 and 4 points if we need to be very precise plus Take Profit of 52 pips. This will be 0.88114. And I will have it exactly in the place. And then below I will have a Stop Loss another 78 pips under. But obviously here with this example, if we place the trade here our Take Profit will be hit.

    No need to place the Stop Loss over the chart.

    I will just place an arrow to make it clear that we are having this long entry right over here. So Аccelerator changes its direction, the price goes up and hits our Take Profit:

    price goes in our direction
    Take Profit reached.

    Now, here as well we have the RSI indicator as a Take Profit indicator and the period that we are using here is 35 and the levels are the standard 70 and 30. I click on OK.

    I will have it below the chart. So one more time for the RSI indicators. Have it on these two strategies this one and the EURUSD and it will happen very rarely that they will hit the 70 and the 30 levels. Because this is a huge period, it’s 35. Its huge period for RSI that’s why it’s not moving too much up and down but it happens.

    If I zoom out the chart you will see that there are times actually when it reaches these lines and this is just on the extreme cases. And it is fine even you use it very rarely if you see such an extreme case and the price goes to its maximum.

    You would be very happy to Take your Profit over there. So just keep it on the chart even you don’t see too many times happening. You will see it sometimes and you will Take your Profit in a very nice place. So let’s continue now with some consecutive examples.

    This way you will learn how to use the trading strategy better.

    So if we enter here then our Take Profit would be hit over here right at this bar. Let’s say you are in front of the computer during this time and you continue to follow the strategy. So here we have a smaller bar and right over here we have signaled to enter short. I will move it right over here at this bar you can see the smaller bar from the Accelerator Oscillator. And then right here will have a short entry.

    We will have to Take Profit lower. I will place it exactly on its place but let me place the arrow. I will need arrow down right here. And it went just over the line let me just move it, guys, because I want to make it red. So I will go to our properties and I will make it red. It will have one green for the long entries and one red for the short entries.

    Right over here we have it on the opening of this bar and this is a short signal for the Trading strategy.

    The trading strategy example when sell
    A short example for the strategy.

    So our Take Profit will be 52 pips lower what we have as a price is 0.8813. Minus 52 pips that would be 0.87619. I click on OK and here we have to Take a Profit and let’s see where is our Stop Loss. We said Stop Loss of 78 pips. So it will be right here above somewhere.

    I will calculate it, I will change the color to make it red because it’s a Stop Loss and exactly we need to place it at 0.8813 + 78 pips that would be 0.8891 and then we have 9 points to make it precisely. And you can see that the Stop Loss went much higher and what would have happened.

    Here we go short, we place our Stop Loss and place our Take Profit and then you can see the price will go here on negative. But then it will reverse down and we will have our Take Profit hit.

    In this situation, we have Stop Loss bigger than the Take Profit.

    But one more time I have backtested these strategies with Expert Advisors and I will show you later on that having such a Stop Loss and Take Profit over here it will bring you actually better results. And you will see many traders around the Internet which will tell you that Stop Loss always needs to be smaller than the Take Profit minimum 1-2, should be 1-3. 

    But this is an old thing and this was a long time before the Algorithmic Trading. Which actually proved that the Stop Loss should not be three times smaller than the Take Profit or two times smaller than the Take Profit. However, I don’t want to argue with anybody about that. Give it a try, see how this works with you on a demo account and I hope you will find it useful. Especially for this trading strategy and especially for these assets.

    So to make it clear here this strategy is only for EURGBP. You should not use it for other currency pairs. Same with the EURUSD same with the GBPUSD trading strategy that I will show you in the next lecture.

    These are strategies that are created only for these currency pairs on the H1 chart. So you should not change as well the time frame. Keep the currency pair and keep the time frame.

    Let’s have a look at one more example.

    We said here we will go short and we’ll go down and here we have our Take Profit. Right at this bar and then what we have here let me take the crosshair. What we have here is our Take Profit. We are out that we have a change. Because we have here already a change. We have here a green bar and then a red bar and then here we have another red bar. So we can consider right this for a change and we will have a new short entry right at here. Let me move it.

    The next example with the trading strategy is here:

    trading with the system
    Another negative example

    I will move as well the vertical and the horizontal line right over here. And then I will move it as well here at this bar. So here is the entry at 0.8767 and then I will not look at the price further on what happened. I will put the Stop Loss and the Take Profit. So let’s fix the Stop Loss over here.

    We have an entry at 0.8767 plus Stop Loss of 78 pips. We will have it at 0.88456 right here and then where is our Take Profit. I will change as well to Take Profit. So we will have 0.8767 – Take Profit of 52 pips. That would be 0.8715. And I press on OK, and it will go lower.

    Let’s see what happened after that. Actually, the price went below and hit the Take Profit.

    And then again we will have right here another entry and it will be actually a buy. Let me take the arrow to buy. The entry is right over here, smaller bar.

    Then on the next one, we enter. We have the first smaller on the opening of the next one actually the opening is right here. Because this is a negative bar we need to place it over here and then we will have a buy. And let’s just see what happened.

    We are into the trade. Because we are very close now to the current moment and we will be just a little bit on a negative at the moment. Because our entry price will be at 0.8712 and now it is at 0.8701. Let’s summarize it.

    What is a good trading strategy for EURGBP?

    • We look when the Accelerator Oscillator changes direction
    • We have the RSI as an exit condition as well
    • Take Profit and Stop Loss are there

    If we see that the price reaches the 70 levels and we are in a long trade. We should Take our Profit if it reaches the 30 levels and we are in a short trade. We can Take our Profit actually here you can see that we have such a break. I think for the 30 levels.

    So it would be just a little bit later after we Take the Profit. Because we said we are Taking the Profit right over here. With this example, because the Take Profit level is here but then just a few candles later you see that the RSI just touches the 30 levels.

    So it happens rarely but it happens if you see it. It is a great place to Take your Profit because normally it is after such movements where the price goes aggressively in one direction. I will attach again sheet with the parameters for the trading strategy with the trading rules which will make it easier for you to set up your screen for the EURGBP strategy on H1.

    Thank you very much for reading!

    If you have any questions, please, write to me at the e-mail or write in our trading forum. There you can get an answer not only from me but from many experienced traders.

    Cheers!

  • Robo Trading Software: OOS Monitor and Acceptance Criteria

    Robo Trading Software: OOS Monitor and Acceptance Criteria

    Robo Trading Software – the easiest way to do algorithmic trading without programming skills.

    Robo Trading Software called EA Studio is what most of the algo traders are focused on during the last few years. It generates strategies, analyzes the results, and exports EAs with one click.

    This makes it one of the most preferable Robo Trading Software nowadays. This Robo Trading Software comes with a 15-days free trial, and everyone can test it.

    Hello traders! This is Petko Aleksandrov speaking from EA Forex Academy. In this article, I will talk about a recent update that we have in the Robo Trading Software EA Studio.

    About the out of sample monitor. Which is available if I click on any of the strategies that I have in my collection:

    Robo Trading Software OOS monitor
    Robo Trading SoftwareRobo Trading SoftwareOOS monitor in EA Studio

    You can see it right over here next to the report. It says “OOS monitor” and it stands for out of sample monitor. But before explaining all of that. I think I need to explains

    What means actually out of sample?

    If I go to the generator and I want to generate strategies let’s say EURUSD on H1. I will just take this randomly. And then strategy properties as you know where you can enter the lot size, the minimum, and the maximum take profit and stop-loss.

    And then in generator settings, we have out of sample. So in-sample, this is a statistical measure for all the data that we have in our statistics.

    When it is in-sample it means it will use all the data we have in EA Studio Robo Trading Software. In this case on H1, these are 27 409 bars. So if I keep it in-sample this means that the generator will generate strategies based on all of that data. 

    But here the risk is that we will have over-optimized strategies. This means that the generated strategies will show such an equity line exactly for this period of time that I have been using for the generation.

    And after that when I place them trading on the MetaTrader there is a chance that they will start losing.

    One of the options is the method to place them on a demo account. So it will test the strategies on unknown data, okay, and we will see which one of those will continue profiting. And which one will start losing.

    The second option is to use the out of sample.

    If I click on the menu you’ll see ten percent, twenty percent, thirty-forty-fifty percent. So let’s go with the middle one of thirty percent. Now if I run the Robo Trading Software generator with thirty percent out of sample this means it will generate strategies by eliminating thirty percent of the historical data that I have for EURUSD on H1.

    So if I have 27 thousand 409 bars times zero three it will eliminate eight thousand two hundred twenty-two bars. And it will generate strategies only on the rest historical data.

    So the data before the last 8222 bars and after that it will show us the result that we are having at the last 8222 bars or the last thirty percent. So let me just demonstrate it to you.

    I will leave it just this way and I will remove the acceptance criteria just to demonstrate to you what I mean. So you see immediately I have many strategies generated and they are being generated only on the first 70% of the historical data.

    But you see what happens exactly after that. I will stop it because this is a very good example. The strategy was generated over 70% of the historical data and with the last 30 percent actually, the strategy started to lose. So this is exactly the over-optimization:

    Robo Trading Software shows over-optimized strategy

    The Robo Trading Software Generator finds strategies that are profiting for the tested period.

    Then when it is simulating real trading the strategy loses. And here I have selected search past by net balance. So the generator finds strategies with the best net balance.

    And at this point exactly between at 70% it starts simulating real trading. So here is shown the result of unknown data. Meaning that the generator eliminates this 30% while generating the strategies.

    And you see here this strategy starts to lose which means that the out of sample shows the strategy was over-optimized.

    So let me run one more time the generator and it will generate hundreds of strategies immediately. Because I have removed the acceptance criteria but just because I wanted to show you exactly what I mean.

    Now you see with this strategy that is shown at the moment actually after that the strategy shows a little bit of a negative but recently positive result.

    And now you see even a little bit better strategy which continues to make some profit during this last 30% of the time. Let me stop now the generator. So one more time to make it clear:

    What is the Out of Sample in Forex?

    • the white period is in-sample
    • the green period is out of sample
    • generate strategies during in-sample
    • simulate trading during out of sample

    So here if we select in-sample this means it will use the whole period, the whole historical data we have. If we use 30% or any of the other choices the green one is out of sample. The white one is in-sample.

    Now when we use out of sample we want to see the strategies that are actually profiting in the out of sample period.

    And this is another update now in EA Studio Robo Trading Software. If I use the common acceptance criteria you can see that there are few options.

    What is the acceptance criteria in Forex?

    • a complete backtest criteria
    • in-sample which says “training part” criteria
    • out of sample which says “trading part” criteria
    Settings for the OOS
    Common Acceptance Criteria

    So one more time the white part from the balance chart was in-sample where the generator was working. So it’s training, this is where the generator in Robo Trading Software builds the strategy.

    And then out of the sample was the green period or the last 30% with the demonstration I did which is the trading part. So it’s simulated real trading on the unknown data. The data that was not used while generating.

    Now you see here by default comes minimum net profit and minimum net profit.

    So if I select, for example, to have minimum net profit one and then I select to have minimum net profit one as well in the out of sample. This will mean that in the currency my trading account is I will have at least $1 if it is in dollars or one of currency.

    When I run the generator and in generator settings, I use the common acceptance criteria. So it will generate the strategies that will have at least one dollar of profit here and then one dollar of profit in the out of sample.

    So let’s run now the generator and you will see it shows me strategies that are having no losses in the green zone, in the out of sample.

    It could be just one dollar but it’s still a dollar profit. So it’s still a profitable strategy on the green period and this is what exactly I wanted to show you. That with the acceptance criteria, you can choose what acceptance criteria to have in the in-sample part and in the out of sample part.

    Going back to the generator you will see much better strategies over there.

    Forex EA Builder results
    All the strategies are visible in the collection

    And if I improve that so let me go back one more time to the acceptance criteria and I will actually delete all of these strategies. So going to the generator-generator settings-common acceptance criteria. So let’s say here I will go up to 100.

    Alright, I want at least 100 of a profit on my out of sample period and an in-sample period. And I’m having a minimum count of trades 100 and minimum backtest quality 10. Alright so going back to the generator.

    I will press Start and you will see how the strategies are having actually minimum 100 in the in-sample part and then a minimum of 100 in out of sample part. And if I click on the collection you will see that this is true for all strategies generated.

    So here, for example,  the strategy made some profit in the beginning. Then it went a little bit on a loss. But still at this point at the 70% of the historical data, it is above 100 of a profit.

    And then during the out of sample period again it has much more than 100 of a profit. So this was a great update in EA Studio. That we have now the option to decide what acceptance criteria to have in the complete backtest. In the in-sample part and our sample part.

    Now if I click on any of the strategies, for example, I will go to the first one you will see that with the balance chart in the editor. I don’t see the green zone. This is because the editor uses all the data that we have for this asset.

    But here comes the update in the Robo Trading Software – out of sample monitor.

    If I click on it you will see here that I have a lot of information for the in-sample part, for the out of sample part and for the complete backtest. As well you will see that it shows the net profit for each one, the count of bars for each one and then the start date and the end date.

    So you can see the in-sample was from the 25th of August 2014 till the 25th of September 2017. And out of the sample was from the 25th of September 2017 till today. Which is 8223 bars just as I have calculated it with a calculator.

    So here we see in details how many bars we are using. No need to use the calculator. And exactly from which date until which date. And in the end, we have the complete backtest.

    Now what you notice is that we have in green the net profit for the in-sample, for out of sample, the count of trades and the backtest quality in complete backtest. This is because these are the criteria that we have in the acceptance criteria.

    You see I have the minimum net profit for in sample and out of the sample.

    And then I have the minimum backtest quality and a minimum count of traits. So if you use some other options here in the criteria you will see them in the out of sample monitor.

    And they will be either in green or they will be in red. If they were not validated. So for example, if I change out of sample to twenty percent you see still all our validated. Let me go to ten percent.

    Here you see that out of the sample was not validated because the net profit is just nineteen dollars. And in the acceptance criteria, I have selected to be a minimum of 100.

    Robo trading software statistics

    So one more time with ten percent of out of sample, it is just 19.98. Which means it’s not validated. If I put it back to thirty percent you will see that it’s just validated and it shows in green.

    Alright, so here you can see a very detailed statistic about each period. About the in-sample period, about out of the sample period and about the complete backtest. So the complete backtest is in the sample plus out of the sample.

    Alright, so this is the improvement that we have in the EA Studio Robo Trading Software with the out of sample.

    Why the Out of Sample in Forex trading is useful?

    • it gives a lot of opportunities to the trader to filter the strategies while they are being generated
    • with the recent update, it is possible to predefine acceptance criteria for the in-sample part, for the out of sample part and for the complete backtest
    • saves time for Demo testing which is very important

    Аt the end I’ll give you some tips on how to set up the generator in this Robo Trading Software.

    In order to use the optimizer with out of sample at the same time. So let me remove this collection now and I will switch to the reactor. Alright, so I will leave it the very same thing here EURUSD, H1, strategy properties. I will leave it between 10 and 100 pips. And then in the generator settings, I will remove the acceptance criteria and I will remove out of sample I will leave it to in sample. Some maximum number of strategies without any limitation. And then I would like to use the optimization.

    In optimization, I have the option now search passed by net balance returned to drown down system quality number and so on. I can use here R-squared. And I will use here the out of the sample of 30%.

    set up for the reactor Robo Trading Software
    The reactor in EA Studio Robo Trading Software

    This means that the generator will generate my strategies. There will be optimized only for 70% of the time of the tested period. And then for the rest 30%, it will show me the result of these strategies. If I use common acceptance criteria I will leave it here the way it is minimum net profit 100. For in sample and out of sample.

    And as well here I can add R-squared again if I am using these criteria. For example, here I will leave it 65. I will use the very same thing on the out of the sample and I will leave it here as well 65.

    And then for the complete backtest, I want to have an R-squared minimum of 85. So this means that for the complete backtest I will have 85 for in-sample. I want to have at least 65 and out of sample, I want to have at least 65.

    I will run now the reactor in the Robo Trading Software.

    Probably it will take me some longer time. You can see there are already generated strategies but they don’t pass the optimizer. Because it uses the acceptance criteria for minimum net profit. Аnd at the same time for R-squared 65 for in sample and out of sample and 85 for the complete backtest.

    And you can see there is already one strategy that passed. I will click on it. And you will see what a great strategy I have with a complete R-squared of 87.51. And if I click on it and if I go out of sample monitor you can see what I have here in green. I have a net profit. Which in this case is 1471.49 and then I have R-squared of 77.88, the minimum here was 65.

    Then with Out of Sample, this is the trading, this is the simulation. This is where the optimizer didn’t work. It optimized the strategy only for this period and not for this one and the net profit here is 1088.05 and here is 75 and R-squared is 75.74.

    And here I have R-squared of 87.51 which is great for me. I have a huge count of trades and I have backtested quality of 99.99 percent.

    So this is one of the ways that we found recently to be working really great. You can test it out and see how useful this update in EA Studio is. And it will take you some longer time to generate strategies.

    But at the end of the day, we have very nice strategies with a very nice balanced line. Аnd we are protected from the over optimization. Because the optimizer worked only for 70% of the time. Аnd for the rest 30%, it was not optimizing the strategy.

    Thank you very much for reading this article! If you have questions you can always write in our trading forum.

    Also, you can test 15-days free trial EA Studio from our website.

    Enjoy the trading!

  • Stochastic Oscillator EA: Meta Trader Course

    Stochastic Oscillator EA: Meta Trader Course

    Stochastic oscillator indicator – the key indicator among the Oscillators in Meta Trader.

    Stochastic oscillator indicator is one of the preferable indicators from many traders. It shows the overbought and oversold market, which is very useful. This makes it suitable for a range market, which is the hardest for trading.

    In this article, you will understand how the oscillators work and how you can build Stochastic oscillator EA without programming skills. Many traders think that algorithmic trading is difficult because IT skills are required, but this is not the case anymore. But now you will learn how you can create not just Stochastic EA, but any other you think will bring you profits. And we will show you realistic backtest and results from stochastic EA, and you will see how you can analyze such an Expert Advisor.

    If you want to build a stochastic indicator EA, it is better to combine the indicator with different indicators. This way, you will filter the entries better, and you will get stronger signals for your trading.

    Our advice is not to ”fall in love” with the stochastic oscillator or any other indicator.

    Many traders do the mistake to like so much one indicator (many times that is the Stochastic oscillator) and they do everything to go around it. Even their strategy is losing, and they add different indicators, remove indicators, change the Stop Loss and the Take Profit, but they do not remove the stochastic oscillator. They just believe it is a profitable indicator because they read it somewhere.

    All indicators are useful if they are combines properly. So let’s get started with some basics, and you will learn how to create a profitable strategy.

    For the very newbie traders, I will explain what the indicators are and how they are useful in Trading. So if you are advanced Trader and have an idea about indicators trading platforms and Forex trading, you can skip these sentences.

    Once you decide to trade on the Forex market, you need to have an account with any broker. The broker provides us with access to the real market and allows us to trade. Once we open the account and stole the platform, we need to know in which direction the market goes.

    If you look at the charts, you will not have an idea of whether to buy the asset or to sell it. This is where the indicators as the stochastic oscillator indicator come very useful.

    There are different formulas behind each indicator, and they are based on the price. Most of the indicators use the information that we get from the candlesticks.

    Also, any EA that we build, does not matter is it Stochastic oscillator EA, is it MACD EA, or any other, the EAs are made over the Historical data which is exactly the data from the candlesticks.

    What information do we get from the candlesticks?

    • Open
    • Close
    • High
    • Low

    Most of the indicators are invented during the last century, and they are beneficial till today. The best results are coming when the trader combines a couple of indicators.

    Below in this lecture, you will learn how the different indicators work and what signals they provide. And in the MetaTrader course, you will learn how to build strategies using various indicators at the same time.

    Now, in this article, I continue with the second part with the Oscillator indicators that we have in MetaTrader. So in the previous lecture, we went to the first seven indicators, and now we are going to the eighth one, which is…

    The Momentum.

    Momentum indicator
    Momentum indicator

    Which is pretty famous I can say a pretty standard indicator in Forex trading.

    When the Momentum indicator gives a signal for price change?

    • when it changes a direction and starts to rise it provides us with a signal that we need to buy
    • when it reverses, and it goes down it’s a signal that we need to sell

    Usually, the extreme high or low points are signals that the trend will continue. With the stochastic oscillator indicator, we have the over-bought over-sold areas.

    This means that the indicator shows us when the price might reverse. While with the Momentum, we can expect a continuation of the current trend.

    The moving average of Oscillator.

    Moving average of Oscillator indicator
    Moving average of Oscillator indicator

    It’s just right here Moving average of Oscillator. I will click on OK, and you see it’s very, very similar to the MACD, but we don’t have the signal line over here. It’s just displayed in a very, very same way. And the Moving Average Oscillator is calculated as the MACD line minus the signal line. So we can say it is the difference between the Oscillator and Oscillator smoothing.

    It is a different approach from the Stochastic Oscillator Indicator.

    So, moving average convergence divergence or the MACD baseline. Which I said is the one connecting the bars is what is being used here as an Oscillator. And the signal line is the smoothing. So the Moving average of Oscillator is one more time the MACD minus the signal line or one more time we can say it’s the difference between we the Oscillator and Oscillator smoothing. And here we have the very very same signals. When the Oscillator changes. So when it crosses the zero line very very simple.

    I’d prefer to use more the Moving average convergence divergence or the MACD indicator. It is just more visual. It gives better signals. According to me, of course, this is just a personal opinion over here. I want to show you all the indicators available in Meta Trader. So you can have a better idea about them, and you can decide which ones to use.

    Then we go to the RSI relative strength index.

    oscillator indicator
    RSI indicator

    Another very very common Oscillator indicator in manual trading, especially in manual trading. So the Relative straight index goes between 0 and 100. We see the 30 and 70 levels, and we say it’s a price following. So it follows the price just because of the way it is calculated.

    It shows when the asset is overbought and over-sold just like the Stochastic Oscillator Indicator, but it follows the price.

    Typically, it uses the tops that are above the 70 line or the bottoms that are below the 30 lines. Like this one over here or this one over here. And it is used to show some signals when the price might reverse. It has as well divergence, which we have already discussed. As well it forms some patterns that are familiar from the technical analysis, such as trendline or support and resistant trendline.

    You can draw them over the indicator itself.

    So let me look for some example I’m just looking at the current chart. But typically, when it breaks, it will break just before the price. So you can see here if I have this trendline on the chart, let me make it precisely. So it will be right here. Kind of trend over here, and then you can see if I do it from this bottom and this bottom, and now the RSI bounces off it.

    Now, if I use the very same trendline over the chart, it will be here, right?

    Stochstic indicator EA
    Price action over the RSI indicator.

    I will do it precisely again, right over here. So you can see how far is the price of what I have here. So if the RSI breaks the trendline, it will be much earlier than the price will break this trendline on the chart, which will give us the signal earlier then what we’ll have over the price chart. You can look as well for some patterns such as head and shoulders, double tops, triple tops or bottoms, or whatever price patterns you are familiar with.

    I will close this now, and I will go to the next Oscillator indicator. Many beginner traders associate the Oscillators with the Stochastic oscillator, but these are actually a whole group of indicators.

    Relative vigor index

    RVI indicator
    RVI indicator

    This index displays with two lines, and it goes around zero levels as well. And as a rule in this index, it is used that the closing price is higher than the opening price.

    Now it uses a simple moving average of 10 as a default input over here. And it is considered as the best period for this indicator. Of course, you can change it to any if you decide that it will work better for you, and especially in Algorithmic Trading, we don’t use these default levels. But we use different numbers because we optimize the Expert Advisors according to the historical data that we have from the broker. And as you see, there are two lines here with the RVI or the Relative vigor index. Which by crossing show us rapid signals.

    I will remove now the RVI index, and I will go to the next indicator.

    Which is the Stochastic Oscillator Indicator

    Stochastic Oscillator Indicator
    Stochastic Oscillator Indicator

    I will drop it over the chart. So the Stochastic Oscillator Indicator looks similar to the one we had before. We have levels of 20 and 80. Now here as well, we have two lines one is known as percent K and the other one – as percent D. Which is displayed with a line with dots usually. And actually, this percent D is moving an average of percent K. So this red line is a simple moving average of the other line.

    Again many strategies over here from this Stochastic Oscillator indicator.

    Many traders try to create stochastic ea using some of the basic rules that stand behind that indicator. Unfortunately, it is not enough to use just the conditions from one indicator. You have to mix it up and combine it with another indicator. You can still base the stochastic ea on that indicator as a significant entry rule, but filtering with other indicators will bring you better results.

    Creating a Stochastic EA is not as easy as some people think, and below, I will show you some examples that will make it more transparent for everyone.

    One of the common strategies is to look when percent K will cross the percent D and especially when it is in those overbought or oversold situations.

    • below 20, we are looking for an oversold market
    • above 80. We are looking for overbought markets

    So if we have across here, it makes the signal stronger. And here as well, we are looking for divergences. As we said, divergence is when we have lower points on the price, and the indicator fails to make such a lower point. So, for example, here you can see we have the price going lower, but with the indicator, I think it’s a little bit higher. So this gives us the signal that there might be a change in the direction of the price.

    I will remove now this Stochastic Oscillator indicator, and I will go to the last Oscillator that is in the group here.

    Its name is William’s percent range.

    William's percent range indicator
    William’s percent range indicator

    I will click on OK. Using the main percent R14, which you can see again is displayed, but this time, you can see it is negative from negative 100 to 0. We have levels of negative 80 and negative 20. That’s why it is said that the percent R has an upside-down scale.

    And this is what makes it different from the Stochastic Oscillator.

    So it is very similar to this Stochastic oscillator just it has a negative scale. And one of the suggestions here is to wait to see a confirmation on the price itself. So if we see a signal on the indicator, we might want to wait a bit to see the price actually going with the direction of the signal and then to enter on the market.

    So these were all Oscillator indicators in MetaTrader. I just wanted to go over each one to give you an idea of how they look and what are the essential signals that they provide. And as said, each one of them has many interpretations and could be used in many many different ways.


    Creating Stochastic Oscillator EA with strategy builder

    Coding a Stochastic Oscillator EA is not a simple task. It is hard to be a good trader and a good developer at the same time, or we can say almost impossible. The other option is to hire a developer, which is costly.

    The best method we have found is to use strategy builders as EA Studio.

    Now, you can test each of the oscillators indicators using the strategy builder EA studio.

    There you can build your strategies and export them as expert advisors. The good thing is that you see the results before testing the strategy.

    For example, if you placed only the Stochastic oscillator indicator on EURUSD H1 chart, you will see the following result:

    Results in EA Studio strategy builder
    Results in EA Studio strategy builder

    In this example, I have used stochastic oscillator indicator Rises as an entry rule, and I have used to have a stochastic oscillator indicator that falls as an exit rule.

    As you can see with equity, charge, the strategy losses. Here we see the results for the last 100000 bars of historical data. This way, we know if such a strategy would be profitable or losing for the last couple of months or years depending on which timeframe we use.

    For example, if I switch this strategy to the daily chart, you will see that the Equity line looks better, but it’s still losing:

    D1 chart with the same strategy
    D1 chart with the same strategy

    Now, if we use the stochastic oscillator indicator combined with other indicators, for example, the alligator and the directional indicators for entry rules, we will have a much better strategy.

    Also, as an exit condition, I will show you the indicator commodity index, which will improve even better the strategy. I will add as well Stop loss and Take profit to make it a complete strategy:

    A better strategy with combined indicators
    A better strategy with combined indicators

    You can see that the Equity line is much better and the strategies profitable.

    We have the stochastic oscillator indicator Rises as one of our entry rules.

    The Alligator indicator is with the rule the teeth cross the jaws down words.

    The third indicator that is used is Directional indicators, and we have DI plus line that is higher than DI minus line.

    Also, we have a commodity index crosses the level line up word.

    The strategy uses stop loss of 72 pips and take profit of 100 pips.

    From the backtest output, you can see that the strategy has returned to a drown down ratio of 4.45. This way, we have a decent strategy that uses this the fastest escalator indicator but not alone.

    Thank you very much for reading this article!

    If you have any questions, you can always write in our trading forum on the website.

    Cheers!

  • Forex Strategy Tester and R-squared: Improve Your Equity Line

    Forex Strategy Tester and R-squared: Improve Your Equity Line

    Forex Strategy Tester is a key point when we trade with Expert Advisors.

    Forex strategy tester and the R-squared improvement is what we will talk about in this lecture.

    My name is Petko Aleksandrov from EA Forex Academy and today I will talk about the R-squared which we have as an improvement in EA Studio Forex strategy tester, and we have it as additional criteria to our trading strategies.

    Forex strategy tester is a great tool that algorithmic traders use. It allows the trader to test any strategy before it is placed on the platform for trading. This saves a lot of time, effort and resources.

    EA Studio is not just a Forex strategy tester.

    It combines many analytical tools such as the R – squared. Also, it has the generator which works over the historical data of the broker. This means that even you do not have any profitable strategies, it will generate your strategies according to the predefined acceptance criteria.

    It is web-based Forex strategy tester, which makes it extremely fast, probably the fastest one you can find. If you leave the generator working for 10 hours it will generate over half a million strategies.

    So if I open the Forex strategy tester and click on any strategy randomly in my collection you will see that with the backtest output I have the R-squared:

    Forex strategy tester
    Backtest output

    And actually the backtest output you can now change it and you can select which criteria to use from tools-settings and here are the backtest output metrics. So you can select which ones to see in your strategy editor. For example, the last one now at the moment is win-loss ratio and if I change it to the minimum count of trades and I go back to the strategy you will see that I have here count of trades 333. So you can select now which backtest outputs to have over here.

    The R-squared is a new parameter in the Forex strategy tester that is related to the equity line.

    When we use the Forex strategy tester EA Studio we have different backtest output. Such as Min Count of Trades, Maximum consecutive losses, Win/Loss ratio, and many others. These criteria help us to identify which trading strategy is better than the other one, and which one we want to use in trading.

    When we run the generator in EA Studio, we see some strategies with equity lines, and it will take you a long time working with EA Studio to recognize which are the good strategies only from the equity line. With the Forex strategy tester EA Studio you have the outputs directly shown and it makes it much easier to filter the strategies.

    More, when we run the Generator we can see what backtest output we want to see as a minimum, so at the end of the generation process, we will have only the filtered strategies into the collection. This is called acceptance criteria and it works brilliantly.

    Let me show you first what is R-squared and I will just Google R-squared and I will go to images and I will show you what it is. Basically, this is a regression line as a trendline.

    Equity line as a regression line
    Regression line

    And we have different dots above and below, some are on the line some are not on the line. Here, for example, is another picture with many many points and there are many pictures over here. But we can say this is a regression line with different points above and below.

    Imagine we are having such a line here on our balance chart. So our equity line will go above and below and then it will go above and there will be some points that are on this regression line, right? And here R-squared changes between 0 and 100.

    This is possible to be calculated only from the Forex strategy tester EA Studio.

    Zero is when our equity line doesn’t touch this regression line. If it is 100 this means that all of the points are on the regression line. Meaning that our balance chart should look like one straight line and this would be the perfect line but in our case, in trading. This will be if we have only two orders executed, right? So if we have two results obviously we will see one straight line and this will be R-squared 100. So if we have more count of traits, obviously this is impossible.

    This is why if we are using the Generator.

    Let me switch to the Generator of Forex strategy tester, and I go to generator settings and you see here in search past we have now the option R-squared. That’s why it is good to combine it with common settings. Minimum count of trades it should be at least 10, right, to avoid having two counts of traits for the tested period. Of course, a bigger number is better. I normally keep it to 300 minimum count of trades.

    Now, having it in the Reactor allows us to generate strategies that are having better and better equity lines. So the bigger number of R-squared we have a better equity line we will have because it will be closer to this regression line. So here with this strategy, we have our R – squared of 77.35.

    Let me show you how strategies look when we are having bigger R-squared. I will just bring from my next screen another reactor that I was running. And because I was using R-squared as an optimization. Combined with the out-of-sample:

    Forex strategy tester as Оoptimizer
    OOS and Optimizer results in great strategies

    You can see here I have R-squared of 95.99, 88.09, 89.16.  Here the equity line is getting much closer to such a regression line but of course, it is not a perfect line. Which as we said is possible only if we have two points or two orders when it comes to trading. So one more time using R-squared in the Forex Strategy Tester allows us to have better equity lines

    Where you can use it in EA Studio Forex strategy tester?

    One thing is in generator settings. You have search best, and most common is to use it by Net Balance. There are different options but now we have R-squared as well. So no matter you are using out of sample or not if you run the generator it will look for strategies that are having better R-squared, right? No matter what the R-squared value is.

    But if you want, for example, to have a predefined R-squared you can set this from the common acceptance criteria. So I will click on it, the Generator will use the common acceptance criteria. And when I go there I will add it as an acceptance criterion and I will add for example R-squared minimum of 70.

    Let me just go back now to the Generator and I will press Start. And you will see that it will generate the strategies that are having minimum 70 as a value for the R-squared.

    Alright and here is the first strategy from the Forex Strategy Tester:

    nice results form the beginning
    The first strategy is with a great equity line

    So you see the balance line is really stable. It looks nice, there are no huge stagnations. The bigger the R-squared is as well we will have smaller stagnation. If you play around with the Forex strategy tester, you will see that.

    We will not have these huge drown downs in the equity and you can see the more the reactor works the better strategies it shows. Because in the Generator settings we have selected “search the best method to be R-squared”.

    What is a good Forex strategy?

    • R-squared of 92.64, which is very good
    • the maximum stagnation is just 13.5 percent
    • we have a huge number of count of trades

    Alright, and if I click on edit I will go to this strategy. And you can have a look at the entry and exit rules for this strategy.

    Now the other thing what you can do to use the Reactor.

    I will stop the Generator and I will switch to the Reactor in the Forex strategy tester. Now instead of having it “search best by R-squared” I can go back to net balance which I said is most common because at the end of the day we are looking for strategies that are bringing us more profit. That’s why we want the Generator to generate our strategies that are having the most net balance.

    And now as acceptors criteria here I will remove the R-squared but I will increase the minimum net profit. Let’s say I will increase it to 100, for example. And then I can use optimizer which will actually optimize the strategies according to the R-squared. So they will be generated from the Forex Strategy Tester as a search best but for net balance and then they will be optimized according to R-squared. And here you can select as well if the optimizer should use the common acceptance criteria that we have. So if I press at Start. You will see I have Generator then the strategies from the Generator are going to the optimizer:

    Forex strategy tester combined
    Reactor = Generator + Optimizer

    There is already one strategy but I didn’t clear the collection so I cannot see which strategy was that. Let me see now the next strategy that will go into the collection. Here it is! You can see the strategy and another strategy coming up. So these strategies were generated according to the net profit and they were optimized according to the R-squared. And once again you can select this from the optimized strategy section where it says optimization if you have selected. Then the optimizer will work and the search best method will be according to R-squared if you decided.

    So one more time as a conclusion

    What is a Forex strategy tester?

    • software that allows us to backtest strategies for a predefined period of time
    • generates strategies over the Historical data of the selected broker
    • filters the strategies according to the chosen acceptance criteria
    • allows the trader to export the strategies with one click as Expert Advisors
    • has a detailed statistic about each strategy and it is easy to see the details
    • by using the R-squared we get strategies that are having better equity lines
    • we remove huge stagnations(the period when the strategy does not make new profits)

    Trading with EA Studio Forex strategy tester is one of the only ways that you can be profitable with algorithmic trading. Many traders learn to code in order to program their strategies, and many developers learn to trade. Most of the time this does not give any results. And you do not need to do it, because it will take you years…

    With EA studio you do not need to have any trading or programming experience.

    It does all the job that is needed. It generates strategies, so you do not need to have any profitable strategies. And many traders realize that their strategies are not profitable when they build them with the Editor in EA Studio. Most traders start to believe in strategy after it has few profitable trades. After that when they see the losses they find different reasons and explanations, they twist and change the strategy in order to keep it profitable.

    The great thing with EA Studio Forex strategy tester is that it keeps being updated. It is programmed from Forex Software LTD and these guys keep working on it all the time. All licensed members receive all updates for free for a lifetime. This increases the value of the product with the time.

    The lifetime license to EA Studio allows the trader to take his time, to practice as much as he wants, to build his portfolio of Expert Advisors slowly and steady, and after that just to benefit from the work he did.

    Thank you very much for reading this article and let me know if you have any questions about the R- squared or anything else about the Forex strategy tester EA Studio.

    You can always write any questions to our trading forum.

    Also, you can register for 14-days free trial on EA Studio from our website and try this great Forex strategy tester!

    Always enjoy the trading. Cheers!

  • MACD indicator and the Oscillators: Meta Trader

    MACD indicator and the Oscillators: Meta Trader

    MACD indicator – the favorite indicator from the Oscillators

    MACD indicator is one of my favorite indicators in trading too. Hello, dear traders! My name is  Petko Aleksandrov and I continue now with the MACD indicator and the Oscillators.

    What are the Oscillators?

    These are indicators that show price deviation from its average value. So we have I think twelve indicators in Metatrader as Oscillators. So let’s see one, two, three, four, five, six, seven, eight, nine, ten, eleven, twelve. Actually, they are thirteen:

    MACD indicator among the others
    Oscillators indicators.

    Alright, thirteen Oscillators. So probably here I will divide it into two parts, in two lectures. And I will go through each one of them. So you can have an idea, if you really beginner trader, you can have an idea of

    • How does each indicator work?
    • How we use it in trading?

    And I’m not going to go into very deep details about each indicator because as I’ve said there are many different strategies with each indicator. And if you are interested in any of the indicators you can look for it online. You will find so much information.

    I just wanted here in this course to give you systematically information about each indicator. So you’ll have an idea, and if you like any of those you can start using it or you can look for some more different methods of how traders apply the indicator.

    The first Oscillator indicator and this is the MACD indicator.

    As well one of my favorite indicators in trading, in manual or Algorithmic Trading. It’s a really useful indicator. What we have here is the MACD line and the signal line. So the red line is the signal line and the MACD line is the line connecting these bars. So just imagine that you have a line over here it connects the bars and this will be the MACD line. And sometimes you will see two lines MACD indicator, but for Metatrader the default indicator is displayed just this way.

    What signals gives the MACD Indicator?

    • the divergence, which I have already mentioned to you
    • it has the overbought and oversold areas
    • as well one of the strongest signals is when the MACD line crosses the signal line upwards, this gives us a buy signal

    When it crosses downwards it gives us a sell signal. And you see here, for example, we have very good examples right here, the MACD crosses. So here we might buy and then here we might sell and then here we might buy and here sell again and here buy again up till here and so on. And there are many different strategies that I was using.

    Here I will give you a small tip that if I buy using the MACD indicator I would like to exit not on the opposite sell signal but when I see the first smaller bar than the previous one.

    MACD is the best indicator
    MACD indicator in Meta Trader

    So for example, if I was going to buy over here on this cross the MACD crosses the signal line. I will buy here I would like to exit on this candle here and not over here on the next cell. Because you see I would probably lose my profit. And now if here I have the sell I would like to exit on the first smaller bar than the maximum one. You see they’re all getting bigger and bigger and bigger. And then here I have this smaller bar and you see this is just on the second candle that shows the end of this move here.

    Now the MACD indicator was used as a solution of the moving averages.

    First, it all started with one moving average, then the second moving average. So cross of the moving averages and then because two moving averages are not enough to have a good signal for entry the solution came as MACD or this is as well known as the Moving Average Convergence Divergence Indicator. And the MACD line actually is the difference between the 26-period and the 12-period exponential moving averages. And we have the signal line, which is a nine-period moving average of the indicator, okay, of the MACD indicator.

    The second Oscillator, that we’ll go through is the Average True Range.

    This indicator shows volatility on the market. When the indicator is at a low value, meaning that there is no volatility, you can see here the market is at a range, and below the ATR or the Average True Range Indicator is with very low value. And when there is some volatility you can see the price drops then the indicator goes upwards.

    So no matter if the price drops or it rises the indicator goes higher whenever there is volatility. This is quite different from what we have with the MACD indicator. And most of the time you will recognize that when the price falls it will rise extremely because normally this is called panic on the market and normally the price always falls faster than it rises. Because this is a result of emotions in most of the traders’ investors. When they panic they sell it off and the price drops dramatically. So most of the time the ATR rises when there is a sell-off. When the price falls down.

    I will remove none of this indicator from the chart and I will go to the next one. I click on insert-indicators Oscillators and the next one is…

    The Bears Power

    You will see the Bears Powers is represented in bars that are just below the zero line and that are above the zero line.

    This indicator was created by Aleksander Elder and it was presented at his book “Trading for a living”, I do believe was the name. And he described it there as a constant battle between the buyers and the sellers every day. Because normally what we see at the moment for any price we can say it’s that a great price for the moment between the buyers, those who want to buy, and those who want to sell. And we can say the price is just where it is right now because this is where the buyers and the sellers agreed. This is where they meet, we can say it this way.

    So Mr. Elder developed this Bear Power indicator as a difference between the lowest price and a 13-period exponential moving average. As you see I’m using here the default 13. So the indicator represents the difference between the lowest point and this 13-period moving average, actually exponential moving average.

    Normally this Oscillator indicators is used together with some trend indicator. Also, MACD indicator could be used as trend indicator.

    With simple eyes here we can see that when the price is going down we are below the zero line and when there is some kind of reversal, you can see we have the bars above this zero line, and when the price is in a range it goes above the zero, below the zero, above the zero. And this is where you will struggle. So that’s why it’s good to combine it with some trend indicator. Such as a moving average just to confirm the trade direction.

    Alright, guys, I will remove this indicator as well.

    I’ll go to the third Oscillator that we will have in this lecture.

    And the third one is the Bulls power. After the Bears power, we will have the Bulls power.

    Which is developed again from Mr. Elder and it’s just a very opposite, I can say, it is the difference between the highest price and the 13th-period exponential moving average. And for this indicator, he says that the highest price displays the maximum buyer’s power within the day. This is when we have a maximum fourth day or when we have a minimum. This is the maximum power for the buyers on the top and for the sellers on the bottom.

    Тhe Commodity Channel Index

    MACD indicator is better
    A great signal that the price might change

    I will click on OK and you see here we have two lines we have the zero level and on the top, we have the 100 and below we have the negative 100 level. This indicator as well is known as the CCI indicator. And normally the traders use the CCI by looking for divergences.

    So what is the divergence?

    Just as we have it with the MACD indicator. This is the situation when the price reaches a new maximum, let’s say a new bottom. And the CCI fails to have a lower bottom. A lower low than the previous one. Same on the other side on the top, the price reaches a new maximum but the CCI fails to have such a maximum. I will just look for some examples. Let’s have a look at this example. I think this is a good example here. So you see the price goes down, it falls as well. The CCI is going down. It has this lowest point here. Then the price makes another lowest point. You can see this low is lower than this low, I will take the crosshair to make it easier.

    So here we have the first low. Then the price makes another low, lower than this one, but the CCI you can see makes a much higher low than the previous one. This is called the divergences here and it gives us a signal that the price might change in direction. And you see after this fall the price went higher. And as well the CCI is used for overbought and oversold situations.

    If the line is above the 100 we say the market is overbought, if the line is below the negative 100 we say the market is oversold.

    We can expect change at any moment. And when we combine the divergence with overbought and oversold we have better signals as in this case you see this divergence situation is outside the negative 100 and 100 range. So in the oversold or in the overbought areas, we have much stronger signals.

    Alright, so this is the CCI indicator. I will remove it from the chart and I will proceed to the next Oscillator indicator, which is…

    The DeMarker.

    I will click on okay and you see it displayed here very very similar to the previous one, as an outlook. But you can see it is between zero and one and we have two lines of 0.3 and 0.7. With simple words for this Oscillator indicator is that it compares the maximum for the current bar with the maximum of the previous bar.

    For this indicator, we can say that when the price is above 0.7 line we might expect that the price will reverse downwards and again when the price is below 0.3 we might expect that the price will go higher.

    And I will continue with the next Oscillator indicator and this is the Force Index.

    It is right over here I will click on OK and you see again it is displayed below. So probably you have already noticed that all Oscillators are displayed below the price. They are not over the price but in a separate window below the price.

    What we can say about the Force Index?

    MACD indicators stays the better indicator
    Force indicator in Meta Trader

    The first thing that it shows is that we might want to buy when it’s negative because you see there is a zero line here as well. And we would like to sell when this Force Index is above zero. And actually, the signal that is giving by the Force Indicator is when this line crosses the zero line. So let me put the line on the zero. I will need to double click on a tab go to horizontal line properties and for value, I will select zero. I will press on OK and you see it’s exactly there.

    So the sell signal comes when the Force Index line crosses the zero line upwards. This gives us a sell signal and when it crosses on the other side it gives us the buy signal. This is how usually we use this indicator. Looks simpler to MACD indicator but the signals it provides should not be underestimated.

    So this will be the first part of the Oscillator indicators. In the next lecture, I will continue with the rest. And if it is your first time looking at these indicators you might want to test placing them over the chart and see how they look and just roll around with your crosshair to notice how each indicator reflects the change of the price.

    Personally me when I was starting trading I was spending so many hours just to look over the chart to place different indicators and to look for the moments when I would like to enter on the market and when I would like to exit. And actually most of the strategies that I’m using nowadays I have created those in this way looking and observing the market.

    Okay, thank you for reading and I will continue with the next article with the rest of the Oscillators.

    This lecture is free from the course called MetaTrader 4 Forex platform: Start trading with a pro trader

    If you have any questions don’t hesitate to ask me or you can write in our trading forum.

    Cheers!

  • Forex data import – EA Studio updates

    Forex data import – EA Studio updates

    Forex data import – the first important step is algorithmic trading

    Forex data import is the most important first step that every trader takes when starting with Expert Advisor Studio. Many traders made the mistake to trade with expert advisors that are created over different historical data. This leads to misleading backtest results which slip the trader to trade with expert advisors that are not suitable for his broker.

    Hello, dear traders!

    My name is Petko Aleksandrov from EA Forex Academy, and in this article, I will talk about some of the recent updates that we have with EA Studio strategy builder.

    So there are some changes in the interface, for example, we have the first page and now says home and it’s not EA Studio as it was before.

    Now if we look at this blue bar on the top we have the Forex data. So before the data was in tools, right over here in the menu, now it is on the top and it is much easier to find it right over here. Because it’s very important when you create your own strategies using EA Studio to create it with the Forex data from your broker. So it’s very easy to access to it just click over it and you’ll see it right in front of you:


    Forex data is easier to find
    Forex data new access button


    What is the newest about the Forex data import?

    • you can notice all the Forex data on the right side that you have imported from the brokers, that you have been using
    • we have the data horizon, and the data horizon looks just the same and there is a slight difference here
    • the maximum data bars, but this is only for the licensed users, is up to 500,000 bars

    I don’t know if this will last but before the maximum was 200,000 and now it is 500,000, but once again this is for the licensed users only. And if you wish to try that, if you are already licensed user of EA Studio you will need as well to modify the script for exporting the Forex data. If I go to the data import, right here are the scripts. And once you download one of them, depending on if you use MetaTrader4 or you use MetaTrader5, you need to drop it on your platform right over here:


    forex platform
    The path to place the script to export the Historical Forex data.


    For the people who didn’t do it so far, you need to go to file- open data folder and then you go to MQL4 and you go to scripts. So this is where you need to paste it. After that, you need to refresh the scripts and you will see it below over here.

    What you will need to do if you want to increase the number of bars that you will be exporting?

    Right-mouse and you go to modify. This way you will open the Meta Editor and here are the maximum bars. So you will need to enter 500,000 and you compile it and it will be saved. So if I close the Meta Editor and I drop the script over the chart you will see actually there will be 500,000 bars to export. And this is quite a lot of data.

    Not all the brokers will provide you with such Forex data. You will probably need to collect it a long time and with the higher time frames, you will actually never get this data. But with the lower time frames, you might have such huge Forex data, if you are interested to try it out. Once again I’m not sure how long it will last if they will keep it from the Forex software company.

    Then what we have is the data statistics.

    This is something new over here. We have statistics for the data. Now let’s load some Forex data, meaning that I will go to the strategy and I will just change a couple of time frames. For example, let’s go down to M15 and let’s choose some of the data that I have, for example, from the Pepperstone demo server.

    Absolutely this strategy started to lose because it was for the EURUSD and I just changed it to Bitcoin and Ethereum. So let’s have at some Forex data that I have. With Pepperstone, demo zero two has some Forex pair. And as well I will go to JFD demo data and I will go to EURUSD. So here on M15 you see the strategies losing I will go to M30 and I will go to H1. This is where originally this strategy was created, so you can see better results.

    Now if I go back to data you will see in data statistics that I have already many loaded files. So all the servers that I have switched in the strategy, they are shown now in the data statistics.

    What is most important about Forex data import?

    • to have the market information about this broker
    • about the asset we want to trade
    • about a timeframe we have selected to use

    So you can see the specifications that we see normally in MetaTrader.

    And then we have statistics for the Forex data this is something very very useful:


    Forex data statistic
    Data statistic


    At first, we have the minimum price and then we have the maximum price. For this period that we have for EURUSD on H1. Then we have average gap 2 points, which is pretty normal for Forex data. Then we have a maximum gap, which you can see here is 200 pips nearly 2000 points, which is 200 pips. Well, I cannot really say what’s going on here. Because for H1 it’s not really normal to have such a gap. Maybe it is something between Friday and Monday but 200 pips is really a lot.

    Here is some more Forex data statistic that we see for this strategy:

    • average high-low we have here 17.1 pips
    • maximum high-low we have 250 pips
    • average close-open 8 pips
    • maximum close open 229 pips or 2290 points

    Now here is very interesting: maximum days off.

    Meaning that the market was not open for some reason. And as you know the market is opened from Monday to Friday with some of the brokers on Sunday. And there are some exceptional cases around the holidays but you should normally not see more than three days. Two, three, four days. If there are more you will probably need to recheck your data and see. Because probably there is some missing information or some missing period and I noticed such a thing I will just check around the loaded files that I have.

    So let’s go to the USDJPY on JFD on M15, yeah, you can see maximum days off 41 days. There is something here with the Forex data. On M15 there is some missing period with 41 days. This is more than one month. And from these statistics, I can see that there is some data actually missing for this period of time. Now you can see the average gap here is one point, which is just great and then you can see the average high-low, the maximum high-low, and the other statistics. So this way you can check your Forex data once you upload it.

    Once you export it, first from the MetaTrader. And then you drop the files here and you can check if your data is alright. Because till now we didn’t have this statistic and there was no way to understand if there is something wrong with our data. For example, what I have shown on USDJPY on M15 that there are 41 days off. One more time this is a missing period in the Forex data, so I need to recheck it or to re-export it one more time.

    So this statistic is really really great update.

    We can check if our data is proper and we can use it. But here as well I noticed that the maximum gap is 5936 points which is 593 pips as well very unusual especially for M15. And I guess this is from the missing period in the data.

    So imagine there is Forex data from one day to another then there are 41 days missing data. And then these data continues, which will form a gap. Let me demonstrate it to you very quickly. Let’s say this is the historical data or the price chart, I will just go randomly. And then we have Forex data for this period of time and then we have some missing data, in this case, is 41 days. So the program will recognize it like this:


    missing Forex data recognision
    Missing period on the chart.


    The program will continue on different price and it will continue. So this thing here the program will recognize it as missing period and it will consider it as a gap. Because simply there is no information for this period, in this case, is for these 41 days.

    Alright, I really hope that it makes it clearer. So once you drop your Forex data make sure to check the maximum days off. Very very important and as well the maximum gap and average gap. But if you have missing days in your data most probably you will have a huge maximum gap. Because one more time this is a data that is missing and the program, the EA Studio, recognize it as a gap.

    One thing more here…

    We have this “release data” button. So if I click on it you will see I will clear all these Forex data because it was saved on the computer and I would just want to remove it. Or what you can do as well, is to reload the page, which will remove this loaded files.

    So how they come here once again?

    If you go to your strategy, no matter which strategy, and you just switch between any of the servers, that you have, or the historical data, that you have, from the different brokers. And you switch between different assets and timeframes:


    saved data
    Loaded Forex data.


    So let’s go for the Etherium. I will go to all timeframes and you will see that it will show in data statistics all these timeframes over here. And by clicking on each one I can see the statistics. And here you can see pretty good data for the Etherium because it has three days on M5, it has these nine days on M1, something is missing there about one month. But on the higher timeframes, it is just fine.

    So with this quick check, I know that there is no missing Forex data with this broker with all timeframes. Except on M1, which is nearly one month and with Etherium. And on M5, which is about nine days. But anyway I don’t trade the cryptocurrencies on such low timeframe as M1 and M5. But one more time I wouldn’t know that if the statistic is not here.

    Very useful and it’s the only way, actually you can understand if your historical data, that you have exported from your broker, is working fine.

    This is about the Forex data update in EA Studio.

    And one more thing here, we have the language bar moved to the home page right over here. So if you wish to actually edit the software somewhere between these languages or you can translate it in a totally different language, drop an email and we will explain you more. Actually, there are some benefits if you want to translate or help to edit the language in EA Studio.

    And, just to know you can test the EA Studio from our website. There is 15-days free trial which you can use from any device with an internet connection.

    Also, you can use EA studio without the 15 days free trial but you will need a trial if you want to export expert advisors so basically the trial version 15 days license which you can use to export an unlimited number of expert advisors. All the Forex data statistics and features in EA Studio could be used without having a subscription or without having the license for it.

    Thank you very much for reading! If you have any questions, don’t hesitate to write in our Trading Forum.

    Cheers!