Blog

  • Expert Advisor Generator: The Smart Algo Trading

    Expert Advisor Generator: The Smart Algo Trading

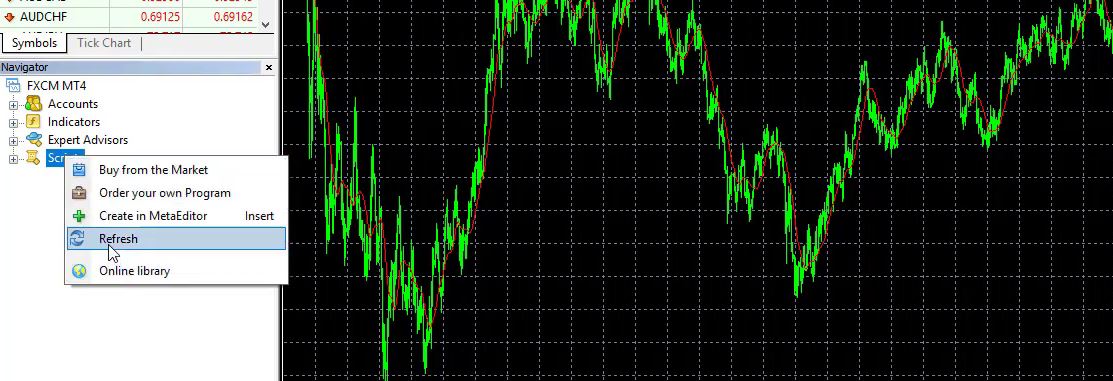
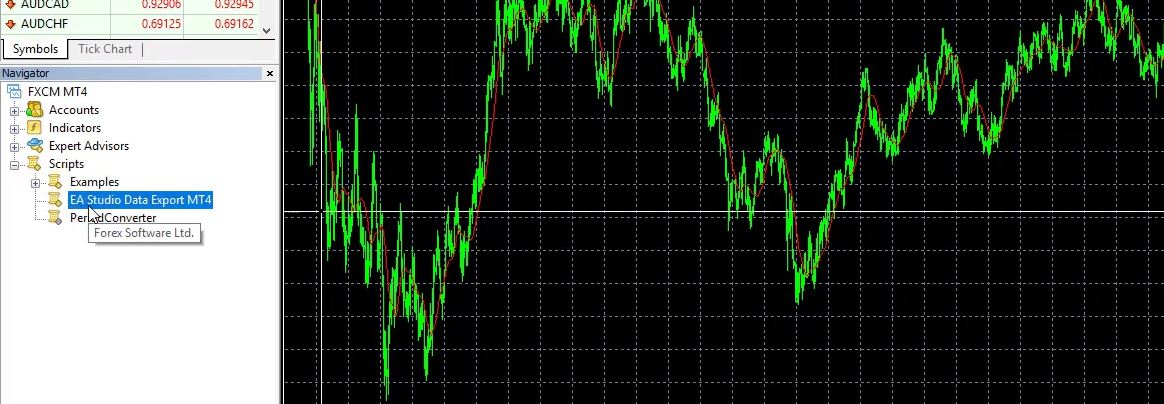
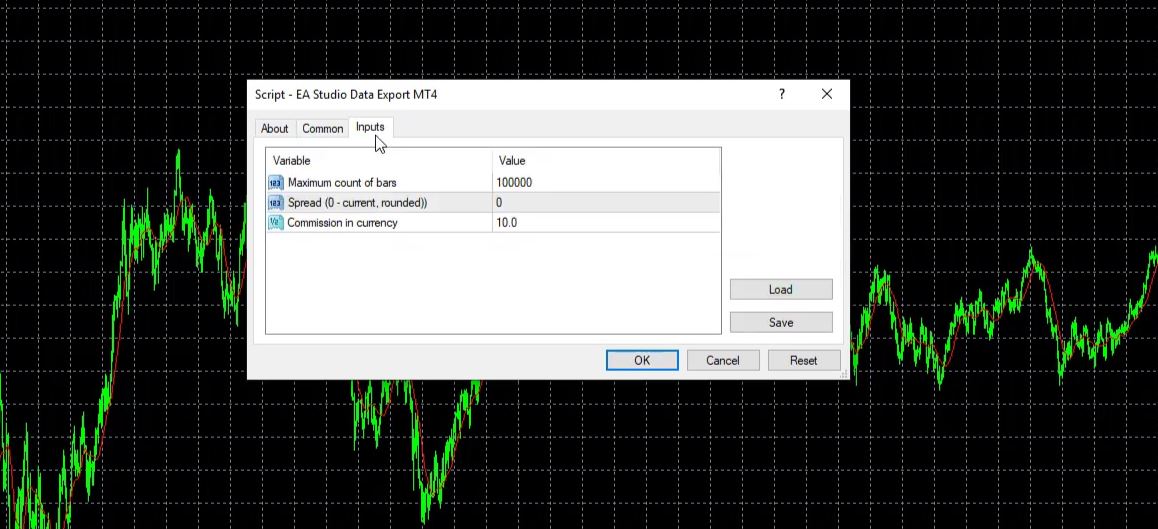
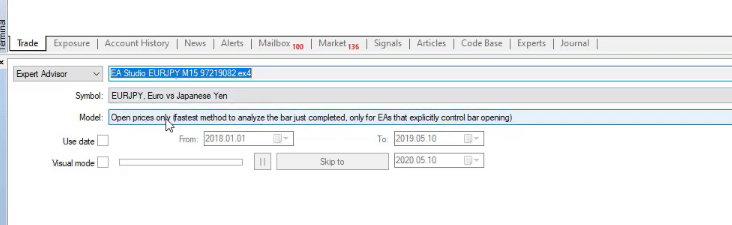
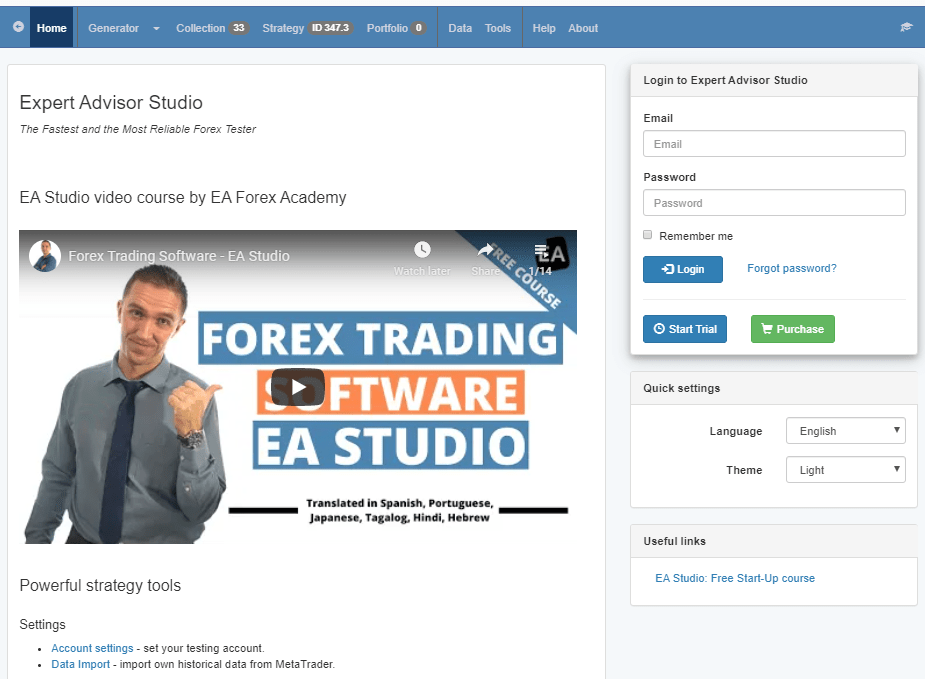
    Expert Advisor Generator EA Studio.

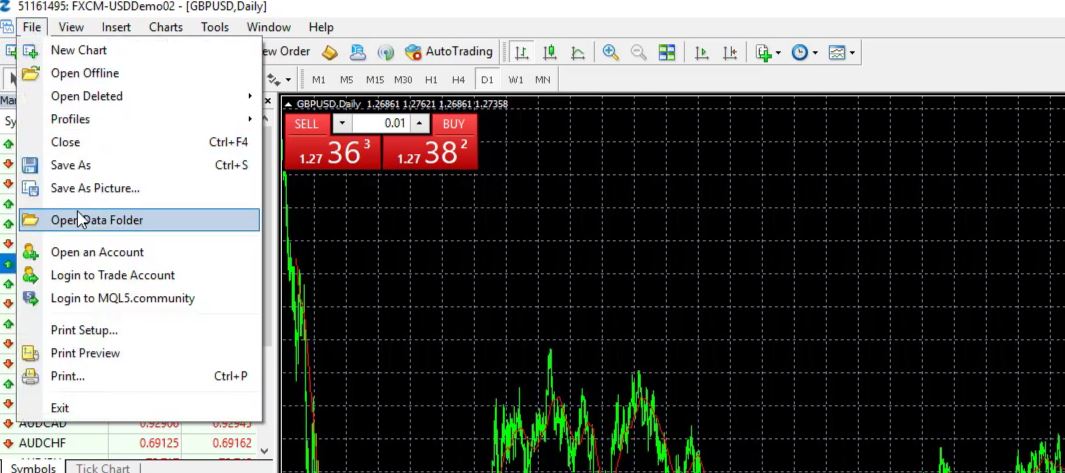
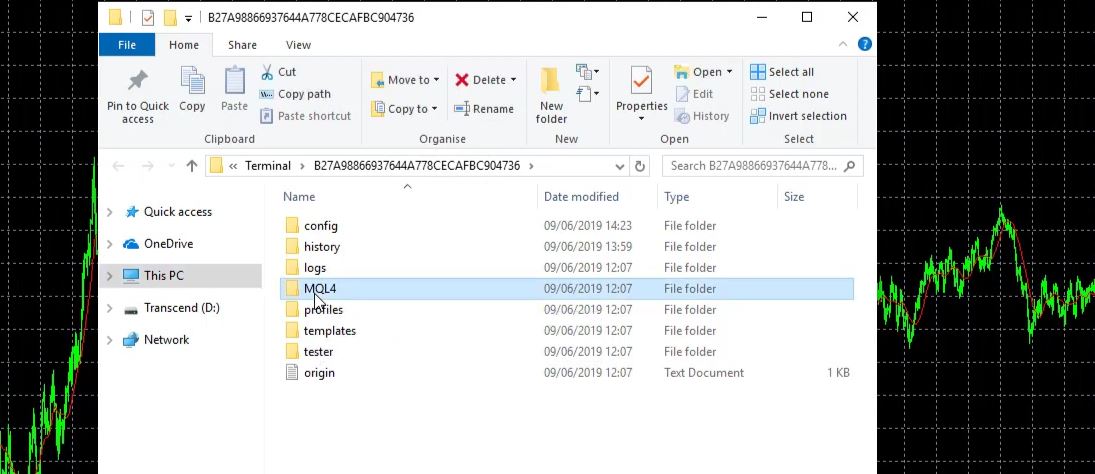
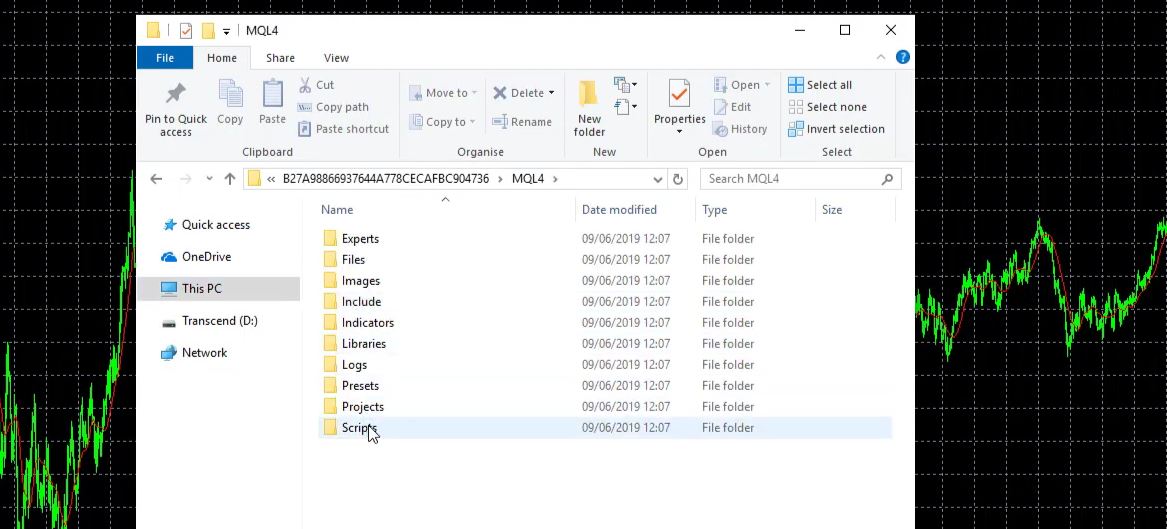
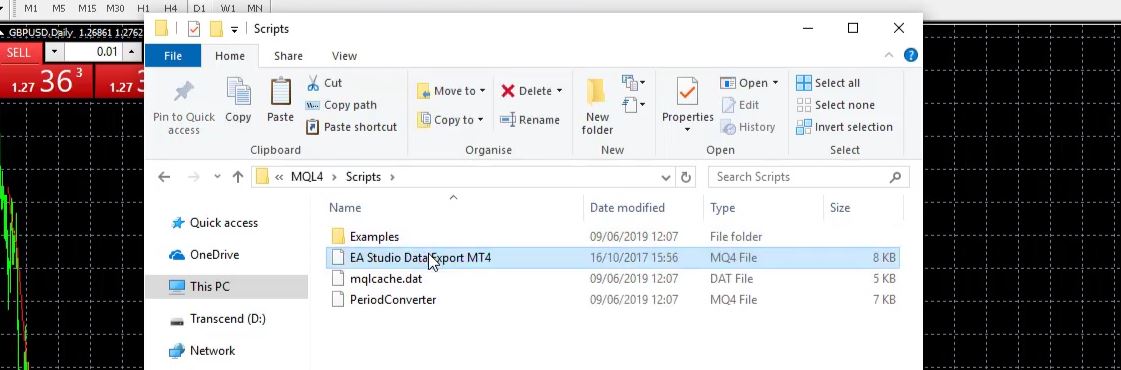
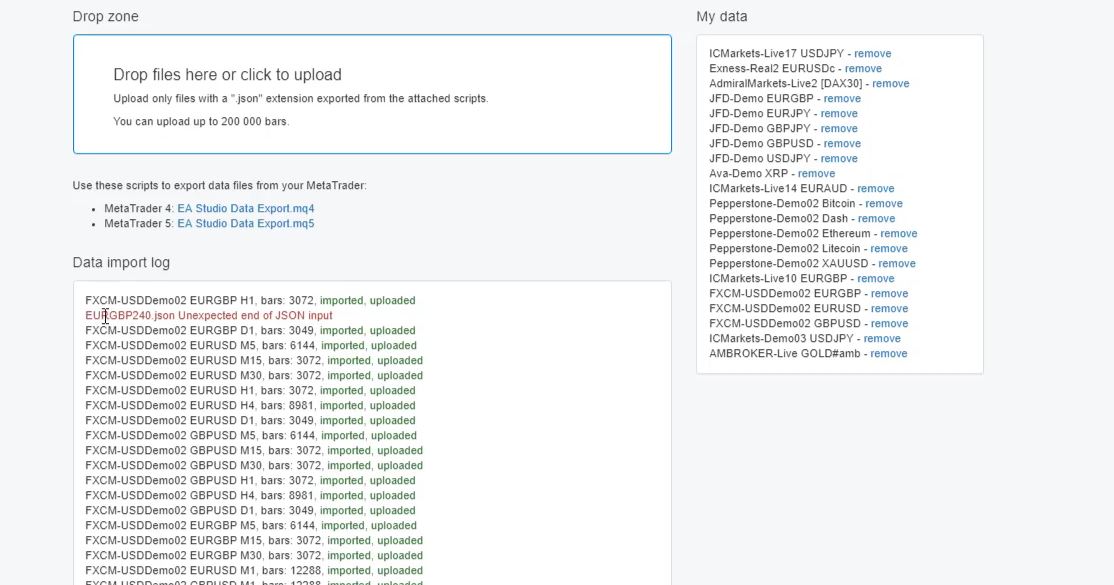
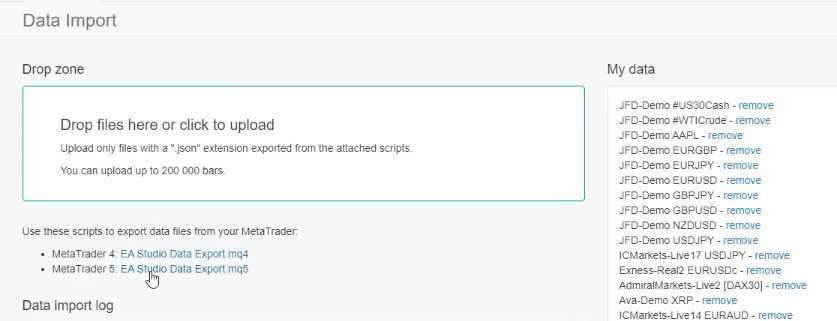
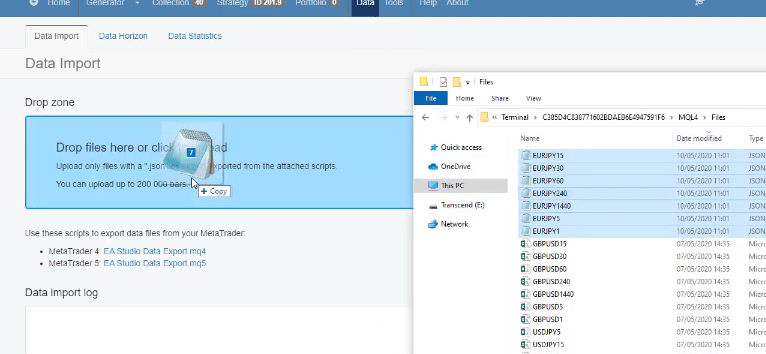
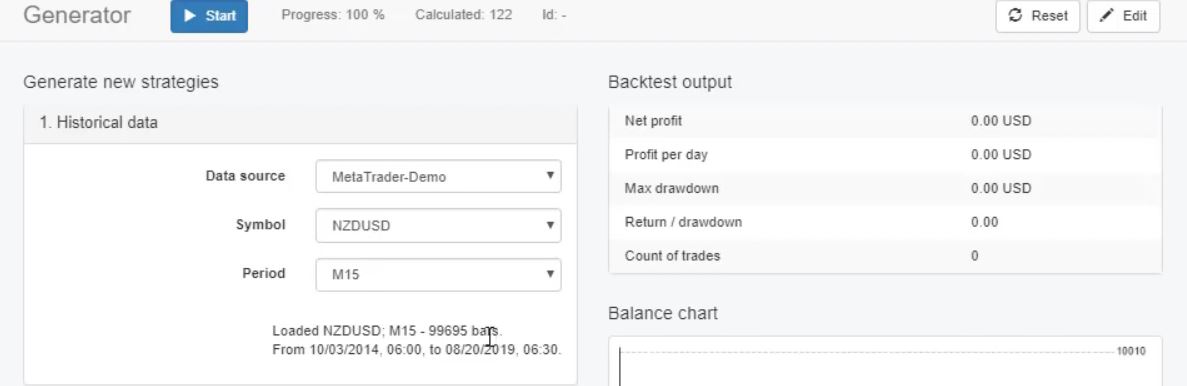
    Expert Advisor Generator is a great software that changed my trading. In this lecture, I will teach you how to use the Generator, which is, for me, the fantastic tool in EA Studio because it generates strategies over the historical data that we selected to use. So let me show you the generator. Now the first thing we have is historical data.

    expert advisor Generator
    Historical data.

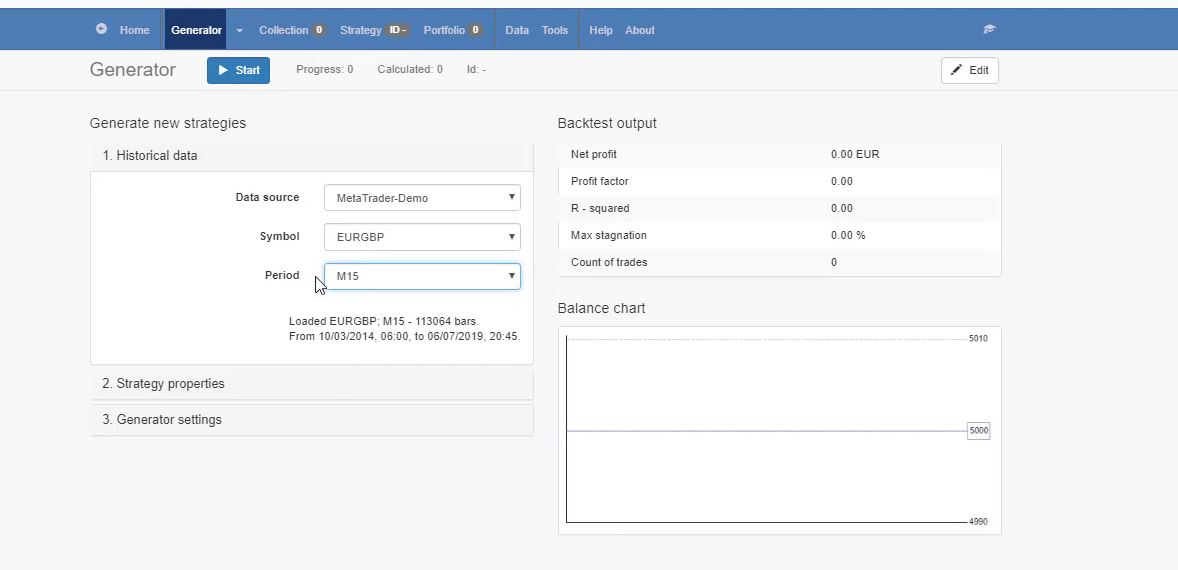
    Here, we select the data source or the data source from your broker, which you have imported in EA Studio. Then you need to select the symbol that you are planning to trade with, and then you choose the timeframe. For example, I will use the Expert Advisor generator for strategies on M15 for EURGBP.

    Keep in mind that it does not matter what asset and on what time frame you would like to trade. The EA Generator works over the Historical data that we import which means that you can trade any asset.

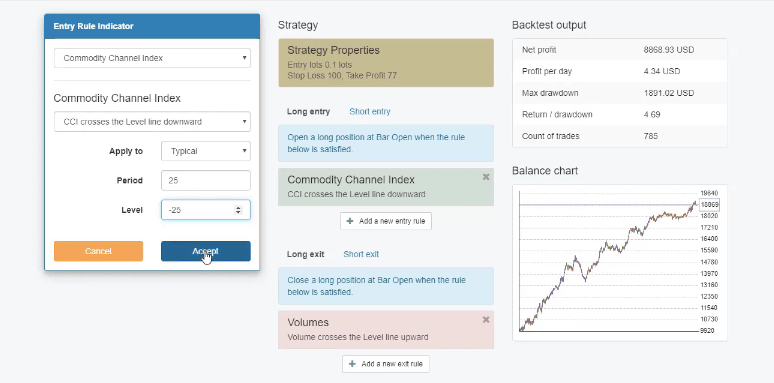
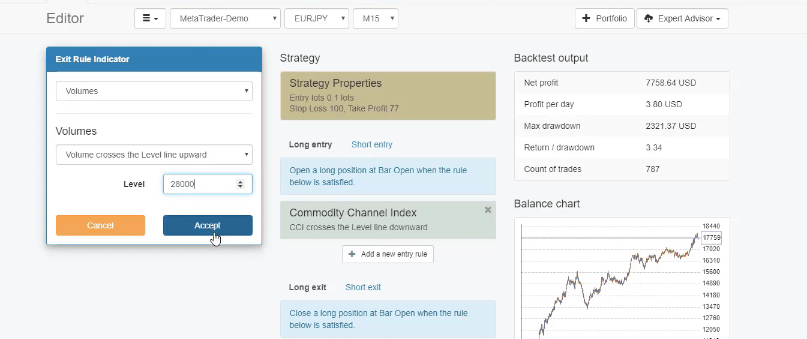
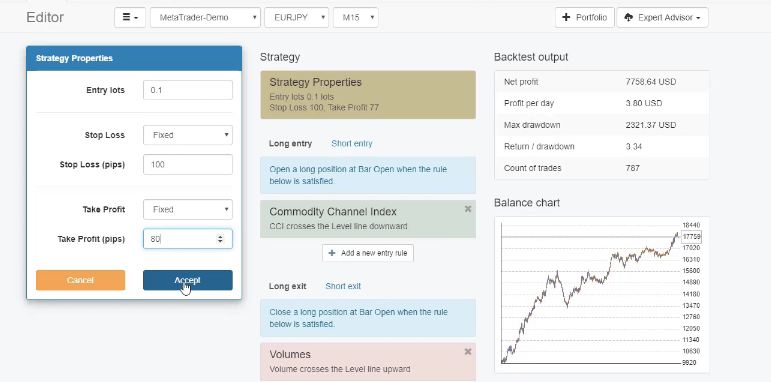
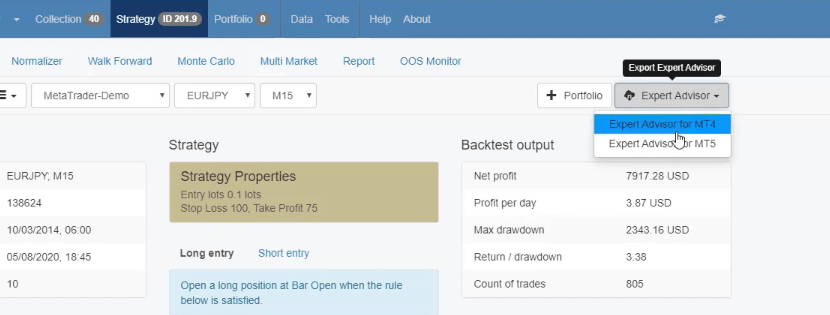
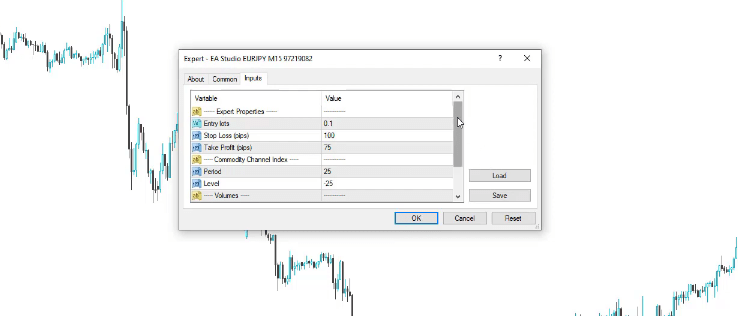
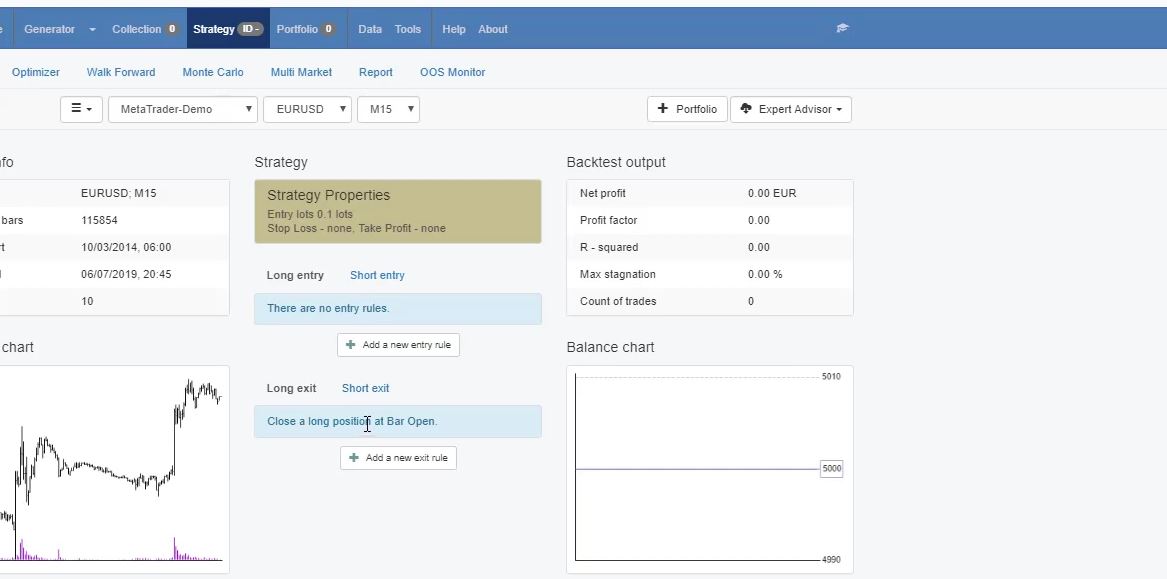
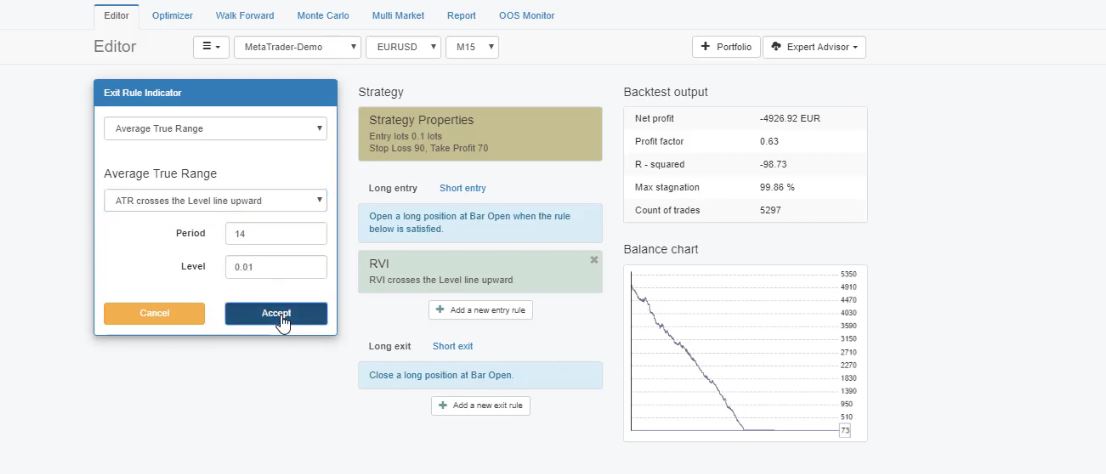
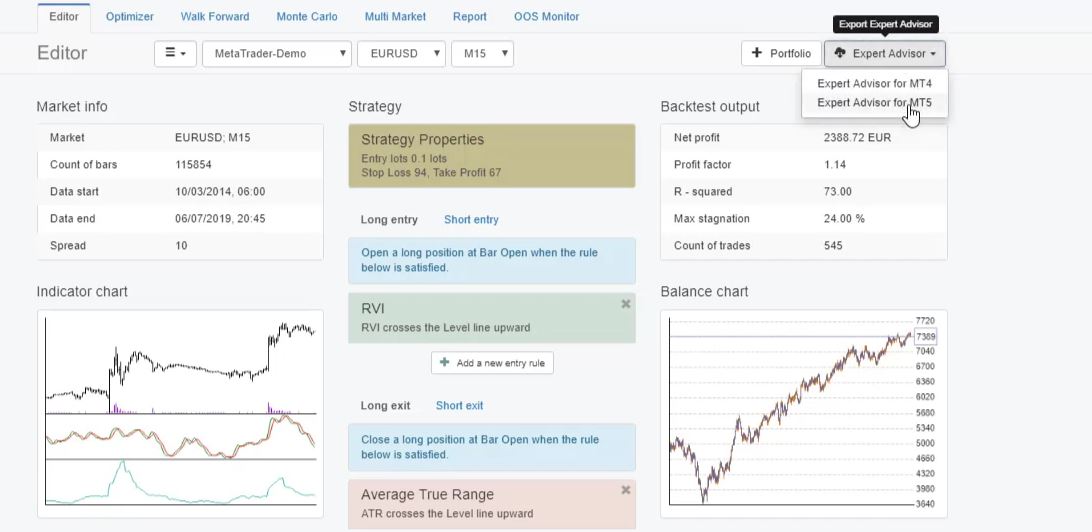
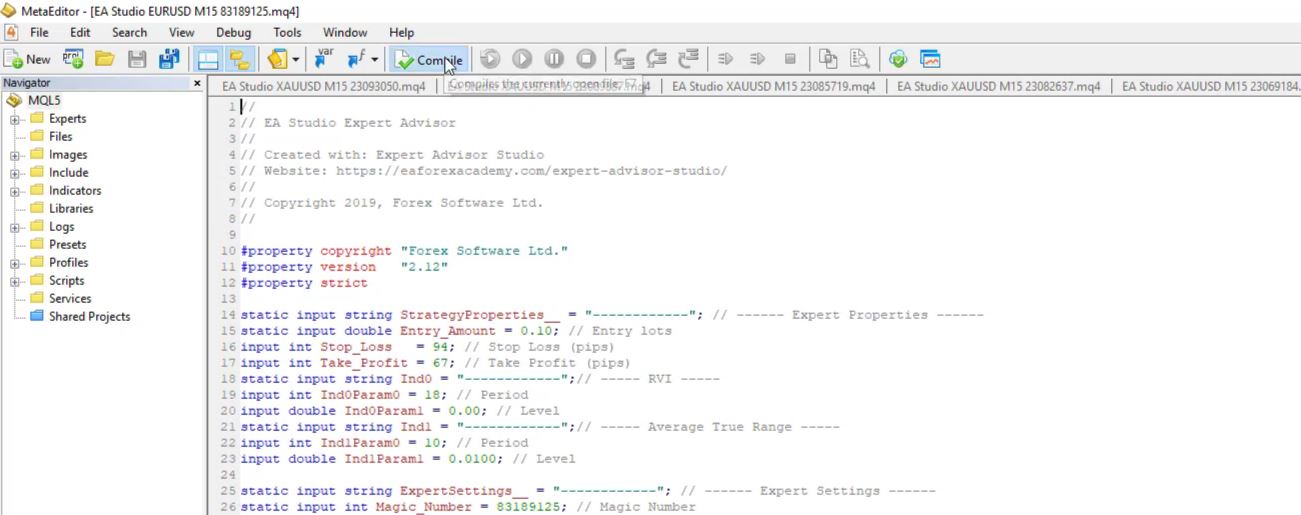
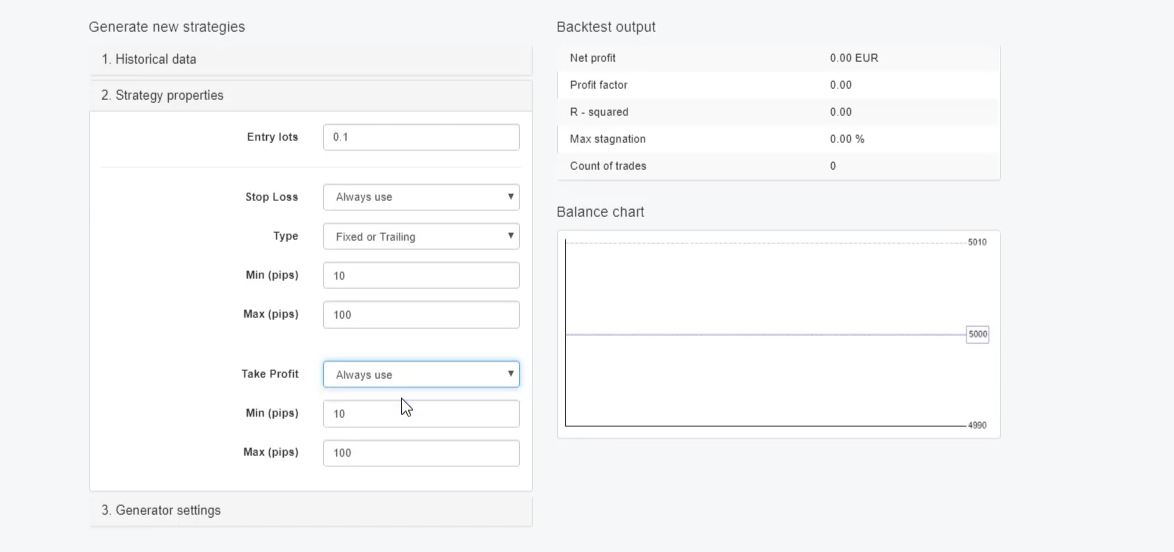
    Now in strategy properties, we have the entry lot. And after that, if you decide to trade with a different entry lot, you can change it from the inputs of the Expert Advisors.

    I will teach you that later on, when I place the Expert Advisors over the Meta Trader platform. And for Stop Loss, we have the option to use Always use, May use, Do not use. If we select Always use in every strategy, we will have a Stop Loss.

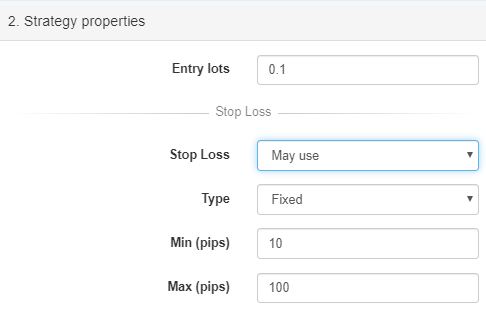
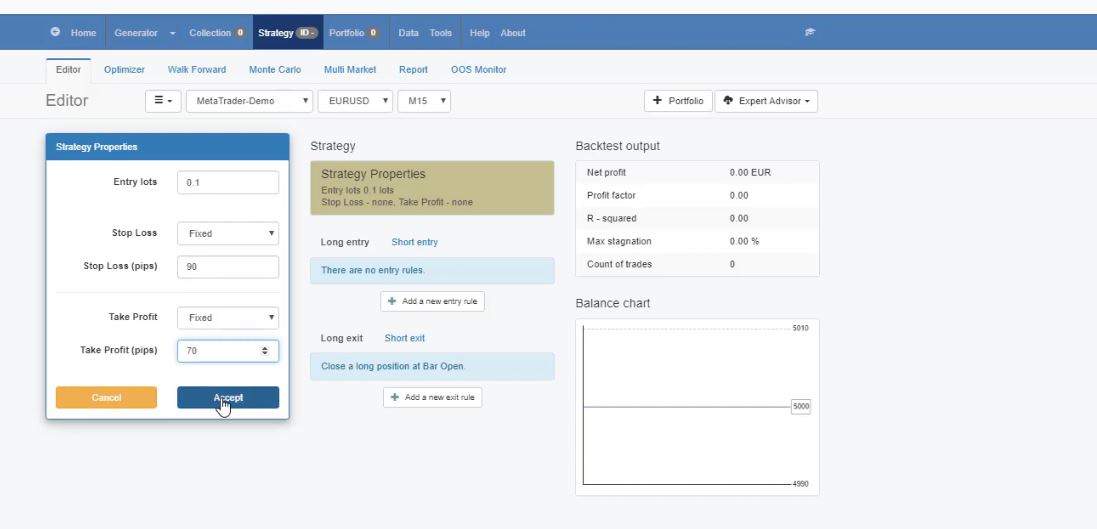
    If we select May use, this means that the generator will decide whether to place a Stop Loss or not. And Do not use, means that there will be no Stop Loss in the strategy. So I prefer to use Always use. As a type, you have 3 options. Fixed, Trailing, and Fixed or trailing.

    The 3 different types of SL and TP in Expert Advisor Generator.

    Now, Fixed means that you will have a fixed value for the Stop Loss. Trailing means trailing Stop Loss, and Fixed or trailing means that the generator will choose one of the 2, which will fit better for the strategy. I will leave it to Fixed or trailing.

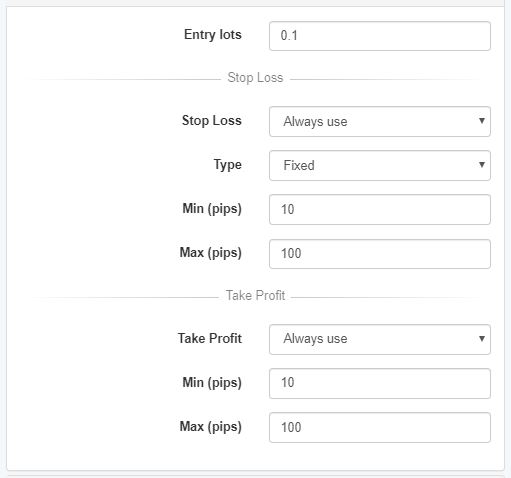
    So in some of the strategies, there will be a fixed Stop Loss. In some, there will be trailing. And there is the range. Now here, I use different ranges. Sometimes I leave it from 10 to 100.

    That means that the Stop Loss and the Take Profit will be between 10 pips and 100 pips. Sometimes I do it from 50 to 100 for the Stop Loss and from 10 to 50 for the Take Profit.

    2

    So I have Stop Loss bigger than the Take Profit. Or you can have Stop Loss from 10 to 50 and Take Profit from 50 to 100. But naturally, I don’t use Stop Loss smaller than the Take Profit.

    And I will tell you why because the old saying in trading where the Stop Loss should be 3 times smaller than the Take Profit for me doesn’t work well with the Expert Advisors.

    And this is very simple. When the trade is opened, if the Stop Loss is smaller than the Take Profit, obviously, the chance for the price to hit the Stop Loss first is bigger.

    I can say even 3 times bigger. A lot of people are using it, but I do not. And you will see that when you generate Expert Advisors, especially with a huge range. So you give it a range.

    Generator settings in EA Studio.

    From 10 to 100, you will see in many strategies that when the Take Profit is smaller than the Stop Loss, it works even better. One more time, because when the Take Profit is smaller than the Stop Loss and the trade is opened, the chance to hit first the Take Profit is bigger.

    Now I will leave it from 10 to 100 for both, and as well for Take Profit, I will select always use.

    Expert Advisor Builder
    The strategy properties.

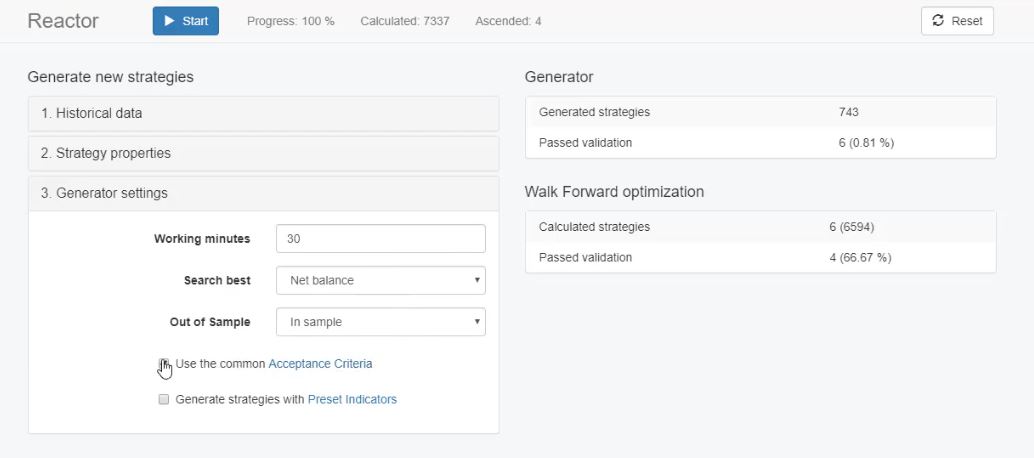
    As generator settings, we have working minutes. This means how much time we want the generator to be working. For example, I will leave it to 600 minutes, which is 10 hours and because it is Sunday afternoon.

    It means tomorrow morning, on Monday, I will have the generator ready. And this way, it will work for me overnight when I sleep.

    This is the best thing with EA Studio that I do recently and many of the traders I see in our forum are doing it as well. We run the generator for a long time overnight or during the day if you are working and in the evening you will have the ready strategies.

    Or you run it in the afternoon or in the evening and in the morning you have the strategies. Ready to export as Robots with one click.

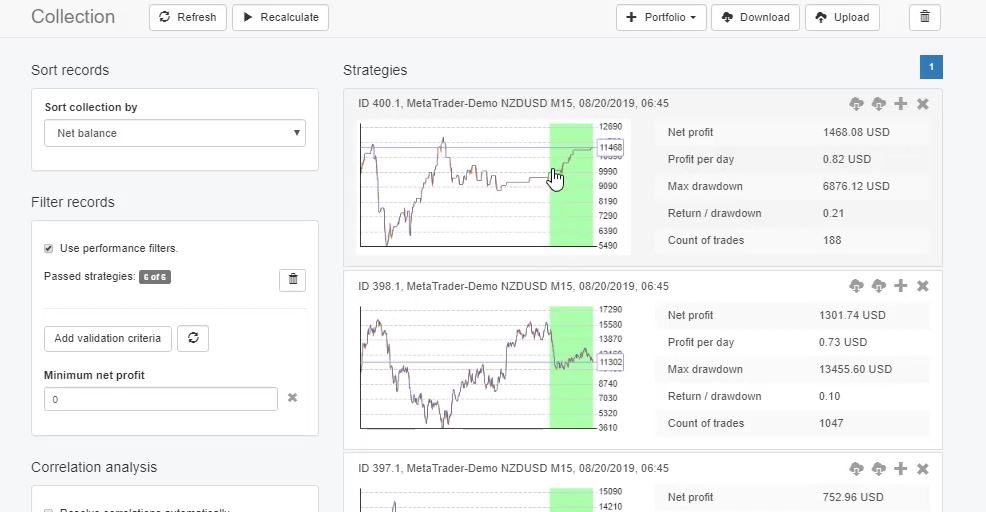
    So I will leave it to 600 minutes and as search best, you have different options – Net balance, Return to drawdown ratio, System quality number, Win/loss ratio and others.

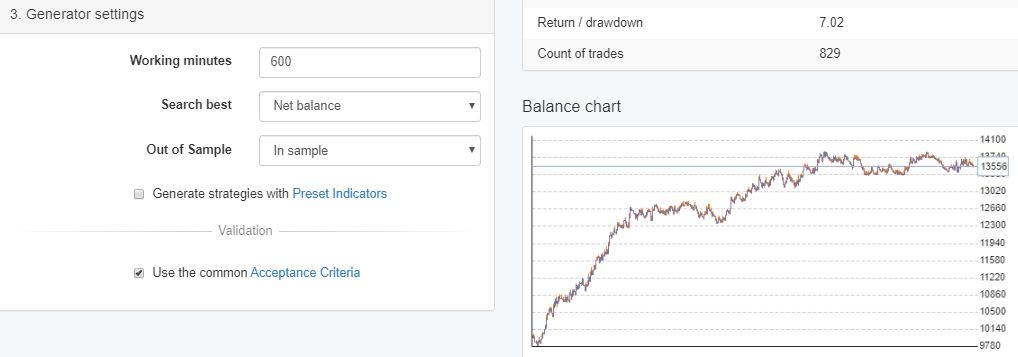
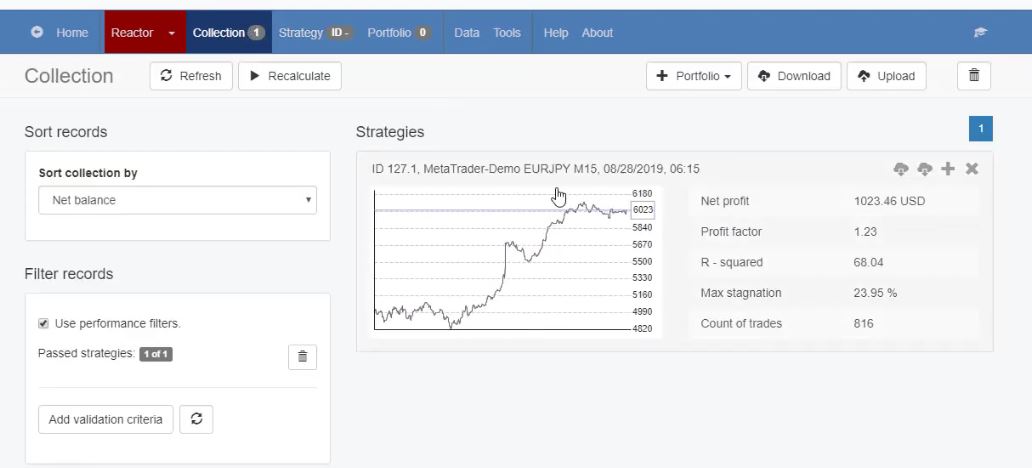
    Here I leave it to Net balance. This means that when the strategies are generated, I will see the strategies with the most Net Profit on the top in the collection.

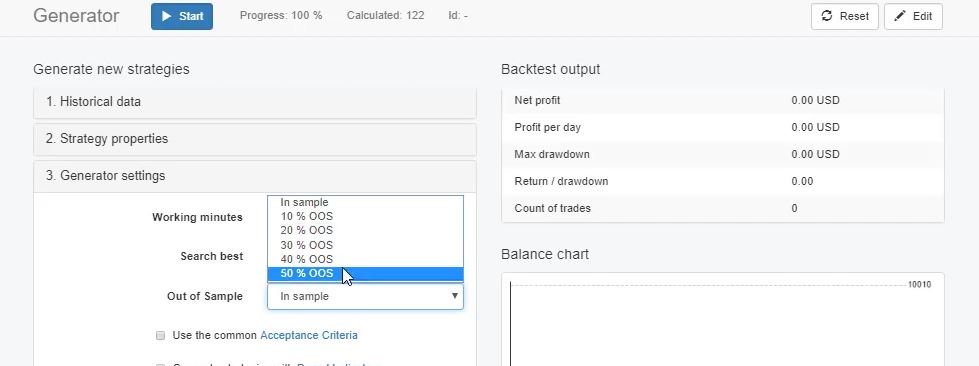
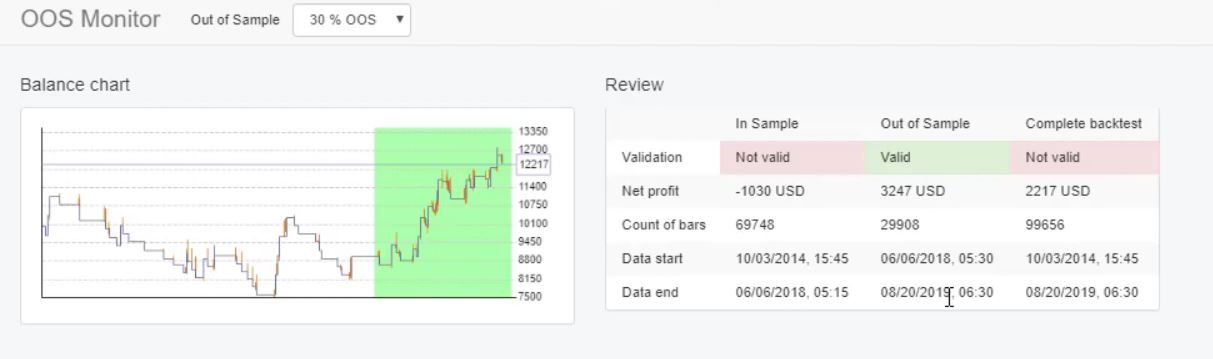
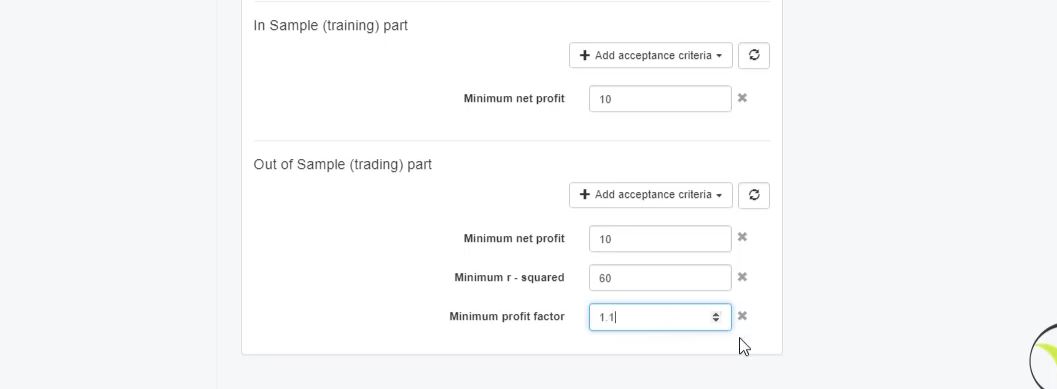
    In Sample or Out of Sample.

    Now we have the Out of Sample and we have In Sample. And 10% Out of Sample to 50% Out of Sample, this is something a little bit more advanced. I like to stay here with more basic. So I will choose In Sample. This means that the generator will use the whole historical data available.

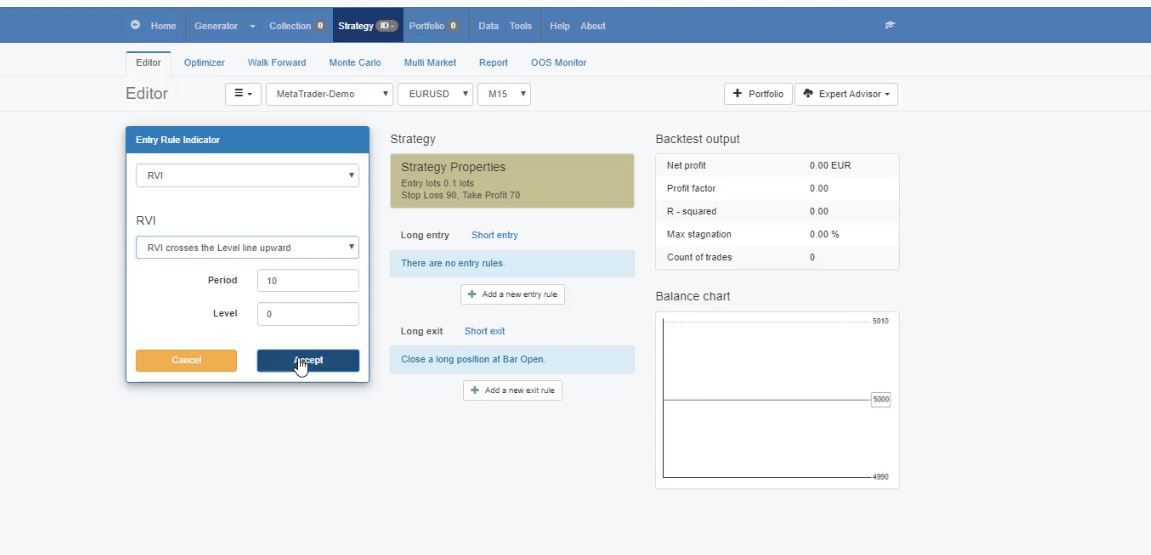
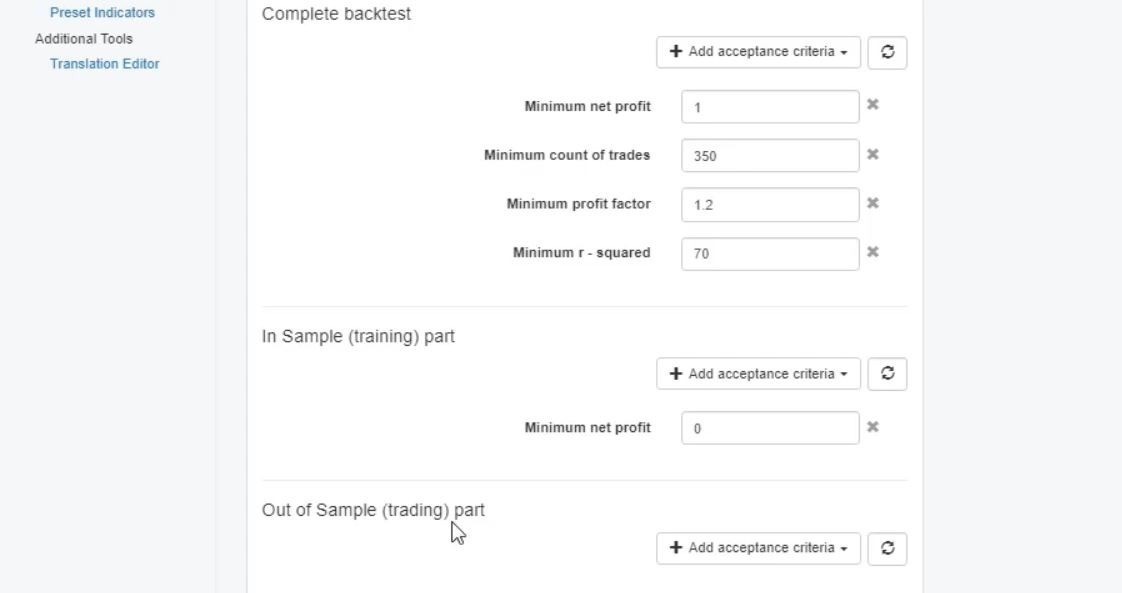
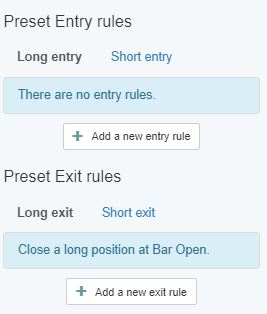
    We have used the common Acceptance criteria and the strategies use preset indicators. In tools, we have preset indicators where you can choose which indicators to be part of every strategy.

    Expert Advisor Builder

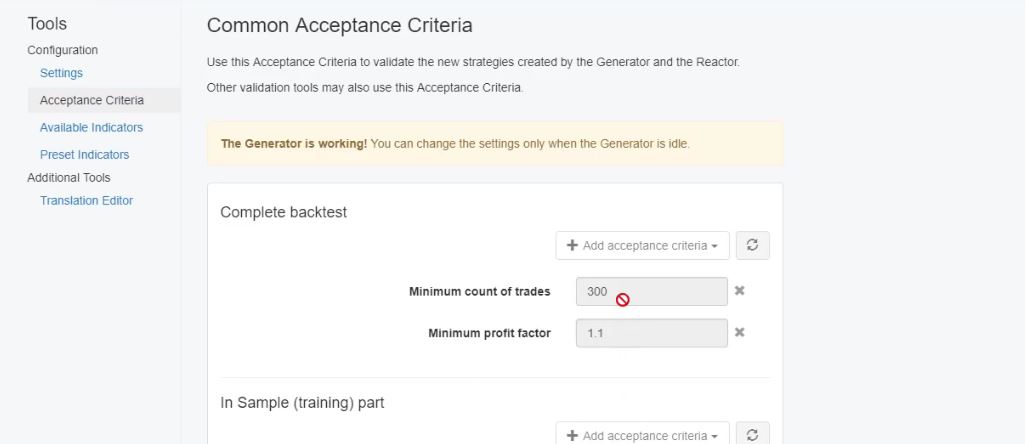
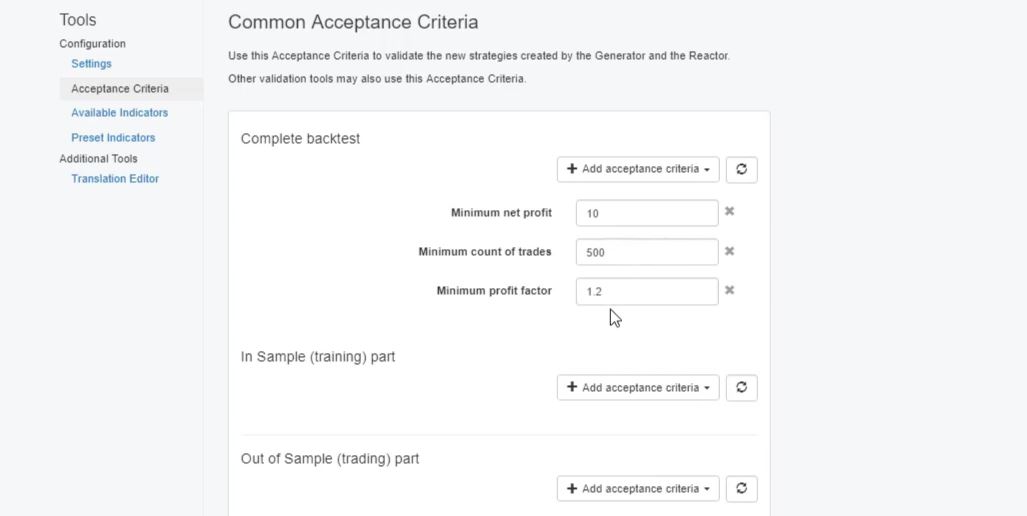
    I will not use it now. But I will use the common Acceptance criteria. I will click on it.

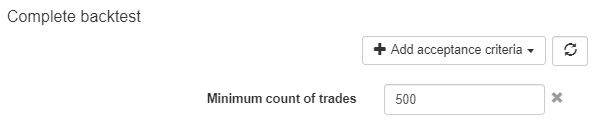
    Now, as default, it comes with a minimum Net profit of 10 which is a very small profit. Or at least it means that we want to have profitable strategies into our backtest.

    With a very small profit as a minimum. Now the minimum count of trades depends really on the historical data. If you have a small historical data like what I’ve taught with a new platform installed, then it will be hard for you to require a huge number of Count of trades.

    But for me, the minimum to go is 300. This is the bare minimum when I’m trading with the Forex strategies and the Forex Expert Advisors. Even now I will go up to 500, 500 Count of trades.

    And this is very important because the more Count of trades we have in the backtest, the more robust strategies we will generate.

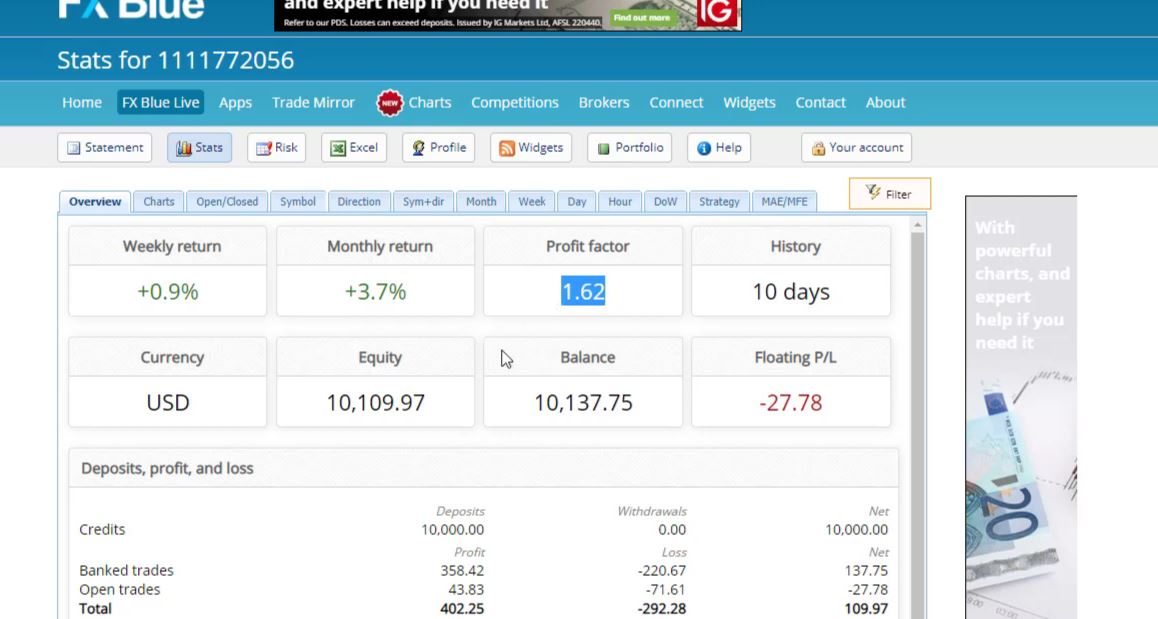
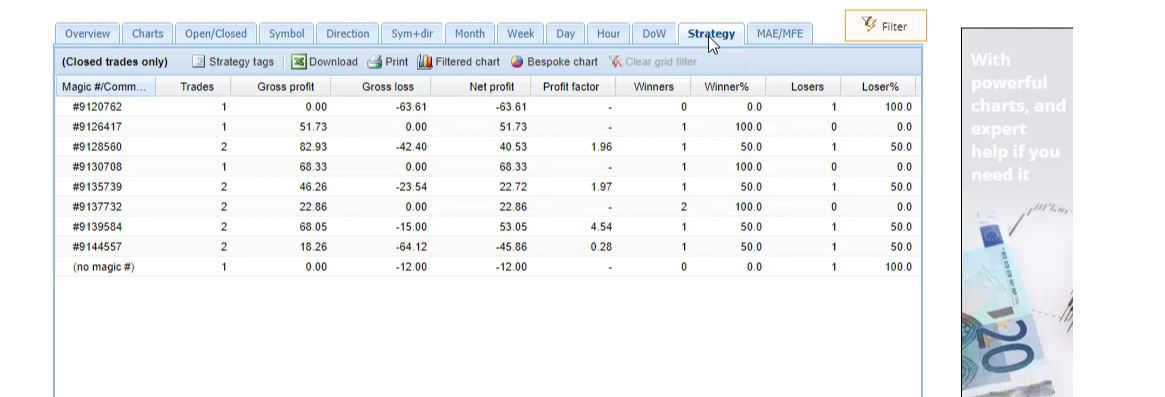
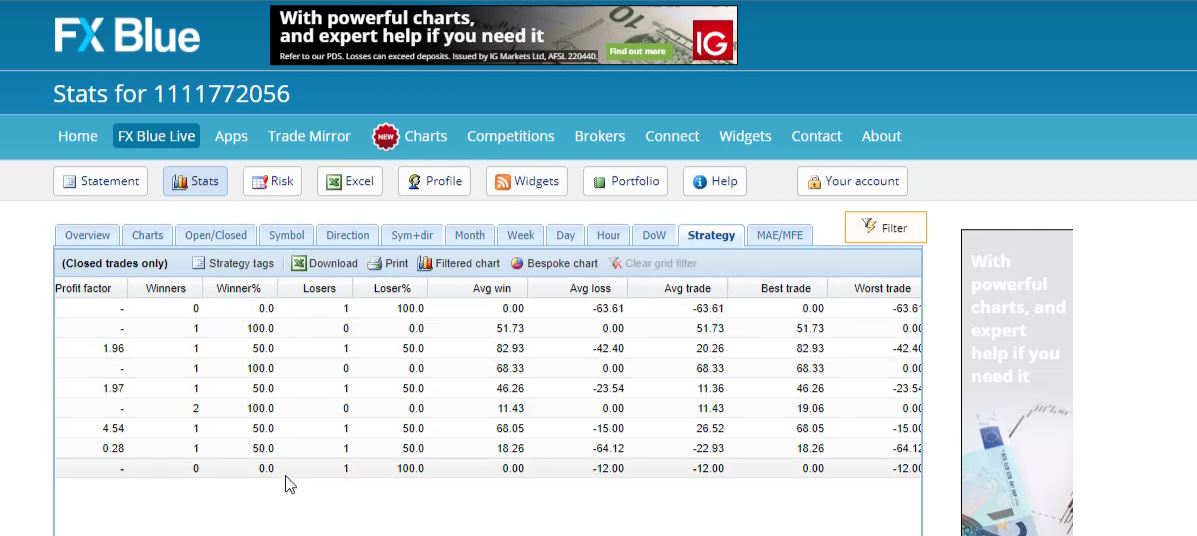
    Profit factor in Expert Advisor Generator.

    Now having just a couple of trades, for example, 5, 10, 20, is a very small number to depend on this strategy. Imagine for the complete period from 2014 till today to have only 10 or 15 executed trades with this strategy.

    First of all, this is not an active strategy. Second of all, we cannot depend on the rules of this strategy because it opened trades just a few times.

    So I prefer to use a minimum of 300. Or if you have a huge number of bars in your historical data, you better go with the bigger number. From here, you can add different Acceptance criteria.

    There are different options, maximum average position length, we have maximum bars in trade in percentage, maximum stagnation days, and many others.

    Expert Advisor Builder

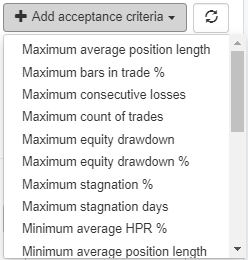
    One of the criteria that I always use is the minimum Profit factor and I will increase it to 1.2. So the Profit factor is the ratio of the Net Profit versus the Net loss.

    So it shows how much the Profit exceeds the loss and we can add more criteria. But keep in mind that if you add too many, you will make it too strict. And probably the generator will not show you any strategies.

    The Acceptance criteria.

    So it is better to generate more strategies. And after then, I will show you how to filter them in the collection than having no strategies into the collection.

    So I will leave it this way, just minimum Count of trades 500. We are looking for a very small profit, Net Profit of 10. Which simply means we want the profitable strategies.

    So we’re looking for strategies that have at least 500 Count of trades and Profit factor of 1.2.

    The power of Expert Advisor Generator.

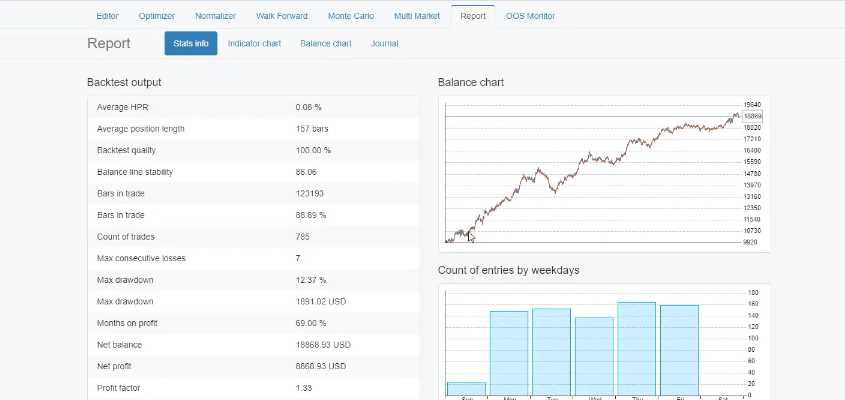
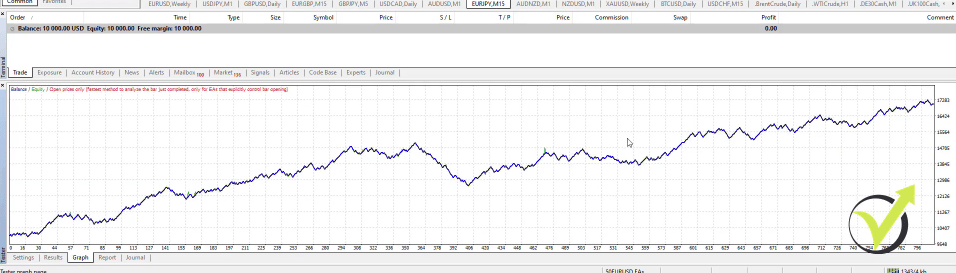
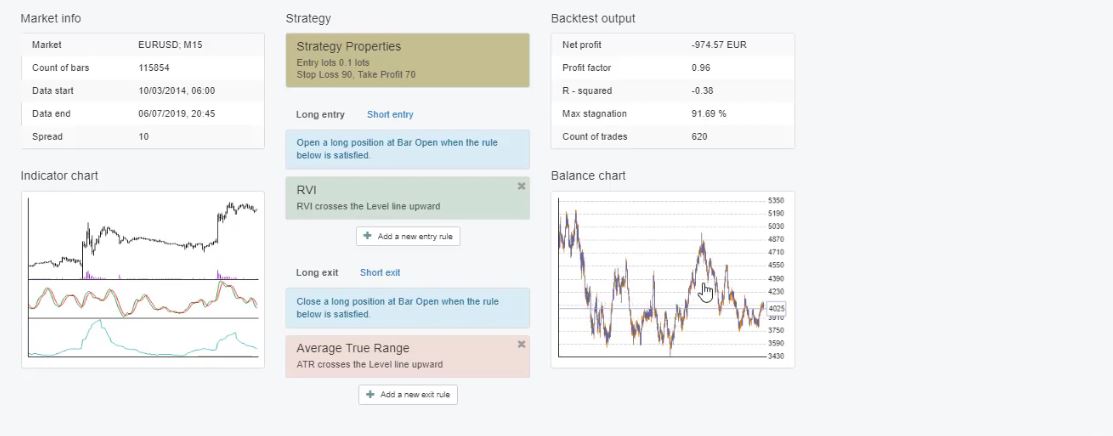
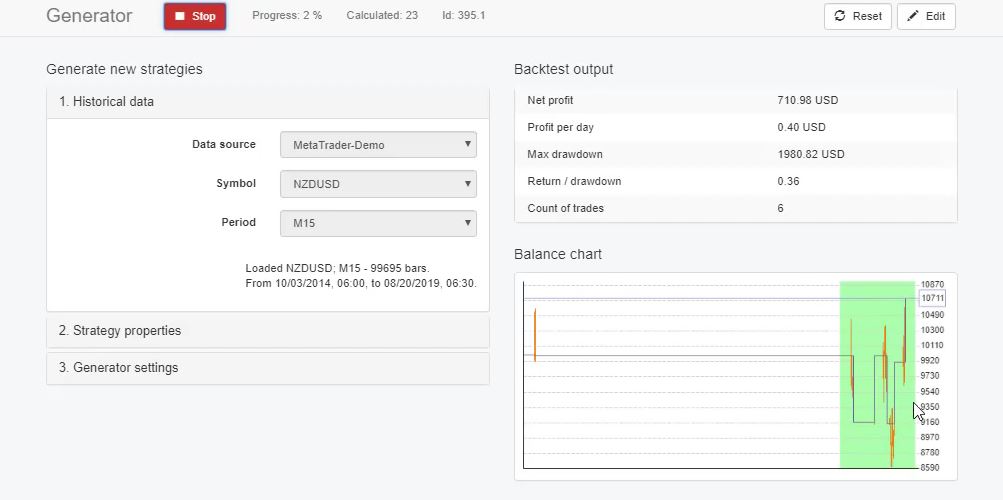
    Now going back to the generator and the generator settings, I am pretty much ready to go for it. I will click on start and the speed of the generator is really unique.

    These are actually calculated and generated strategies but so far I don’t have strategies into the collection because none of those passed the Acceptance criteria.

    So I will wait now for 10 hours and tomorrow, I will tell you the results. But what I can do at the same time, is I can run another generator for the other 3 currency pairs. For the EURUSD and for the GBPUSD.

    And with EA Studio, we can actually run the generator simultaneously for a couple of assets. But it is important to do it on different tabs of your browser, so it will work faster. So I will do the very same thing now for the EURUSD on M15.

    I have the range, it is saved generator settings. So I said it will go for 10 hours as Acceptance criteria. I will increase the minimum Profit factor to 1.2.

    And we said we want to see 500 Count of trades and minimum backtest quality, it’s nice to leave it. This is especially if you have some problems with your historical data but with this Meta Trader demo data it works fine.

    You can start with 1 Expert Advisor Generator tab.

    So I don’t need to have it and I will run the generator. I will check one more time all the settings. I will press on start and as well I will run one for the GBPUSD. As I’ve said, with a different tab. And you can organize your tabs in a way so you can monitor the 3 of them. And let me put one for the GBPUSD.

    Expert Advisor Builder

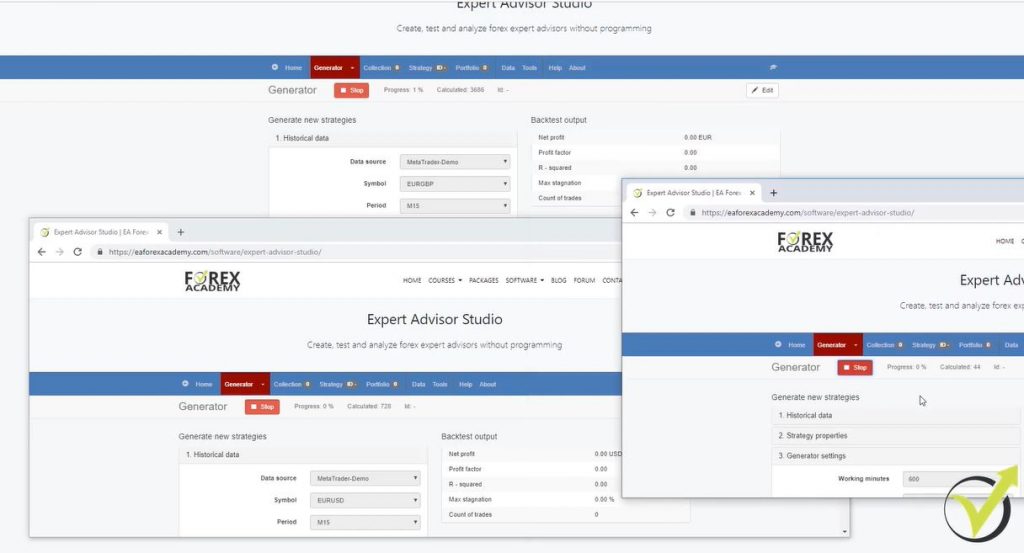
    So I will choose the Meta Trader demo GBPUSD. On M15 as strategy properties, I have it all set. I will increase just the working minutes. And let me have a look at the Acceptance criteria, 500. I click on the generator and I will press on start.

    So now the 3 of them are actually working. The speed of the Expert Advisor Generator is good for the 3 of them. Now if you make it more than 3 or 4, it might get a little bit slower. So the best thing I found is 3 works great for me.

    And especially on this computer I have, normally many other things open, 2, 3 Meta Trader platforms and many browsers and windows. And if I open more generators, it makes it a little bit slower.

    So it is up to you. But you can start just with 1 to get used to it. And then you can run the generator for different assets just as I taught you.

    Thank you for reading. I will continue tomorrow morning when I select the strategies. And I will place them on Meta Trader platform.

    Cheers.

  • GBP USD Historical Data for Traders

    GBP USD Historical Data for Traders

    How to get GBP USD Historical data from your broker?

    Hello, dear traders, in this article, I will teach you how to export GBP USD Historical data, for example, from your broker.

    Many experienced traders are looking for Data at the wrong places. The right and most professional way is to export the data from the broker you are using. Just the one that is in your Meta Trader.

    I have one Meta Trader platform that I just installed. It is with the FXCM broker (please, don’t take this broker as a recommendation, and if you are looking or a reliable broker, check out here)

    GBP USD Historical data
    FXCM broker.

    Really, don’t take it as a recommendation or any of the brokers that I show in my videos and courses because I’m not connected to any of those.

    Of course, I need to choose one in order to record the videos for my courses. The best thing to do is to look for regulated brokers with low spreads and commissions. So I just installed it because there are a few things that you need to know in order to export the GBPUSD historical data from your broker.

    The first thing you need to do when you install it is to remove the limitation of 65,000 bars. And this you can do from tools.

    GBP USD Historical data
    Go to tools.

    and then you go to options.

    Options.

    And on the charts, you have the maximum bars in charts 65,000. So you can enter 9999999999 as much as you can and as well with the maximum bars in History from your broker.

    And then when you click on OK, if I go again to tools and options, I have a bigger number.

    The number becomes bigger.

    And this way I can export more bars from the platform. Now, keep in mind that if you install the Meta Trader for the first time, you will not have a huge number of bars.

    Do not download GBPUSD Historical data from the history center.

    It is a huge mistake to download them from the history center.

    The History Center.

    Because this GBPUSD historical data is not from your broker, it’s from the MetaQuotes Company which has developed the Meta Trader platform. So the best thing you can do is to force Meta Trader to give you as maximum bars as possible.

    And after that when you leave your Meta Trader open, with time it will collect you more bars. So this way you will know that you have the bars from your broker. Now, let’s export some data for EURUSD. What I need to do first is to uncheck this scroll from the chart to the end button.

    And I will zoom it out as much as possible.

    GBP USD Historical data
    The zoom out button.

    I will press the HOME key on my keyboard and I will hold it. I will do this now for all timeframes, for example, for H1. And if I hold it, it will load maximum bars as GBP USD Historical data. I will do it on M30 as well and I will do it on M15.

    Just press it and hold it. If it moves, it will load more bars. On M5, I will press and hold. It loaded more bars. And then on M1 as well, I will hold it and it is loading more bars. Now, you need to do this on all timeframes and for all symbols that you want to trade.

    Diversification between different assets.

    For example, as well for the GBPUSD I will press the HOME key. I will press the HOME key, hold it and it loads more bars. Same on M5, on M15, and on M30 and all timeframes is the best way. And you need to do this only one time and then you will just collect more bars when you leave your Meta Trader open.

    And, for example, if you want to export for any other let’s say EURGBP, I will click on the chart window.

    Historical data for Forex
    Chart Window.

    And when the new chart comes, I will uncheck the scroll the chart to the end button and zoom it out as maximum as possible, I will press the HOME key and I will hold it for all timeframes. This way I will have the historical data for these assets and for these timeframes.

    Now, in the videos I will do examples with the 3 currency pairs; EURUSD, EURGBP, and GBPUSD. And this is because I want to have equal exposure, so let me close these 2.

    I want to have equal exposure to currencies. So EURUSD, EURGBP, and GBPUSD, I have 2 times the EUR, 2 times the USD, and 2 times the GBP.

    When we create a portfolio of Expert Advisors or portfolio of strategies, we want to diversify between different assets. But when we do that we should diversify between the different currencies. So if I place, for example, EURUSD, GBPUSD and USDJPY, I will have too much exposure on the USD.

    Where you should paste the script that exports the GBP USD Historical data?

    Now, after I load as maximum bars as possible from the Meta Trader, I will need to go to file,

    Go to File.

    open Data Folder,

    Open Data Folder.

    click on MQL4

    GBP USD Historical data
    MQL4.

    and then go to scripts.

    Scripts.

    This is where you need to paste the script which you downloaded from the EA Studio.

    Paste the downloaded script from EA Studio.

    Now, you can close the folder and you go to scripts, right mouse, and refresh.

    GBP USD Historical data
    Go to Scripts and click Refresh.

    This will compile the script and it will be displayed.

    The script is displayed.

    EA Studio data export MT4. Now, the exported files are displayed on the left upper corner on the chart. So let me remove the one click trading.

    Remove One Click Trading.

    And I can double-click on it or I can drag it over the chart. There comes a small menu with the common settings, you really don’t need to touch anything. And here are the inputs.

    The inputs.

    Now, you need to enter the commission in the currency for 1 trading lot if you have the spread.

    And the spread, you can leave it to 0 which will round it to the higher number. So let’s say at the current moment we have 0.7 pips or 7 points as a spread, it will round it to 1 pip.

    If it is above 1 pip it will round it to 2 pips. And at the current moment, I cannot see what is the spread because we are during the weekend.

    The exported bars of GBPUSD Historical data.

    Today is Sunday so the market is not open. And normally with all brokers, when the market closes on Friday it closes with a higher spread. But anyway it is better to generate the strategies with higher spread and then trade them with a lower spread.

    This is why I will leave it to 0 now. And we have a maximum count of bars which normally I leave to 200,000. But now because I just installed this platform, I will not have a lot of bars.

    I click on OK and the bars are being exported. This broker provides a very small number of bars at the beginning which is not really enough to use and to create Expert Advisors.

    The broker provides a small number of bars at the beginning.

    But I wanted to teach you the procedure on how to export the bars. And I will do this for the other currency pairs. I will drag it over the chart, I will leave it to 0 commission, I will click on OK there appear the exported bars. And as well, for the EURUSD let me remove the one-click trading.

    I will drag it over the chart, I will leave it to 0 and I will click on OK and I will have it. Now, I need to go to file, open the data folder, and then go to MQL4 and then files.

    Files.

    Here are the exported bars of the Historical data.

    The exported bars.

    And these are exactly the files that I need to drop in the drop zone where it says Drop files here or click to upload.

    Press the HOME key as maximum as the chart moves.

    So I take them all and I put them there. And you can see that all the data is imported. Only that there is some issue with the EURGBP on H4 chart which normally I don’t trade as a timeframe. But probably there is some issue with the data from this broker for this currency.

    The drop zone.

    I’m not going to use this broker, once again because it has a very small number of bars when the account is open. But I wanted to teach you how to export your GBP USD Historical data. What I’m going to use is the default data that I have as Meta Trader Demo.

    And this is data coming from the JFD broker at the current moment and there is a lot of data. On M15 we have 95,000 bars and on M1 we have 200,000 bars which are just enough. Same on M5 and on the others as well we have a lot of bars. For example, on H1 we have 25,328 at the current moment.

    And they update all the time so I don’t need to export the GBP USD historical data every time when I run the generator. So this is how we export the data.

    You need to place the script for the GBPUSD historical data, press the HOME key as maximum as the chart moves, then drop it over the chart, put the spread and Commission if you have with the broker.

    Feel free to ask questions in our Forum.

    Then when you click on OK your bars will export. What you need to do is to drop them in the drop files or click to upload. And you will see this data actually in the data source.

    So you will see it. FXCM USD Demo. But there is a difference, on H1 I have only 3,072 bars and with the Meta Trader Demo which is a data from another broker, there are 29,747.

    And this is for the period of 20th of August, 2014 till today. And so with the FXCM what we have is from just last year. Even less than 1-year data which is not enough.

    But one more time, if you install your Meta Trader right now and you have a small number of bars, you can leave it open to collect more bars for you or you can look for the brokers which will provide you more historical data at the beginning.

    If you want to download more GBP USD Historical data for your algorithmic trading feel free to use the Historical data App.

    If you have any questions feel at liberty to ask me at any time. You can as well write in our forum on the website.

    Thank you for reading and I will continue with the next lecture.

    Cheers.

  • Coinbase Review: PROs & CONs

    Coinbase Review: PROs & CONs

    Coinbase Review: in-depth review details with all possible findings you should know about

    Like any other crypto exchange in the market, Coinbase has its strengths and weaknesses. We have compiled a thorough review of both so you can weigh both sides and assess whether or not Coinbase suits your trading needs.

    coinbase review and users

    It is worth noting that Coinbase has a customer base of 30+ million users and is accessible in over 100 countries globally. This means that we can safely say that it is one of the largest companies dealing with cryptocurrency as of the moment.

    Our Coinbase review research showed that the company offers a wide range of services, the main one being allowing Bitcoin selling and buying to its users using:

    • a debit card
    • a credit card
    • a bank account
    coinbase review for accounts

    Despite having a weak customer support system, the rates offered by the platform are generally fair.

    If you wish to trade on the value of the asset and use leverage, check out HotForex or BlackBull Markets.

    Company Overview

    The company was launched back in 2012 and it started out entirely as a broker for Bitcoins, meaning that the users would directly buy Bitcoins from the platform. The founders, Fred Ehrsam and Brian Armstrong, later on added the variety of services rendered by the company.

    Having raised an estimated $530 million and beyond from reputable investors around the world, Coinbase is not only licensed but also fully regulated.

    Services rendered – Coinbase Review

    1. Broker services

    Facilitating the buying and selling of cryptocurrencies is as a broker is the main service that Coinbase offers. Due to the company’s user-friendly interface, incredible marketing strategies, and impressively appealing reputation, most of the new cryptocurrency users often approach Coinbase to buy their first Bitcoin.

    Although Coinbase users have complained that they do not have control over their funds. Opening an account with Coinbase will not let you have the privilege of accessing your coins directly. It’s almost like opening a bank account but instead of you having control over your funds, the bank does.

    • Coinbase wallet
    coinbase review on mobile

    Having the ability to store the private keys on a user’s mobile device, Coinbase introduced its Android and iOS mobile wallet in 2018 which enables only the user to access their funds.

    • Coinbase Pro

    Coinbase Pro acts as a platform for cryptocurrency trading and it is targeted for those users with a little bit more advanced experience. Coinbase Pro was there before called GDAX.

    The platform also bears trading options that are advanced and has relatively lower fees compared to the broker services. With Coinbase Pro, you can trade a variety of cryptocurrencies such as ZRX, ETH, BTC, BCH, and LTC.

    • Merchants

    Through a designated plugin, the website provides merchants who are in a position to accept cryptocurrencies. Shopify, WooCommerce, and other large content management systems (CMS) support the plugin.

    Currencies on Coinbase – the coinbase reviews shows a great variety

    Coinbase offers a wide range of coins such as:

    • Tezos (XTZ)
    • Augor (REP)
    • Ethereum Classic (ETC)
    • Chainlink (LINK)
    • Bitcoin (BTC)
    • Bitcoin Cash (BCH)
    • Ethereum (ETH)
    • Bitcoin Satoshi’s Vision (BSV)
    • Litecoin (LTC)
    • EOS (EOS)
    • Zcash (ZEC)
    • Dai (DAI)
    • Dash (DASH)
    • Cosmos (ATOM)
    • Orchid (OXT)
    • Basic Attention Token (BAT)
    • Kyber Network (KNC)
    • 0x (ZRX)
    • USD Coin (USDC)
    • Stellar Lumens (XLM)

    Coinbase methods of payment

    The following are the payment methods accepted by Coinbase;

    • Debit cards
    • Credit cards (the platform does not accept new cards currently)
    • Wire transfer
    • PayPal (only for withdrawal)

    Once you have your Coinbase account up and running, you can only buy small amounts of Bitcoin until your limit is raised.

    Here is what you need to do if you seek to have your limits raised:

    • Submit your number and have it verified
    • Provide a photo id and verify it
    • Provide the required personal information and verify it

    Coinbase review for the US citizens: The US residents that are fully verified can reach $25,000 per day which is the current highest limit.

    Keep in mind that your choice of payment method for buying the cryptocurrencies influences how your limit is set. Purchases from a credit card, for instance, have a lower limit compared to ACH transfer on Coinbase.

    Countries supported by Coinbase

    As pointed out earlier, Coinbase supports over 100 countries. These include;

    Europe

    • United Kingdom
    • Turkey
    • Switzerland
    • Sweden
    • Spain
    • Slovenia
    • Slovakia
    • Serbia
    • San Marino
    • Romania
    • Portugal
    • Poland
    • Norway
    • Netherlands
    • Montenegro
    • Monaco
    • Malta
    • Luxembourg
    • Lithuania
    • Liechtenstein
    • Latvia
    • Jersey
    • Italy
    • Isle of Man
    • Ireland
    • Iceland
    • Hungary
    • Guernsey
    • Greece
    • Gibraltar
    • France
    • Finland
    • Estonia
    • Denmark
    • Czech Republic
    • Cyprus
    • Croatia
    • Bulgaria
    • Belgium
    • Austria

    Africa

    • Zambia
    • Uganda
    • Tunisia
    • South Africa
    • Rwanda
    • Namibia
    • Mauritius
    • Kenya
    • Ghana
    • Cameroon
    • Botswana
    • Benin
    • Angola

    Asia

    • Uzbekistan
    • Taiwan
    • Singapore
    • Philippines
    • Oman
    • Nepal
    • Mongolia
    • Maldives
    • Macao
    • Kyrgyzstan
    • Kuwait
    • Korea
    • Kazakhstan
    • Jordan
    • Indonesia
    • India
    • Hong Kong
    • Brunei Darussalam
    • Bahrain
    • Armenia

    America

    • United States
    • Peru
    • Paraguay
    • Ecuador
    • Colombia
    • Chile
    • Brazil
    • Argentina
    • British Virgin Islands
    • Uruguay
    • Trinidad and Tobago
    • Panama
    • Mexico
    • Canada
    • Honduras
    • Guatemala
    • El Salvador
    • Dominican Republic
    • Curaçao
    • Costa Rica
    • Cayman Islands
    • Jamaica
    • Bermuda
    • Barbados
    • Bahamas
    • Aruba

    Coinbase review about the customer service and general public remarks

    1. Customer support

    If you submit your Coinbase support ticket by means of email, you should expect feedback within approximately 48 – 72 hours.

    Also, even though proving not to be so effective as per the users, Coinbase provides a phone line for customer support.

    From the users’ point of view, the quality of customer support provided by Coinbase is not very encouraging. This is because the customer service team will not really look into your problem on their first feedback but instead, they will send you an automated message which does not solve a user’s problem most of the time.

    This portrays Coinbase as a company that is not oriented to giving much support to its users which leaves them to figure out the issues they face on their own.

    Better Business Bureau (BBB) has rated Coinbase “F” with regard to the company’s failure to address the hundreds of complaints submitted by its users which further validates this point.

    If you are a new cryptocurrency user, this is definitely one of the factors to consider before making the decision to buy cryptocurrencies through Coinbase.

    • Abuse of affiliate benefits

    Some Coinbase users have complained that the company does not always honor its referral program terms. According to these users, Coinbase does not pay its partners as stated in the referral program agreement.

    • Closure of accounts

    Frequent closure of user accounts is among the most complained factors related to Coinbase. As a result of the company’s incorporation with the traditional banking rules, this is unavoidable. Just as any other bank, Coinbase has Know Your Customer (KYC) and Anti-Money Laundering (AML) practices.

    It is inevitable to have the company tracking your expenditure of Coinbase coins and to shut your account if you indulge in any of the following;

    • Bitcoin-related gambling
    • Adult service kind of transactions
    • Using darknet markets to buy or sell contraband
    • Using other exchanges to resell coins especially those without Know Your Customer or Anti-Money Laundering practices.

    Even though you are almost guaranteed to get your money back if it happens that your account is closed by Coinbase, it is still going to be a frustrating, expensive and inconvenient process.

    • Involvement in Bitcoin debates

    One would expect such a reputable company to refrain from such debates and follow the market from a neutral point of view. However, Coinbase has been known to be vocal in these debates raised in the Bitcoin community.

    Coinbase Review: The charges

    The pricing when it comes to Coinbase is not one that you would call easy to understand but we will try and simplify it. The following are the charges you incur when you use Coinbase to purchase Bitcoins:

    • Coinbase Pro has a market price of 0.5%
    • Transaction charges (For the transactions below $200, there is a flat rate. Other transactions use percentage)

    The transaction charges for standard buyers are usually 1.49% while for credit card buyers it is 3.99%. ACH transfer deposits are free of charge.

    However, in the instances when the price shifts are too extreme, there are chances that your purchase will be declined by Coinbase as this is something that has happened before.

    But on the brighter side, Coinbase is a relatively cheaper broker compared to other brokers. Coinbase account to Coinbase account transactions are free. However, you will need three confirmations in order to make an outside transaction.

    Find out Coinbase charges in full details here.

    Comparison between Coinbase and other mediums of exchange

    1. Comparison between Coinbase and Robinhood

    Unlike Coinbase, Robinhood allows investors from the US to purchase cryptocurrencies but they cannot access their coins directly.

    This is to say that Robinhood users can only trade cryptocurrencies as they cannot withdraw their coins.

    The advantage with Robinhood is that it has 0% charges and allows its users to participate in traditional stock trading.

    • Comparison between Coinbase and Binance

    Having accepted cryptocurrency buying by means of credit cards only recently, Binance strictly allows exchanges between cryptocurrencies. The purchase charges are 5% which are quite high.

    However, Binance takes the day with a 0.1% fee when it comes to exchanges between cryptocurrency when compared to the 0.25% imposed by Coinbase Pro. Additionally, Binance users have access to a wider range of cryptocurrencies which makes it more advantageous.

    • Comparison between Coinbase and Gemini

    The charges imposed by Gemini are higher to those of Coinbase Pro. Gemini has a 1% fee which is way higher when put on the scale with the 0.25% fee charged by Coinbase Pro.

    Additional information you should know about Coinbase

    1. You can make money withdrawals from Coinbase to either your cryptocurrency wallet, PayPal account, or bank account.
    2. All the currency digitally held by Coinbase online is under insurance.
    3. Coinbase withdrawals are instant, but it may take up to 3 business days for processing, depending on your bank. However, the company can delay your transaction up to 72 hours if they suspect that the account holder did not make the authorization.
    4. Buying cryptocurrencies on Coinbase has, over time, generally been considered to be safe.

    Conclusion of this Coinbase Review:

    Despite the fact that a Coinbase account holder does not have much control over their coins and always have their transactions under scrutiny, the platform has proven to be user-friendly.

    We can assume that the company is more growth-oriented than customer support-oriented by considering the rising numbers of negative reviews they receive regarding the same which is not a very good picture. But on the brighter side, the charges on Coinbase are impressively pocket-friendly compared to other platforms.

    If you feel that Coinbase if not the right place for you, check out the Exchanges and the Brokers on our website.

  • Currency Strength Meter: Master Forex Trading

    Currency Strength Meter: Master Forex Trading

    Currency Strength Meter

    Hello, dear traders, in this lecture, I will show you one amazing Currency Strength Meter indicator. It’s called ForexProfitSupreme Meter.

    Currency Strength Meter
    The ForexProfitSupreme Meter

    So basically, what I issued for many years is how to identify which pair to trade according to which pair is stronger, which pair is weaker at the moment, and to find the best choice for a trading pair. This ForexProfitSupreme Meter actually helps a lot.

    I will show it to you straight away. Basically, I have already placed it in my MetaTrader 4. With the Forex Trading Course – London, NY & Tokyo Trading System course, you will receive it.

    I hope everybody knows how to import an indicator. Quickly, I will tell it.

    So, once you have it in the file, you just copy it. You go to File and then you go to Open Data folder.

    Currency Strength Meter
    Go to File then Open Data Folder

    After that you have to go to MQL4,

    Go to MQL4

    you go to Indicators.

    Go to Indicators

    And then you paste the Indicator. Put your cursor over Indicators and click Refresh.

    Right-click on Indicators then click Refresh

    So after that you will see your indicator appearing. Then what do you need to do? Simply, drag it over the chart and click on OK,

    Currency Strength Meter settings
    Drag the indicator over the chart and click OK

    and you will see this amazing thing over here, guys.

    What you are going to see

    It’s not a lagging Currency Strength Meter indicator

    I found this indicator by chance over the internet and it was for free and I thought in the beginning that this is some joke. I thought that this is not real.

    And actually it took me a couple of days to believe that this is what I see, because this indicator, guys, is not lagging indicator. What I mean by lagging indicator, as you know all other EMAs and MACD and RSI, they are based on previous price value. On the previous price bars.

    This is not a lagging indicator. Basically, this Currency Strength Meter indicator shows you what is at the moment.

    So, this indicator shows you which currency is strongest at the moment, which currency is weakest, and where are all the others from the major currencies. And on the left side, you can see each pair,

    Currency Strength Meter
    You can see each currency pair

    and actually they go from 0 to 100 on the positive side.

    Also, they’re going down from 0 to -100. So basically, when you have EURJPY now on the top, the EUR is on the top of all currencies, meaning that EUR is the strongest at the moment and you have NZD, CAD, USD which are weakest.

    This indicator shows you the strongest and the weakest currency

    You can see that they’re almost on the same level, now JPY is joining as well:

    The weekest currencies are in Red

    But on the left side, you will see exactly EUR against the one among those on the bottom that is the strongest.

    And as you can see in this case it is against the JPY which here is actually pretty much in the middle and not on the bottom. So basically, if you look at it you will say OK, EUR is the strongest, NZD is the weakest.

    So, EURNZD at the moment is the best pair to trade long. But actually, the best pair to trade long is EURJPY at the moment. And I will just go quickly to EURJPY to see if it is really going up.

    I can bet you it’s going up at the moment because I now really believe in this indicator. I have been using it for a long time now and it’s one of the best indicators you can ever have for Meta Trader.

    EURJPY is just going up, I will put the template that we have prepared.

    So, this indicator ForexProfitSupreme Meter shows you which currency is the strongest, which currency is the weakest, where are all the rest.

    The volatile currencies is what we want to trade

    And on the left side you can see all the pairs, which one is on the top, which one is on the bottom. So when you’re having a strategy where you want to catch the strongest movement, the volatility on the market, you should be aiming for pairs that are on the top or on the bottom and there are above at least 90 and 95 going to 100.

    Currency Strength Meter for all pairs

    At the moment I don’t have anything to sell. The strongest sell would be USDCHF. NZDCHF is very quickly going down to -81. So basically, if it goes negative below -90 then I can be thinking about selling this currency.

    But this is only based on the Currency Strength Meter. So this indicator shows us really well which pair has the strongest move and which pair has good potential. And at the same time we know which currency is the strongest at the moment.

    I mean I always keep on one of my screens as I already told you the 6 major currencies against the USD. So at each moment, I will know which one is going up and which one is going down.

    So, I know basically where the market is at the current moment, but with the ForexProfitSupreme Meter, I have a very clear view. It’s very easy to follow. And I just know that EUR is the strongest at the moment and I know that NZD and the CAD are on the bottom.

    The formula behind the Currency Strength Meter is complex

    So, I will go there, I will look for the setup and I will enter if I have the opportunity, when I’m trading manually like with my system, for example, that I show in the course Forex Trading Course – London, NY & Tokyo Trading System

    But just put it on your Meta Trader and follow it for some time.

    And I’m sure you will get used to it very quickly. I showed this Currency Strength Meter indicator to one of my students quite a long time ago before I was even recording these courses for the Academy and he was using only this ForexProfitSupreme Meter and nothing else.

    He was placing it and choosing the strongest, the weakest, and he was executing the trade. So for example, he would go to EURNZD. After a little while when EUR is going down a little bit, he was taking the profit.

    I can tell you that I followed his trading for a few days. He didn’t have a losing trade. He didn’t have one losing trade. It’s amazing. I mean I never focused on one indicator to base all my trading on one indicator. But really this indicator is designed to focus because it’s not lagging.

    It’s not based on the previous price of the currencies and the pairs. The formula behind it is really hard.

    And in the course, I have shown plenty of examples for practise

    And it’s very hard at this moment for us to automate it, but it’s a really nice tool to have on your screen and to use for any trading system that you have.

    This is because you will always know which pair is strong, which pair is weak, which currencies are strong, which currencies are weak, and which pair to trade.

    It’s a very easy indicator. This is why I have decided to include it in the Forex Trading Course – London, NY & Tokyo Trading System.

    It is very useful and I will show you in the next video how I put it in the setup and what is the setup of the whole system for this course.

    And I will try my best to give you as many examples after that as I can.

    Thank you, guys, for reading.

    Cheers.

  • CCI Indicator Strategy for EURJPY

    CCI Indicator Strategy for EURJPY

    CCI Indicator strategy

    Hello traders, today I will show you CCI indicator strategy that I created recently for my Automated Forex Trading course + 99 Expert Advisors. And I really like that CCI indicator strategy because of the great statistic it showed me.

    If I go to Report, you will see what are the statistics that we have, the balance chart is really great.

    CCI indicator strategy
    The report

    There is a drawdown which is at 12.37% but that is an acceptable drawdown for me because the rest of the backtest is really nice.

    And as well, this CCI indicator strategy is balanced. Through the week from Monday till Friday it has a very stable number of entries and as well the profits and the losses in currency by weekdays are quite stable.

    And below are the profit and loss in currency by entry hour,

    The profit and loss in currency by entry hour

    which show us that the strategy is most active during the European session, the American session, and at the beginning of the Asian session.

    And this is a strategy for the EURJPY so it combines the EUR which is most important active during the European stock exchange session and the JPY which is most active during the Asian stock exchange.

    And below are the positions profit by position holding time,

    CCI indicator strategy
    Position profit by position holding time

    which shows us that most of the profits are at about $70 and the monthly performance shows us which months are profitable and which are losing for this CCI indicator strategy. And it is very normal for every strategy to have losing months.

    The Commodity Channel Index (CCI)

    Now, going back to strategy, let’s have a look at the entry indicator which is the Commodity Channel Index. This is why I say it is a CCI indicator strategy because the entry on the market happens when the CCI crosses the level line downward.

    And we have period of 25 and level of -23. What I like to do with the parameters of the strategies is to make it a round number so I will change it to -25 and when I click on Accept,

    CCI indicator strategy
    I change the parameters to a round number

    you will see that there is not a huge difference in the balance chart which allows me to leave the round number.

    CCI indicator strategy
    The balance chart does not change much

    And having round numbers in the indicators makes the Expert Advisor faster, the calculations are faster and if you like to trade the CCI indicator strategy manually, it will be easier for you to remember that the period of the CCI indicator is 25 and the level is -25.

    As an exit condition for this strategy, we have the volumes and the condition here is volume crosses the level line upward. As a level, we have 27,655, I will make it round to 28,000 and I check for any change.

    The exit indicator parameters

    No change in the backtest which allows me to leave it this way. As a Stop Loss and Take Profit, I have a Stop Loss of 100 pips and Take Profit of 77 pips for this CCI Indicator strategy.

    And again I will make it a round number, Take profit of 80, I will click on Accept.

    CCI indicator strategy
    Strategy properties

    The balance chart didn’t change a lot but we have a lower balance at the end. So I will decrease it to 75 which is again a round number for me in trading.

    Yes, this is much better, 70,917. So this strategy has a really good return to a drawdown ratio of 3.38. And the simulation here is if we are trading with 0.1 lot size starting at a $10,000 of account, with this CCI indicator strategy we had 17,917 as a result and this is for the period from October 2014 until the moment.

    Advantage of more count of trades

    What I liked the most with this CCI indicator strategy is that we had over 800 count of trades. For beginner traders, the more count of trades we have, the more robust strategies we are using.

    Because when we are backtesting a strategy, if we have just 20 or 30 trades for such a period like 5 or 6 years, it means first that the strategy is not active because if it opened just 5, 6 trades for 6 years. Basically it will be trading once a year.

    The Profit factor of the CCI Indicator Strategy

    But when it opens 800 trades, this means that’s really an active strategy. And if I show you the report, one more time, you will see that we have Profit factor of 1.28 and the Profit factor is the profit divided by the losses.

    And by changing the parameters, the maximum drawdown increased to 15% which is below my maximum of 20% so I avoid trading strategies that have more than 20% drawdown in their backtest. So this is a really simple CCI indicator strategy.

    As I said, the entry is when the CCI crosses the level line downward. And if I click on the indicator chart, the CCI line is Illustrated in blue. And let me show you an example of an entry.

    The CCI crosses the level line downwards at this moment.

    Example of an entry

    And this is why we have a buy signal which goes on a profit and hits the Take Profit a little bit later. Below is another example that went on a negative. The CCI crossed the level line downwards,

    CCI indicator strategy
    An example of the strategy going on a negative

    we had a buy position or a long position and it hit the Stop Loss.

    So there are losing trades, profitable trades with every strategy, but the most important thing, of course, is to have more profitable trades than losing trades.

    Let’s have a look at this short trade.

    CCI Indicator strategy short trade
    Example of a short trade

    The CCI crossed the level line upwards, we had a short trade right after the cross and it hit the Take Profit.

    The magic number of the CCI Indicator strategy

    Now, I will export this strategy from EA Studio as an Expert Advisor for Meta Trader 4,

    CCI indicator strategy
    Exporting the strategy

    I will copy it, and I will open Meta Trader. I will go to File, Open Data Folder,

    Go to File, then Open Data Folder

    MQL4,

    CCI indicator strategy
    MQL4

    Experts,

    Experts

    and I will paste here the Expert Advisor.

    So this is the unique thing with EA Studio that with one click, we can export any strategy as an Expert Advisor and trade it automatically in Meta Trader. After that, I will click right mouse on Expert Advisors, Refresh,

    CCI indicator strategy
    Right-click on Expert Advisors and click Refresh

    and it will display the Expert Advisor below.

    Then I will drag it over the chart and here are all the inputs that we have from the strategy,

    Drag it over the chart and you will see the strategy inputs

    the Stop Loss, Take Profit, the period, the level of the CCI indicator, the volumes, and the magic number which is a unique number for the strategy that we use when trading many Expert Advisors to recognize which ones are profitable and which ones are losing.

    Click on OK and the Expert Advisor is attached. I didn’t allow the old trading because it is Sunday, the market is not open. Simply, I just want to show you the backtest. I will click on Expert Advisors, right mouse over the chart and go to strategy tester.

    CCI indicator strategy
    Strategy tester

    And usually, it will fulfill all the settings automatically so it sets the Expert Advisor, the symbol.

    Model

    As a model, it’s very important to use Open prices only because the Expert Advisors that are created with EA Studio work on the bar opening.

    The graph for the backtest of this CCI Indicator strategy

    So when a new bar comes it will check if the entry condition is met in the previous bar. In our case, this was the CCI indicator.

    In our CCI indicator strategy, this was when the CCI crosses the level line upwards or downwards and on the opening of the next bar if this event is true, it will open the trade.

    And then I will click on Start and I will see what are the results, all trades that opened and closed.

    And then we have the graph which you can notice is the very same as what we had with EA studio just that it is in a wider window.

    CCI indicator strategy
    The graph

    And in EA Studio the strategy did above 17,900 but in Meta Trader it did about 17,200.

    But this is because the historical data is a little bit different in Meta Trader, I don’t have that much data as I have in EA Studio.

    And as well, if you compare the results in the Meta Trader backtest and the backtest in EA studio, if I go to Journal, there are the very same trades that happened or the very same events which this CCI indicator strategy executed.

    Select a reliable broker to test any strategy

    So if you want to practice this whole process I would suggest you to build this strategy for your broker. So no matter which broker you are using and actually if you have difficulties with the brokers, recently we launched the brokers page where we placed a lot of tips of how to choose a regulated and reliable broker.

    As well we have listed some brokers which we have tested with many of our students and traders. What you can do is just export the historical data from your broker in data for EA Studio.

    You have the two scripts.

    The two scripts

    Just download them, paste them to the Scripts folder just as I showed for the Expert Advisors. Go to File, Open Data Folder, and then you go to MQL4, Scripts, and paste it there.

    Close the folder, refresh scripts and the script will appear right here. After that drop it over the chart and for maximum count of bars I would suggest you to do 200 000 and then enter the spread and the commission that you have for the broker and click on OK and this will export all the data that you have for this currency pair.

    And if you don’t have a lot of data just press the HOME key on your keyboard so it will load more data and so all the data can be exported. Then what you need to do is go to File, Open Data Folder, and you go to MQL4, Files, and you will see the data.

    Different brokers offer different historical data

    What you need to do is simply drop these files in the data import tab and you will see the data on the right side. Let me demonstrate it to you, I will drop the files,

    CCI indicator strategy
    Drop the files in the drop zone

    they will be imported and uploaded and then when you go to Strategy you will see your broker listed here.

    And in this case I have many different data from different brokers because I always compare which one provides better trading conditions. And then what you can do is build the strategy from scratch.

    So what this CCI indicator strategy has is the CCI indicator or the Commodity Channel Index, applied to typical method, CCI crosses the level line downwards is the entry condition, period 25, level -25. And then we have the volumes, volume crosses the level line upwards, level of 28,000 for this strategy.

    And we have the strategy properties, Stop Loss of 100 pips, Take Profit of 75 pips. Build the strategy for your broker and see what is the performance. You can play around with the parameters to round it or change it a little bit to see a better balance chart for your broker.

    And keep in mind that the brokers offer quite different historical data. This is why sometimes in my courses I show great backtests and results with my strategies and students often say that the strategy didn’t show the same result with them and the only reason for that is the spread.

    The Generator that created the CCI Indicator strategy

    If I go to Meta Trader and I do a backtest for this strategy one more time and I increase the spread to 15, for example, and I click on Start, it fell below 16,000.

    And if I increase it to 30 or this is 3 pips which many brokers offer for EURJPY and I click on Start, the graph goes below 15,000. So the spread really matters in algorithmic trading and if your broker has a huge spread you better change your broker.

    So, one more time, you can build this strategy in EA Studio and you can export the Expert Advisor to see how the backtest will be on Meta Trader. But I am pretty sure it will be the same because I have checked it hundreds of times.

    And if you haven’t used EA Studio yet, what you can do is to register for a free trial that is available, for 15 days you can export and build as many strategies as you wish. As well there is the Generator which allows you to generate new strategies.

    And we have the EA Studio free start-up course which I have recorded,

    CCI Indicator Strategy
    The free start-up course

    it’s a free course. It will teach you how to use the software and you will be able to generate, create, and automate many trading strategies such as this CCI indicator strategy.

    If you have any questions, let me know in our Forum.

    Thank you for reading.

    Safe trading.

  • Auto Trading Software: Automate Your Trading

    Auto Trading Software: Automate Your Trading

    Auto trading software: EA Studio Strategy Builder.

    Hello, traders! In this article, I will teach you how to automate your trading strategy into Expert Advisor with the Auto trading software EA Studio. So if you are trading any strategy so far, you can go to strategy, and you can place here the entry rules and the exit rules.

    Auto trading software
    The strategy.

    This way, you will see if your manual strategy was profitable in the past or it was losing. As well, with EA Studio, you can export it as an Expert Advisor with one click and trade with it fully automatically.

    Don’t worry it is not a rocket science to use the EA Studio auto trading software. We have recorded a Free Start-up course.

    Now the benefits of trading with Expert Advisors compared to manual trading are many.

    First of all, when we are trading with Expert Advisors, we trade all the time from Monday till Friday, 24 hours, and this is something impossible for manual trading.

    As well with the manual trading, we skip many entries, sometimes we miss to enter the trade or we are late with the trade. And with the Expert Advisors, we are precisely on time with the trade.

    The robots, they open the trade precisely at the moment when the entry rules are confirmed. And, as well, when we trade with Expert Advisors, we avoid emotions so we don’t get scared or we don’t get greedy with the trades, the Expert Advisors.

    Simply follow the strategy in 100%, and no emotions are involved. And as you know, emotions are the reason that people lose in manual trading. So, now I will teach you how you can automate your strategy with EA Studio.

    When you register for the 15days free trial for the auto trading software EA Studio, you can click at the strategy editor is where you can use the historical data of your broker, the symbol that you want to trade, and the timeframe.

    The backtest in Auto trading software.

    From strategy properties, you can set the entry lot and what are the Stop Loss and the Take Profit of your strategy. If you want to use one or not, if you’re going to use a fixed Stop Loss, you need to choose fixed.

    If you’re going to go for trailing, you have this option. I will stay with fixed, and with Take Profit, I will remain with fixed as well.

    So now, let’s say that we have Stop Loss of 90 pips and Take Profit of 70 pips. I click on accept, and I will add some rules.

    Auto trading software
    Strategy properties.

    Now, these are the rules for a long entry. I can choose the indicators, and, for example, I will teach you a strategy with the RVI. And we have different parameters. RVI rises, falls, is higher than the level line, RVI is lower than the level line, crosses the level line upward, downward, changes its direction upward, or downward.

    So we have different options. Now, let’s say we want the RVI to cross the level line upward. And I will teach you what is the difference when we use the default parameter. So 10 is the default with RVI. I click on accept, and I have a losing strategy.

    The RVI.

    This is the excellent thing that immediately when you make any change in the editor, you can see the balance chart, or this is the backtest.

    So any change will be applied here. As an exit rule, I will choose the Average True Range. And, as a rule, I will select Average True Range crosses the level line upward, and I will stay with the default parameters. I click on accept.

    Average True Range.

    and already I have a much better backtest

    The balance chart.

    Still losing, but at least I have some moments of profits, drawdowns, another period of Profit, then losing again.

    Auto trading software allows you find the best parameters for an Indicator.

    So now, I have the strategies with the default parameters. Now let me change it. For example, the RVI, I will increase it to 18, I will click on accept. I have a much better strategy. It’s profitable because we start at 5,000.

    And it made a considerable drawdown, then it went on a profit, then again goes down, and in the end, it’s more of a sideways, it is on Profit.

    Now for the Average True Range, I will change the period to 42. And, as well, the level I will change it to 0.002. I click on accept, and there was no considerable difference in this case.

    And let me change as well as the strategy properties. Let me increase a little bit the Stop Loss to 94, and the Take Profit I will decrease it to 67.

    I click on accept. There’s a difference. I have a much better strategy here. There is a drawdown in the beginning, but in the recent period, it goes with a very stable line upwards.

    And this is one of the strategies that I’ve created recently with the Auto trading software. So having the RVI 10, which is the default doesn’t work, but 18 is much better and as well the Stop Loss and the Take Profit.

    Now for this strategy, I have a very detailed statistic. If I click on the chart, I have the balance chart, long balance, short balance, and we have the drawdown in percentage, currencies, stagnation in days.

    auto trading software
    The balance chart.

    As well, we have the journal where we see when the trades were opened and closed, what was the price, what is the Profit or loss.

    The journal.

    The indicator chart is what makes the Auto Trading Software precious.

    We have an indicator chart, which is very interesting.

    The indicator chart.

    Here we can see where the trades were open, where they were closed. We can see precisely the moment of the entry. For example, we have a long trade because the RVI crosses the signal line, and when this is confirmed on the opening of the next bar, we have the trade. And we have a short trade, so it should be on the opposite side.

    We have a sell because the RVI crossed the level line downwards. There’s a lot of statistical information, very detailed backtest output.

    Statistical information.

    We have the count of entries by weekdays—Profit and loss in currency by weekdays, which is very interesting as well.

    Additional statistical information.

    We have it by entry hour and exit hour, count of entries, profits, and losses by entry hour, and we have monthly performance in currency.

    This is something exciting, so we can see which months this strategy was profitable when it was losing and so on. A lot of detailed statistics with this Auto Trading Software. Which are not available in Meta Trader if you perform a backtest there.

    Now, the best thing with the EA Studio is that with one click, we can export it as an Expert Advisor for Meta Trader 4 and for Meta Trader 5.

    With one click, we can export the EAs for MT4 and MT5.

    And if I click on it, I will have the Meta editor opened, and I have the strategy code.

    auto trading software codes on mql4
    The MetaEditor.

    I have the complete code for the strategy. The parameters are on the top with the different indicators, the Stop Loss, the Take Profit, and all the rest below. Now, if you’re not an advanced developer, I will not suggest you touch anything in the code.

    No programming skills required.

    And you can compile the Expert Advisor, and it will be ready for the Meta Trader platform.

    You can compile the Expert Advisor.

    You can see there are 0 errors, 0 warnings, which means the code is just fine. So this is how you can build your strategies by entering the entry rules, the exit rules, Stop Loss, Take Profit, and you can export it as an Expert Advisor with one click.

    You don’t need to have any programming skills. You don’t need to hire a developer to code the strategy for you. The Expert Advisor Studio just exports the ready code.

    This is why many traders use this Auto trading software. It makes the trading so much easier and transperant.

    Thank you for reading!

    This was a free lecture from our Online Trading Course: Expert Advisor Studio Basics

    Cheers.

  • Out of Sample in Forex with Robots

    Out of Sample in Forex with Robots


    Out of Sample in Forex.

    Dear traders, today I will talk about the In Sample and the Out of Sample in Forex trading when using the EA Studio software.

    In the Generator, I leave it to In Sample, actually from the drop-down menu, you can see that there is 10% Out of Sample, 20% Out of Sample, until 50% Out of Sample.

    What is the Out of Sample in Forex?

    Out of Sample in Forex
    Out of Sample percentage.

    If I leave it to In Sample, this means that the Generator will use all the historical data we have from our data source. So it will use all the bars from the 3rd of October, 2014 till today. It will generate strategies based on this data over these 99,695 bars that I have at the moment.

    Historical data.

    Now, if I switch to let’s say 20% Out of Sample, it means that the Generator will generate strategies eliminating the most recent 20% of the historical data. I will click on the start, and the green zone appears.

    Out of Sample in Forex
    The green zone.

    The green zone is 20%. And all the strategies into the collection, they will have a separate green zone.

    Strategies in the collection.

    So the thing here is that the Generator uses only this white zone. And it generates strategies for the first 80% of the historical data that we have. And then for the rest 20% which is the Out of Sample in Forex. I

    It simulates trading like what would be the result if we were trading this strategy on the market.

    The In Sample in Forex.

    One more time, it generates strategies from 80% of the historical data. And for the last 20%, it shows the results like simulated trading.

    This is very useful because we can see how this strategy would perform if we placed it back some time ago.

    And I can tell you precisely what is the time if I click on it, and I go to Out of Sample monitor.

    So the In Sample is the white zone, 80%. This is from the 3rd of October 2014 till the 6th of June, 2018. And the Out of Sample, the green zone, is from the 6th of June, 2018 till today. So it’s like 1 year and 1, 2 months or something.

    Out of Sample monitor.

    And you can see that this strategy actually made losses until the end of the In Sample part.

    And on the Out of Sample part, it made great profits. And if you test this method of Out of Sample in Forex you will see that some strategies, they make a profit in the green zone. Some of them make losses.

    So just to summarize it, one more time, when we use In Sample, it’s like we simulate trading with the strategy, and the Generator uses 80% of the historical data to generate the strategies, and for the last 20%, it simulates trading.

    And if you select, for example, 30%, this green zone will be 30%. Now, the thing is that I don’t want to have into the generator strategies that are losing in the Out of Sample. I don’t want to filter them manually. I don’t want to close them this way and to spend time filtering the strategies.

    The acceptance criteria for Out of Sample in Forex.

    Now, there was an update recently, which changed a lot the Out of Sample. In some of my courses, probably you might hear that I was not a fan of Out of Sample in Forex before. But when the update came, it changed my view for the Out of Sample. And I use it almost every day when I generate strategies.

    So if I go to the Acceptance criteria, you can see that below there is this In Sample part, which is 80%, and it’s called training. And we have the Out of Sample, which is 20%, the green zone and it’s called the trading part.

    Out of Sample in Forex
    Acceptance criteria.

    So if I add a minimum Net profit of 0, or let’s say $10, something small, this means that all the strategies will be profitable in the In Sample part. In the white zone. This is more important now than the Out of Sample in Forex testing.

    Now, if I add the same thing in the Out of Sample part, let’s say $10 of a profit, this means that all generated strategies, they will be profitable in the green zone. So I will filter the strategies that are profiting in the simulated period. I will remove all these strategies that are losing.

    Let me go back to the collection. I will remove all of these strategies that are losing. I don’t want to see them. I don’t want to trade with them. I don’t want even to test them. I don’t want to spend time on them. Because obviously, they are losing on the unknown historical data.

    Unknown historical data.

    And we call it unknown historical data because the Generator uses 80%. And after that, it simulates trading in the last 20%. So this is like unknown data for the program when it is generating the strategies. So by having this filter in the Acceptance criteria, we can remove the losing strategies.

    And this is great because this way we can filter a lot more the strategies when we are using the Out of Sample in Forex trading.

    Simply, we can require the strategies that are not just profitable but, for example, that have R-squared above 70, or above 50, above 60, or any other Acceptance criteria like Profit factor.

    For example, we can require from the Generator to give us strategies that have a minimum Profit factor of 1.1 in the green zone, in the Out of Sample part.

    Out of Sample in Forex
    Additional Acceptance criteria.

    This is how it’s working. You can learn more about the Out of Sample in Forex in the Forex Money Management Strategy in 2020: Top 10 NZDUSD EAs . And you will see what great strategies we get at the end when we filter those with the Acceptance criteria and with the Out of Sample and In Sample parts.

    Thank you very much for reading. I hope you have a great day.

    Cheers.

  • Walk Forward Validation in EA Studio

    Walk Forward Validation in EA Studio

    Walk Forward validation is a great robustness tool.

    Hello dear traders, this is Petko Aleksandrov and I have decided to make an update because there was an update in the Walk Forward validation that is included in the Reactor in EA Studio.

    And I wanted to make it clear how the Walk Forward validation work because many of the users and the traders of the Expert Advisor Studio and my students asked me to do such a video.

    Now, if you actually go to Expert Advisor Studio, probably you have noticed that there are already the free videos that I have promised for some time. They are on the right side just below the login box.

    walk forward validation in EA Studio

    So everybody who tests the software has the chance now to get these free videos.

    And this way it will be easier for one to start using the software faster. Now, if you go to the Reactor you will see that it is a generator plus robustness tools.

    Acceptance criteria for the generator.

    We can check the box if we want to use acceptance criteria:

    The reactor.

    With the Generator we can set acceptance criteria such as Profit Factor, Min Count of Trades, etc.

    The Acceptance criteria.

    If the Generator is working on the complete historical data we have the chance to test the strategies with the Walk Forward validation:

    Walk Forward optimization.

    This is the Out of Sample test. The difference now is that when the strategies are being generated with In Sample. In other words, we use the complete Historical data of bars.

    When Out of Sample in the Walk Forward Validations isn’t placed.

    So when the strategies are being generated, we can select them to go through the Walk Forward validation.

    And the final backtest that we have with the Walk Forward validation, it does not use Out of Sample if Out of Sample is not placed in the Generator.

    If in the Generator we don’t place Out of Sample, we stick with In Sample, the Walk Forward will do optimization with Out of Sample of 20%, for example, or any other percentage that you chose. But this will be for the different segments.

    It will not be for the complete backtest at the end of the final backtest. The final backtest will use the Acceptance criteria which we selected. The settings are very similar. Actually they are the same as with full data optimization.

    Performance of the final test according to how the strategy comes into the Walk Forward validation.

    So this makes it just easier for the users. And as well, in the Walk Forward validation, we have the segments and then we have how many validated segments we want to have out of the total number.

    And if we have in the In Sample, let’s say we select Out of Sample 20%, then the final backtest in the Walk Forward optimization will perform a backtest with Out of Sample. Or simply said, the way the strategy comes into the Walk Forward optimization, this is how the final test will be performed.

    It doesn’t matter if it’s coming from the Generator, if it’s coming from the full data optimization where we have Out of Sample. And if we stick with In Sample in both the Generator settings and if we use full data optimization and in both places, you have In Sample.

    As well the final test on the Walk Forward optimization will be without a green zone or simply said without Out of Sample.

    And the Out of Sample that is in the Walk Forward optimization, this is for the segments. Let me go to the Editor and Walk Forward. It is for this thing over here, for this Out of Sample.

    Feel free to ask questions about the Walk Forward Validation.

    I know that the Walk Forward Validation is hard thing in algorithmic trading. But it is important and very useful to be used. Many traders use EA Studio without using the Walk Forward. Which is a pitty.

    But if you use in the Generator In Sample, or if you decide to use the full data optimization and you choose In Sample, the Walk Forward validation will not do Out of Sample with the final backtest for the last parameters.

    We have 1 strategy and there is no green zone anymore.

    walk forward validation results
    Strategy in the collection.

    Basically, it is the very same thing as it was before. The difference is that the final backtest with the Walk Forward optimization is not done with Out of Sample anymore.

    The equity chart.

    And it’s just the same thing. All we want to know is how the strategy performed with the last parameters from the last segment. So the Walk Forward does a backtest for the complete period.

    If the strategy is better, if we have the common Acceptance criteria and if the segments are validated, we will see this strategy into the collection. So this is the difference. And this is the new thing here.

    Feel free to ask me any questions if you have about the Walk Forward validation in the Forum.

    Thank you for reading.

    Cheers.

  • FX Blue Publisher EA for MT4: Quick Start Guide

    FX Blue Publisher EA for MT4: Quick Start Guide

    In this article, I will show you how to use the FX Blue Publisher for MT4 to identify which are the top-performing trading robots while trading with portfolio EAs. Moreover, I will make a brief review of the FX Blue website, which is a website where we can follow the statistics for our trading accounts.

    Getting Started with FX Blue

    The good thing is that once your MetaTrader account is linked, all the Forex statistics update automatically.

    This is a free lecture from my Top 10 NZDUSD EAs course, And you will learn how I use the FX Blue website to analyze the trading results from the Experts I include in this course.

    Below you can see an overview of the account and you can follow the performance.  But keep in mind that this overview is based on the performance that we have so far. In our case, we have 10 days of trading.

    FX Blue account overview
    Account overview.

    A true monthly return will be available when 1 month passes. Since the example below is just for 10 days, this is not enough to have a reliable monthly return. So the monthly return is based on the performance we have so far. And then we have the Profit factor which is 1.62 in this example.

    And what more we have on this FX Blue website is the balance and the equity. As well, we have the returns, total return per day, per week, per month.

    One more time, this Forex statistics is based on the performance so far. Other statistics that are available are results in days, weeks, months, which is too early to look at that.

    FX blue statistics
    Other statistics.

    And as well the winners, the losers, all trades and so on. Now, what I look at the most is the strategy.

    Forex statistics
    The strategy.

    This is where I see which strategies made profits so far, which strategies made losses. On the left side, we have the magic numbers and then we have the number of trades, the gross profit, the gross loss, the Net profit.

    Profit factor is my favorite among all Forex statistics.

    The Profit Factor is the ratio of the Net profit versus the Net losses. Or in other words, the profit divided by the loss. And this is one of the things I am looking at.

    We have the winners, the losers. So we can see how many winning trades, how many losing trades we have for each strategy.

    If I scroll more you will see average win, average loss, average trade, best trade, worst trade, longest, shortest trade.

    Forex statistics
    Other statistics.

    So we can see how many hours these strategies keep the trades open, like the average length for the trades in hours. And then we have the pips.

    Forex statistics and Profit Factor
    The pips.

    Also very interesting, we have how many pips we have won and how many pips we have lost. And here are the net pips and totally we have 157.2 pips. And here we have the Pip Profit Factor.

    So it’s like the same thing as the Profit Factor we have with the Net profit but here we are in pips.

    And if I scroll more you will see how many lots were traded totally.

    The lots in FX Blue
    The lots.

    And in the end, we have an average length of winning trades in hours and an average length of losing trades in hours.

    We have the consecutive profit and the consecutive losses, consecutive pips is over here, maximum consecutive winning pips, and maximum consecutive losing pips.

    The FX Blue statistics

    So it’s really a lot of statistics that you cannot understand from MetaTrader if you’re looking at the account history.

    We have as well the days, the months, the weeks, and many more that I really don’t look at. I mean I look at them just to have an idea but I concentrate on the strategy.

    So if I use these Forex statistics and arrange the strategies according to the Net profit, I just click on Net profit 2 times and on the top, I will have the strategies that made the most profit.

    Net profit
    Click on Net profit twice.

    And in the end, we have these 3 strategies making losses. Actually, this is not a strategy. It says no magic number.

    Magic numbers
    No Magic number.

    And if you remember at the beginning of the course I opened 1 lot trade to show you how you can check if you have a commission for your broker or not. So I closed it on -6 and I had a commission of 6, totally -12.

    So this means that actually the profit from the strategies for these 10 days, it’s not 137.75 but it’s actually 149.75.

    Total Net profit.

    Because I have this -12 from that open trade there. And actually, I can remove it if I filter the statistics. Let me try to do that.

    So if I filter the start date let me see when that was today’s the 29th of August, 10 days ago should be right about here on the 19th.

    Following the results.

    Let me try 21st, I click on filter.

    The filter.

    It is removed.

    Strategy with no Magic number is removed.

    So just the result from this trade is gone and exactly I have 149.75.

    So what happened, I was placing the Expert Advisor somewhere on the 19th or on the 20th. I think actually it was on the 20th and then the first trades started to open from 21st. So I will leave it this way in order to remove this trade which is not from our statistics. It’s not what I am looking at.

    Analyzing the FX Blue statistics from the Forex strategies.

    So in the Top 10 NZDUSD EAs course, I will show you how I follow the results over here, what I’m looking for. And I will give you some ideas about how you can select which strategies to use from these 10 Expert Advisors. Because it really doesn’t mean you have to use all of them.

    Of course, you can if you want. But what I normally do when I test Expert Advisors on a Demo account, is I look at their performance and I choose which ones I want to put on my live trading account.

    And the best way to do that is to test these on a Demo account and to see which strategies are currently profiting.

    Because as we said, every strategy has a profitable phase, a losing phase, which is very normal. But the thing is I want to trade the strategies only in their profitable phase.

    How to install FX Blue Publisher EA

    I continue now from the 99 Bitcoin EAs account where I have already some results. And as I said, it is very hard to follow the results from the account history. When we have many different Expert Advisors. And I said that you have 2 options to manage the 99 EAs. You can keep it this way, trading in 1 account.

    And at the moment you decide you want to go for a Live, you put the 99 EAs and you go for the Live Account. The 2nd option is to keep the 99 EAs on your Demo Account. move the top performers or the EAs that are currently profiting to your Live Account. The reason is every strategy has a profitable period. Every strategy has a losing period.

    Amongst these strategies that are trading, some are in the profitable phase, others are in the losing phase.

    The strategies in MetaTrader
    The strategies

    What I will show you, is how to extract the EAs that are in their profitable phase. And from there, you can move these EAs to your Live Account. For that purpose, I will use one statistical website called FX Blue.

    FX Blue platform
    FX Blue platform

    I am not doing a promotion

    It is free to use, its service is about adhering to results. The website is fxblue.com. Don’t take it as a recommendation or something. I’m not connected to the website, not promoting it or anything. Just it has this FX Blue Live feature which allows the traders to follow the results on their accounts.

    Actually, we have a lot more statistics and we can see exactly which are the EAs that profit the most. Now, according to accounts synchronization, it depends on what you are using. If you are using MetaTrader 5, 4, cTrader, there is the Publisher EA/app, etcetera. What I will go for is MT4 account synchronization.

    I click on MT4 account synchronization
    I click on MT4 account synchronization

    I click on register and now I will select the broker server.

    Here we have hundreds, maybe thousands. I don’t know how many they are, we have a lot of servers and brokers. Let me look for HFMarkets. It is SA Demo Server, the one that I have, yet I will need to write down the account number. It is 40669106. Read-only password – here you have 2 options. 1 is if you receive the Read-Only password from your broker or recently actually not all brokers provide the Read-Only password. This is known as similar to the investor password.

    A different method of registering

    I will show you a different method. I will write down my own password, and put down my email as well, which is petko.alexandrov, this is my personal one. I’ll just type it in and click on Register.

    I click on Register

    Now this will bring me to a page that it says, Please verify your email address to get access to the full range of FX Blue services and you’re currently publishing your results using account synchronization. Click on Please verify your email address,

    I click on the verification button
    I click on the verification button

    a small window will pop up where I need to put my name and address and I will click on Send SMS.

    FX Blue Publisher EA account registration
    I click on Send SMS

    What happens is I will receive an email on the phone and I need to reply to that email from my email saying anything as a subject line. Hello. Thank you. And this will verify your email. I just did it from my phone. Got the SMS, I sent email to the email they sent me, which is confirmation. I click on continue.

    Software installation

    What I will need to do is click on Apps,

    I click on Apps
    I click on Apps

    and I will click on more apps at the bottom.

    Then I click on More apps
    Then I click on More apps

    This is the one that I need, FX Blue Publisher EA for MT4.

    FX Blue Publisher EA for MT4
    FX Blue Publisher EA for MT4

    I will click on that one. It is free.That’s an Expert Advisor that will publish my results. Click on it, it’s just downloading in my downloads folder, double click on it again.

    It’s very easy actually to install it and to use it. Just if you follow the steps one by one, you will see that it’s nothing hard. And it asks me for which account I want to install. I have quite many accounts and MetaTrader platforms installed. The one that I’m showing right now is the one with Hot Forex.

    I click on Install,

    I click on Install
    I click on Install

    and it says the software has been successfully installed. I will go back to the MetaTrader platform. I right-click and refresh.

    FX Blue Publisher EA

    The same thing as installing Expert Advisors on the platform. Here it is – FX Blue Publisher.

    I see the FX Blue Publisher
    I see the FX Blue Publisher

    It is ready to use. Usually, need one more chart to use the FX Blue Publisher EA. I already opened 99 charts, that’s the maximum with MetaTrader. Clicking on the Chart Window. Undoubtedly, nothing happens, it won’t open another chart.

    It’s 99 is the maximum. That’s why I’m using 99 EAs to get the maximum out of it. The FX Blue Publisher needs a chart. Now what that means, is that I will look for one Expert Advisor that has no trades opened at the moment. And how do I recognize it? There was a trade that was opened and now it was closed.

    A trade that opened and closed
    A trade that opened and closed

    All the rest, they had open trades.

    There are trades opened and actually, that could be a historical moment that I’m recording right now. We can see something, $20 000 for the Bitcoin was just hit and everyone was waiting for that moment for years. Now it happens whilst I record this lecture.

    Trading with Expert Advisors

    That’s the great thing when trading with Expert Advisors. It doesn’t really matter what happens on the market, I am trading with Expert Advisors and no matter what I’m doing, I have many Experts trading on my other accounts right now.

    I see very nice profits with this demonstrational account and its very similar to what I have in my other accounts. Reas why I love trading with Expert Advisors. I don’t need to do anything manually.

    Bitcoin is already above the $20 000, something I was waiting for, as I knew that there will be more volatility and nice profits in my accounts. Let me continue what I was explaining. The FX Blue Publisher EA needs to have a chart and I will just use 1 chart with 1 Expert Advisor that has no trades opened at the moment. And this is the 1 with 737, ending on 737.

    How the FX Blue Publisher EA works

    When I run the FX Blue Publisher, I disable this one for a while. And then after that, I put it back. I just want to show you how it works. Double click on the FX Blue Publisher and it asks me if I want to stop the 737 Expert Advisor and execute the FX Blue Publisher, click on Yes.

    I click on Yes

    Importantly, I will click on Common and I need to allow the DLL imports.

    The Common settings
    The Common settings

    And in Inputs, I need to put my FX Blue username and the password. I enter the password and on the top, there is the account number 40669106, and pretty much that’s it. click on OK.

    I click on OK
    I click on OK

    And it says sending data to FX Blue Live, last publication, successful. It just took a few seconds.

    It takes a few seconds
    It takes a few seconds

    Now after we are ready, what I will do is simply go back to the FX Blue and I will click on FX Blue Live and view accounts and I will click on statistics.

    EA statistics in FX Blue Publisher
    The statistics

    These are the statistics that I have from the account. I can see a few stats that are useful. Weekly return, monthly return. This is based on just 2 days of data that I have.

    FX Blue Statistics

    It says 9 days because the account was opened previously, I started with the Experts just 2 days ago and to see the floating profit loss, the balance, the equity rising right now because it is the Bitcoin time breaking the $20 000. The thing is, if I click on Strategy, I can see all of the trades.

    I can see all the strategies arranged by the Magic Numbers.

    When I click on Strategy
    When I click on Strategy

    And the result is combined.I know for each Expert Advisor, how many trades were opened, what was the profit, what was the loss. I know the net profit as well. I have many more statistics like profit factor, winners, losers. If I scroll to the right, I see a lot of statistics. Pips, we have average wins, average losses. It’s a lot.

    I’m not going to talk about all of the statistics just in the next lecture I will share with you some more of what are the systems that I have been using. I will give you a few different options and you will know how you can select which strategies to extract for your Live Account.

    Conclusion

    You could be testing the 99 EAs on a Demo Account and extract just the top ones. If I click on the net profit twice on the top, I will see the Expert Advisors that brought the most profits. The first one is great. It already did 9 trades and it did most net profit, which is just $6.

    This is why we trade with 0.01. If you are trading with 0.1, that would be $66. If you trade with a complete lot, that would be $666 of a profit. And if I scroll down, you will see the total net profit, which is 110. And if I scroll to the right one more time, where were the pips. You can see that we already have nearly 12 000 pips.

    The pips
    The pips

    Finally one more time in Bitcoin.

    I’m definitely going to check what’s going on in my other accounts. Maybe I will take some quick profits. That’s a great time for the Bitcoin breaking the 20,000, definitely. And I will bring back the Expert to this chart and I will see you in the next lecture.

    If you found the lecture about Forex statistics and FX Blue Publisher EA useful, share your thoughts below. Thanks for reading.

  • Dow Jones Algorithmic Trading with Robots

    Dow Jones Algorithmic Trading with Robots

    Dow Jones Algorithmic trading.

    Hello, dear traders, this is Petko Aleksandrov and today I will show you some results from my Dow Jones Algorithmic trading which I have captured in a course. You can see already I have $60.84 as a profit into the account and I have more trades open and closed.

    Dow Jones Algorithmic trading
    Account profit.

    So let’s have a look at what we have in FX Blue. Right here we have the same total Net profit. And you can see the strategies opened more count of trades.

    Total Net profit and Count of trades.

    So what more we have as a statistic from the Dow Jones Algorithmic trading, if I scroll to the right side you will see that I have the numbers of winners, losers, these are the numbers of trades. We have it in percentage as well.

    And we have the best trade, worst trade, a lot of statistics.

    Dow Jones Algorithmic trading
    Additional statistics.

    We have as well the length of the trades like the longest, the shortest, the average length of the trades. You can see some trades last just a couple of hours, some last overnight. And on the right side, we have the pips which are very interesting for me.

    Dow Jones Algorithmic trading
    The pips.

    You can see there is a huge difference when we’re trading index like Dow Jones and when we are trading with the Forex currency. So I have total win pips here, total loss pips. As net pips, I have 694.2. And I have at the same time a total Net profit of $60.84.

    The pips in Dow Jones Algorithmic trading.

    So there is a huge difference over here when we’re talking about the pips in Forex trading and when we’re talking about the pips with Dow Jones or the other indexes.

    Basically here the pips are much more. And I always like to have a look at the pips. I will share with you how I’m using those later with Dow Jones Algorithmic trading.

    We have pip Profit factor, we have as well the total lots traded and some other statistics till the end as consecutive losses, consecutive wins, maximum consecutive winning trades and so on. A lot of statistics.

    More statistics.

    First, I am looking at the Net profits to see which are the profitable strategies and which are the ones that are currently losing. And then I have the Profit factor and the number of trades.

    Now, as we said, every strategy has a losing period. If you remember when we generated the strategies, on their balance chart there were these drawdowns, stagnation periods, then it’s profit again, stagnation period, and so on.

    Very normal for every strategy. The thing is I want to trade the strategies into my live account only when they are in their profitable phase.

    Recognizing the profitable strategies.

    And how do I recognize the good strategies when I do Dow Jones algorithmic trading?

    Simply, I test them on a Demo account and I see which ones are making a profit at the current moment. Because this is like the real thing we have at the moment.

    Having a backtest is very useful because we see how the strategy performed in the past, but this is in the past. It’s not in the future. There is never a guarantee that this strategy will continue profiting in the future.

    So this is why I test the strategies for the current moment, for the current market conditions and I want to see which strategies are currently profiting, which strategies are currently in their profitable phase.

    So one thing is I wait for a minimum 5 count of trades. You can see the first one got already 7, then the second is still with 4, then the third and the fourth, they have 5 already. And then you can see the rest, some already have above 5, some below 5.

    Count of trades.

    So I wait for 5 to make sure that the equity line of this strategy is going upwards at the moment, And I combine it with the Profit factor.

    I am looking for a Profit factor above 1.2. So you see that the first 5 strategies, they have Profit factor above 1.2 but only 3 of those are having already 5 trades.

    The first one, the third and the fourth one. The second is still with 4. So these 3 strategies are ready for real trading.

    Combining count of trades with net pips.

    Another method that I am using is to wait again for 5 trades, 5 counts of trades and I combine it with the net pips. So you can see the first one did 358, then 204, 194, 180, 178.

    Dow Jones algorithmic trading
    Net pips.

    So I’m looking for strategies that have above 100 pips. And you can see that in this case, I have the first, the second, the third, the fourth, the fifth and the sixth one.

    Now, here I will have the very same strategies. Because these are the ones that have above 5 trades and they have above 100 pips and they have Profit factor above 1.2 at the same time.

    And the third method I am using is the winners and the losers.

    The 3 methods I use in Dow Jones Algorithmic trading.

    In this case, I wait for 10 trades minimum, and then I want at least 7 out of the 10 to be winners, then I would consider these strategies trading for my live trading account.

    So, one more time, 3 methods, 3 different methods I use. The first one is having a minimum of 5 trades and a Profit factor above 1.2.

    The second one, having 5 trades as a minimum and above 100 net pips. Here they are. And the third one is a minimum of 10 trades and then 7 out of the 10 to be winners.

    Now, it doesn’t matter which method you choose. Actually, you’re very welcome to create your own method, how to filter the strategies, and how to select which ones to place on a live account.

    I just want to share with you my methods, how I am doing it. But I combine the 3 methods with the different accounts, with the different assets, because this way again I achieve better risk diversification.

    So I use different approaches and it’s the same thing having a good risk diversification when we’re trading with many strategies.

    Risk diversification.

    You can see I am trading many strategies, even if some are having losses at the moment, the others compensate for it. Now, another important thing is, if you select strategies for your live account, make sure to select a minimum of 3 strategies.

    Because if you select just 1, for example, the best one at the moment and you put it on your live account, there is the chance that this strategy might turn into its losing phase and it will bring you some losses. But when you place 3 strategies, they will compensate each other, just what the 10 strategies are doing now.

    We want to trade not one, but many strategies together in 1 account. And for me, it’s a minimum of 3. It really took me a lot of time to come up with this conclusion that I have to trade with many strategies, not only 1.

    Because this way, when any of the strategies lose, the others compensate for it and you can see it very clearly here.

    Moving strategies to the live account.

    So now, I will be using the first method that I shared with you and I will use the Profit factor above 1.2 and Minimum count of trades 5. This means that the first one, the third and the fourth are ready for my live trading account.

    dow jones algorithmc trading
    Strategies ready for live trading.

    And one last thing, when you move your strategies to your live account, make sure to follow the results there as well.

    And if you are following Profit factor above 1.2, you will have to remove the strategies from the live account if their performance goes below 1.2. So it’s the same criteria that you should be following there. So this is how I select the strategies and I will move those to my live account now.

    And when any of the other strategies reach 5 trades and Profit factor above 1.2, I will move them as well. The best thing you can start with is to open another Demo account and simulate it as it is your real trading account.

    Just open another Demo account with the same broker that you have selected to use and place there the 3 strategies that are making a profit for you currently.

    Use another Demo account for simulation the Dow Jones Algorithmic trading.

    Follow the performance of the 2 accounts. And just move from one to the other according to your method that you want to use. This way, you will practice the process and just don’t hurry with trading with the live account until you are sure, until you’re confident with the method you will select to use.

    Thank you very much for reading this post. If you have any questions, let me know at any moment. I will be updating these strategies from the Dow Jones Algorithmic Trading course whenever it is needed. And, of course, I will let you know when I update the course.

    I wish you safe trading and always enjoy when you are trading with Expert Advisors. It’s really not hard. It removes the stress, the emotions that traders have in manual trading and it’s very easy.

    Just be patient to practice sometimes. I’m sure you will find your own method which will bring you some confidence in trading and stable results.