Alright, traders,in this lecture, I wanted to talk about money management because this is very important especially if you are a beginner trader. And when taking your FX training you need to pay attention to that.
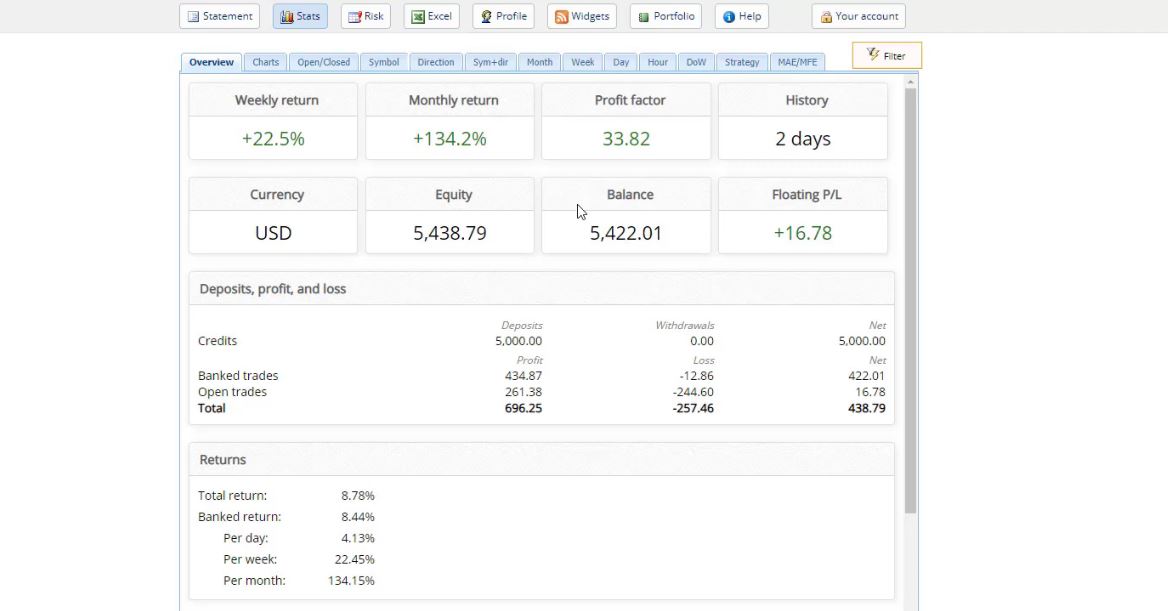
Because having smart money management will keep you longer on the market and most of the beginner traders blow their accounts because exactly of not having good money management. And this is what I want you to remember from this lecture. For the purpose of this article, I will show you an example of an account. I started with 10,000 and now I am at 11,000.
This means that for 1 week or just a little bit longer, I have 10% of the account which is a very good result. And I don’t say it will happen to you when you start trading, that you will have the 10%. Maybe it will be less, maybe you will end up the week losing, it really depends on the market. That’s the one thing you should remember as well, that the results are not always the same. But the better FX training you have, the better results you will achieve.
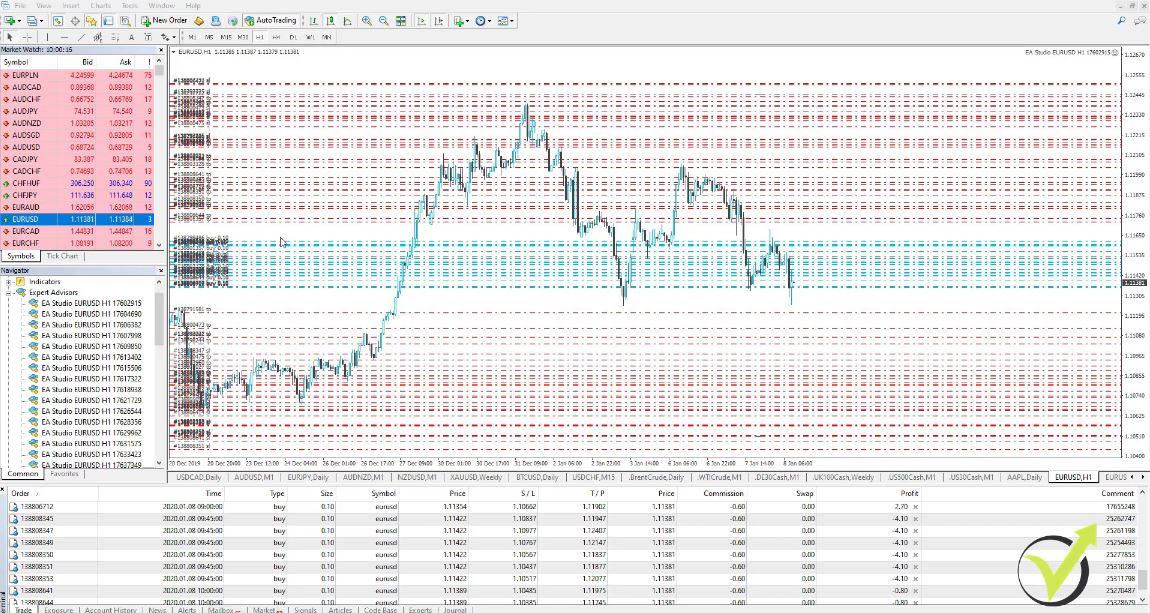
So we don’t have 1 week similar to the next week or to the previous week. Sometimes we have a good week, sometimes we have a bad week, that’s the market. But the most important thing is that we maintain good money management. In a $10,000 account, what I wanted to show you as an example in this course, I’m trading the Expert Advisors with 0.1 lot. This means that in my account I am blocking about $100 for each trade, 100 and something, like 110.
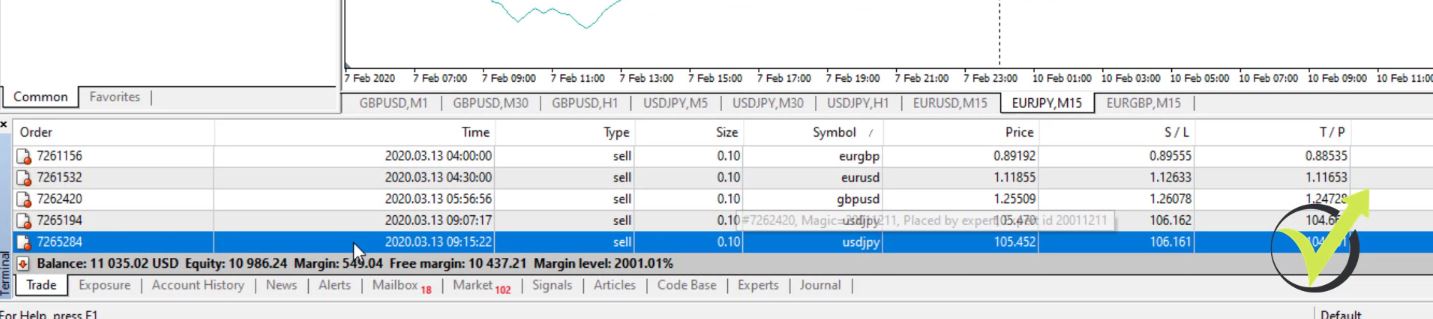
5 open trades are normal for an account
Because you see I have 5 trades opened at the moment,
The 5 open trades
with 0.1 and the margin I am using is 549 which is about $110 for each trade. And this is 1% of my account. Or when I started with 10,110 is just 1.1%. And if all the Expert Advisors open trades, which are 5 Expert Advisors but 2 of them, the GBPUSD and the USDJPY, you can add to the position if you want to. From the Expert Advisors, Properties, you can select if you want to add.
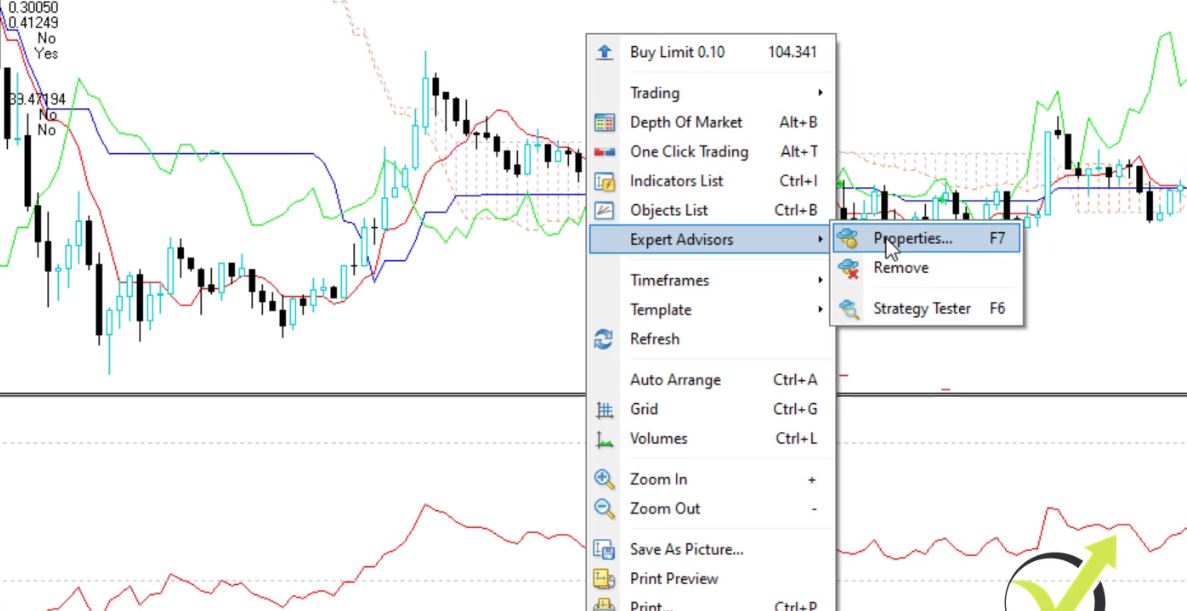
Go to Expert Advisors then Properties
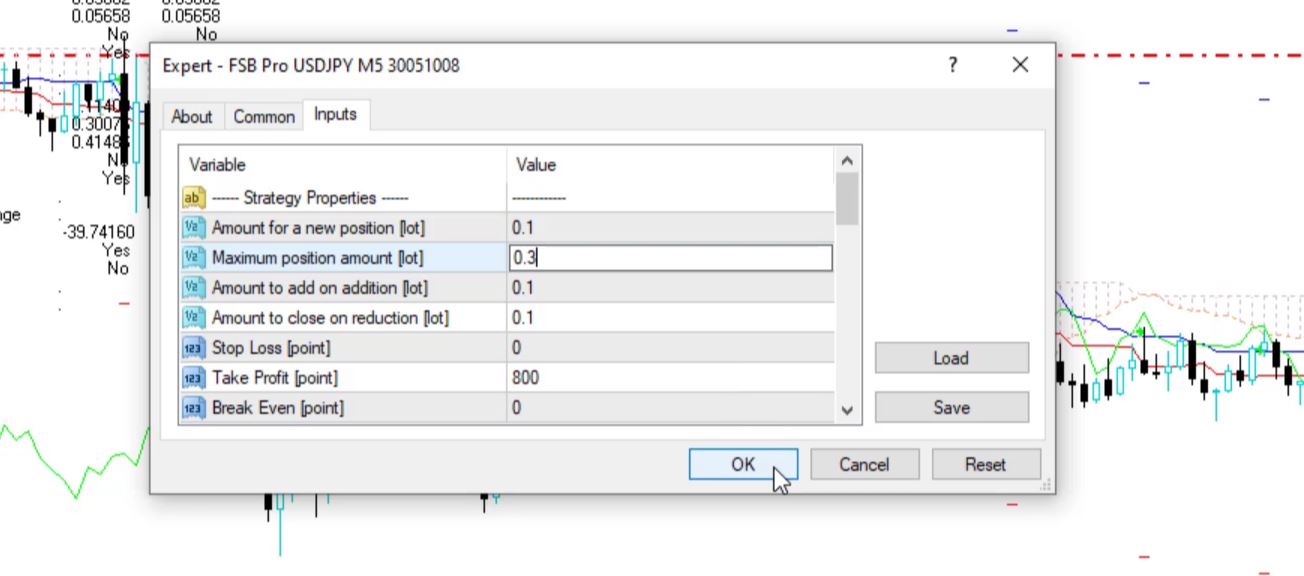
If you don’t want to add, you just leave it as it is. So it will not add to the position because the maximum position amount will be 0.1. I keep it 0.3 so I add 2 more times.
I keep it at 0.3
So if all the Expert Advisors, the 5 of them open trades, and if the USDJPY and the GBPUSD add to the position, I will have a total of 9 trades opened. And each one is 0.10, I will be at 0.9 lot which will block me about $1,000 from the account. That is the maximum I can have and that is what you need to calculate in your FX training before you open a real account.
Each 110, 9 times, it will be about 990. So about 1 complete lot in a $10,000 account which is 10%. But keep in mind something, I’m not risking 10%. I will have the margin at 10% or at $1,000. This is how much it will be blocked from my account to open the trades. The rest will be a free margin like what we see at the moment.
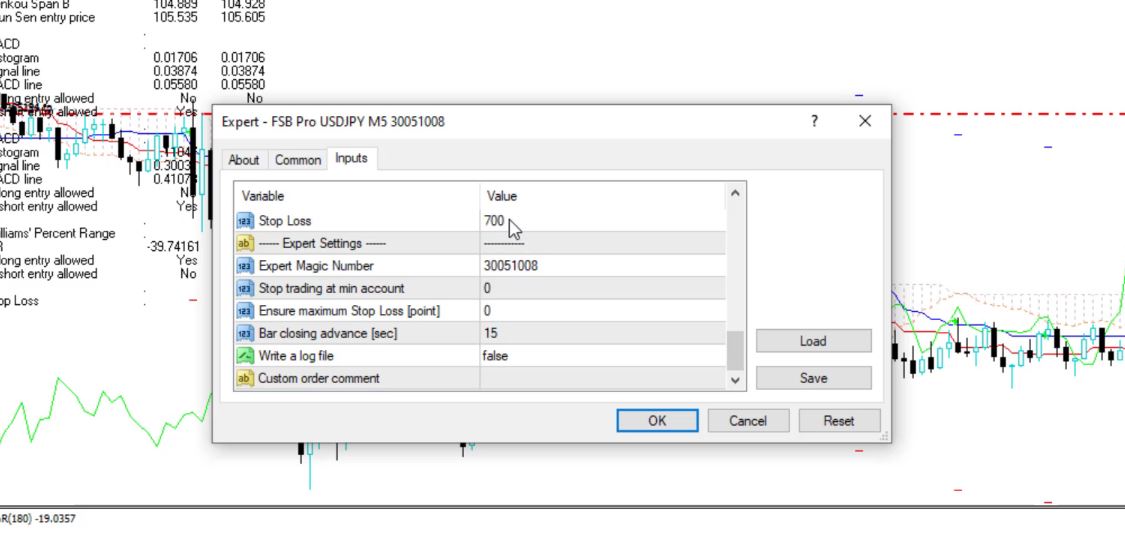
FX Training: Stop Loss is the real risk
So if at the moment all the Expert Advisors open trades, I will have a blocked margin about $1,000 and the free margin will be about $10,000. So this is how much I use from the account to open the trades, but I’m not risking that much. I am not risking 10%, I’m risking a much lower amount. Because the risk is how much you are able to lose. How much the Stop Loss is.
And if you go through the Expert Advisors when you are learning them and doing your fx training, you will see that each Expert Advisor has a Stop Loss lower than 100 pips. In this case, for the USDJPY, for example, we have 70 pips.
USDJPY has Stop Loss of 70 pips
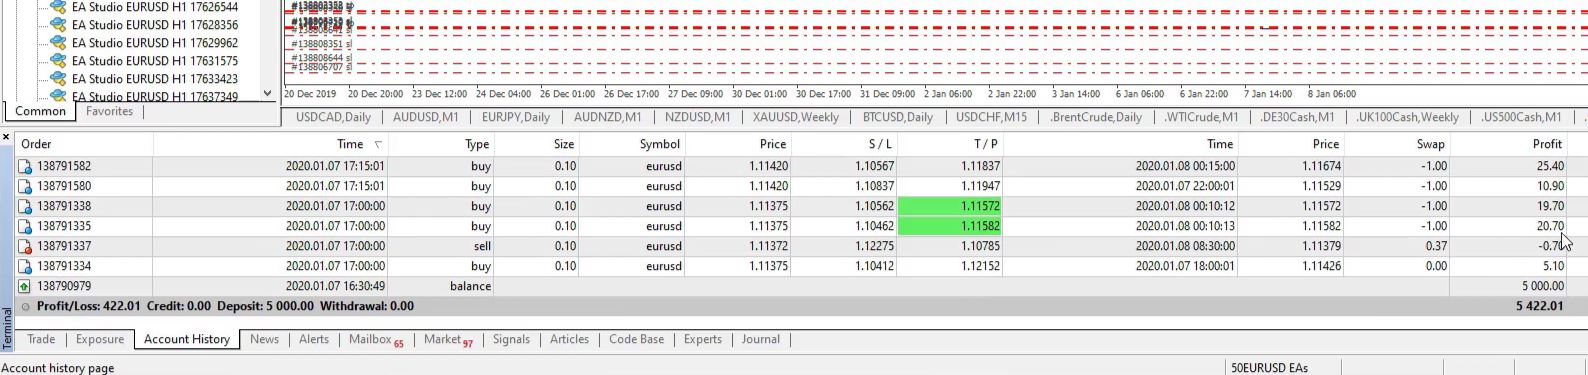
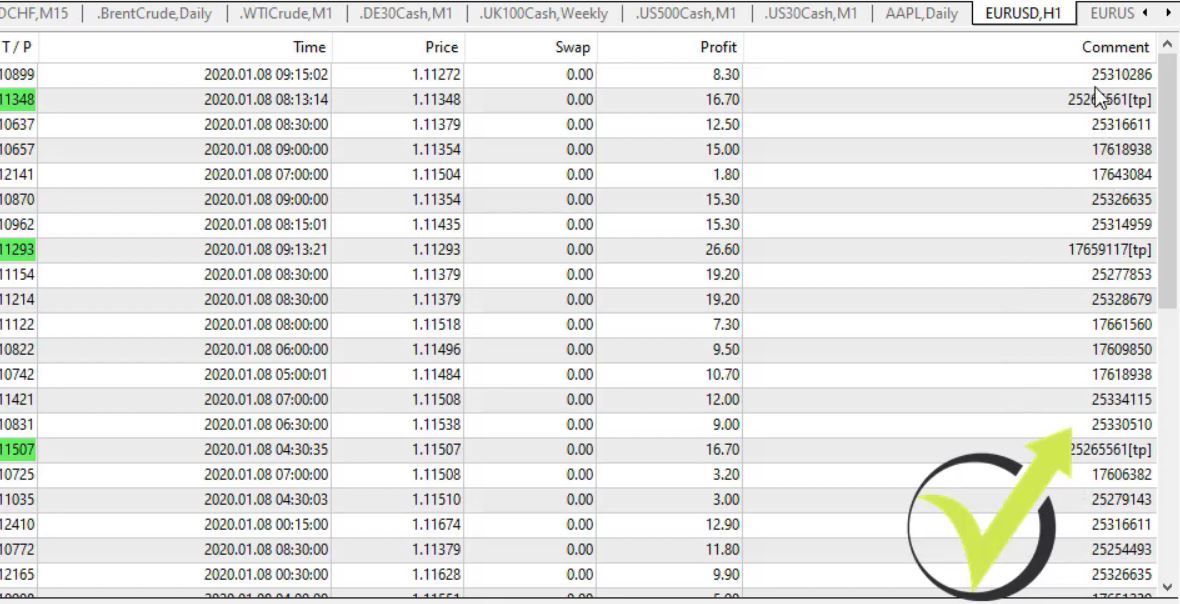
And actually, looking at my account history, I don’t have a loss bigger than $100. All of them are less.
So what I wanted to say is that if you have all Expert Advisors opening trades and they all hit the Stop Loss, this is like the worst-case scenario, you will have a loss lower than 10%. That is something that every FX training education must teach you.
Because it will be 10% if all of them have $100 of a loss with 0.1. With 0.1, if you have 100 pips of a Stop Loss, this will be approximately $100. But, one more time, because all of the strategies have Stop Loss smaller than 100 pips, it is less than $100, and it’s much less than 10% if you combine them all. I will leave that to you.
The worst-case scenario matters
And this is like the worst-case scenario, one more time, if all the Expert Advisors open trades and if all of them hit the Stop Loss. Now, from my experience, this will happen very rarely. It’s not something that happens every day, every week or even every month.
But, one more time, I wanted to say that this is smart money management because I’m never risking more than 10% of my account. So I will just summarize it one more time. If I trade with a $10,000 account, I would be trading with 0.1. So if you are trading with $1,000 of account you can trade with 0.01. And if all of the trades open positions, I will use 10% from the account which will be about $1,000 in this case.
But the worst-case scenario when all the trades hit the Stop Loss which, one more time, is very rare or it might never happen to you, not while fx training and not while real trading.
It will be even lower than 10% because all the Stop Loss are below 100 pips. I hope that’s clear now. And I don’t want to show you how much is the total Stop Loss now because it will change when you’re taking the course.
Test on a Demo account while you are doing your FX Training
So I really hope that makes it clear about the money management, about how much is blocked from the account, and what is the worst-case scenario.
This is something you need to know at all times when you are trading. And the best thing to do is to test it first on a virtual account. Just practice on a virtual account. If you’re planning to open a real account with $1,000 then open a Demo account with $1,000, test the Expert Advisors for a week to 1 month, 2 months, 3 months, depends on how much time you need to test the Expert Advisors for yourself just to be confident with the results.
And don’t hurry to risk real money until you are confident with the strategies. Spend more time on FX training until you are ready. It doesn’t matter if you are trading manually with the strategies, it doesn’t matter if you’re trading automatically,
With the Expert Advisors, the most important thing is to be comfortable trading with them, to be convenient in the strategies. And this is the only time when you should be risking real money.
Feel free to ask questions
And, one more time, don’t hurry with that. I know a lot of people want to make profits quickly but it doesn’t really work this way. You need to test for a longer time, to practice and see how it goes.
Thank you very much for reading. If you have any questions let me know in our trading Forum.
Algo trading courses: this is what we do and today we will answer the top FAQ from our London, NY & Tokyo trading systems
Hello, dear traders, and welcome to the top 10 frequently asked questions for the Algorithmic trading course London, New York, and Tokyo system. So in this article, I will answer the most frequently asked questions that I receive for this course and for all of our Algo trading courses. And I will give you some more details and explanations about the course.
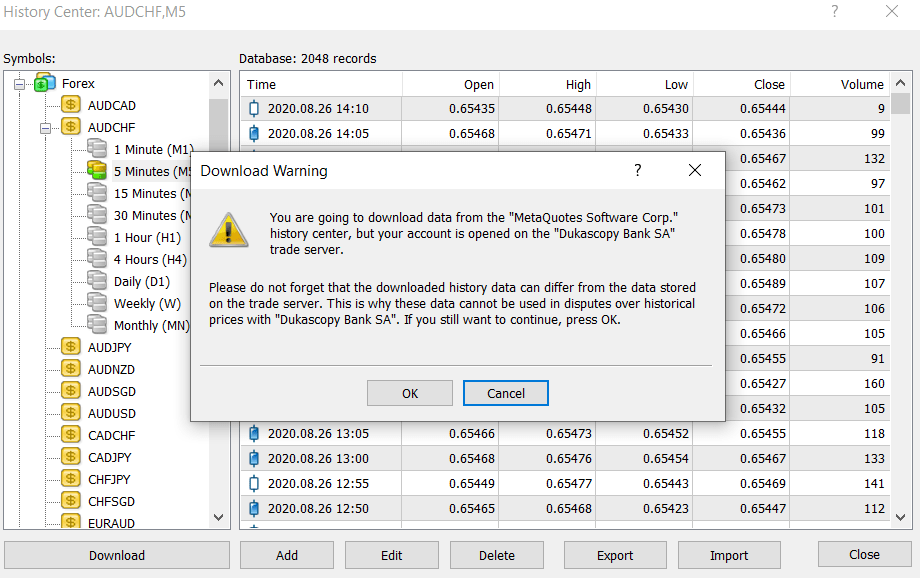
1. “Why should we avoid to download historical data from the history center in MT?”
That is a great question because as we show in all of our algo trading courses, the Historical data is super important. Now, in the history center that we have in the Meta Trader platform, the historical data comes from the MetaQuotes Company, and actually there comes a pop-up message if you try to download the historical data and it says that this data will be from MetaQuotes.
So this is not the data from your broker and we really want to avoid using different historical data from our broker. The idea in algorithmic trading especially when we create Expert Advisors, when we generate them, and when we backtest them, is to do this over the historical data of our broker that we will use for real trading.
Simply, it’s because the different brokers provide different prices every day which forms different historical data.
It could be a very tiny difference between the prices of the different brokers but it impacts the backtesting result. So it is very important to use the historical data from your broker.
2. “What do we do if we already downloaded the data from the history center?”
Now, this question is logical after the first one and the answer is very simple, you will need to reinstall the Meta Trader and start from the beginning. So once you have downloaded the historical data from the history center, you need to reinstall the Meta Trader because already you have the historical data from the MetaQuotes.
And even if you do what I show in my algo trading courses pressing the HOME key and exporting it with the script, it will be over the data you have already downloaded from the MetaQuotes Company. So you just need to delete everything, install the Meta Trader, actually it’s not really a hard process.
It takes no more than 15 to 20 minutes to do the whole thing so just do it again. But you will be sure this way you are trading the proper historical data.
3. “I failed to generate strategies as I learned from the other algo trading courses with the trading session hours, why is that?”
Now, first of all, probably this happens if the user has placed too strict Acceptance criteria in the generator. The Acceptance criteria tool found in the EA Studio. So don’t make the strategies that you’re looking for too imaginary. Look for realistic strategies.
So give it a Profit factor of 1.1, 1.2, win-loss ratio of 0.70, minimum Count of trades, for example, 300 to 400, don’t make it like you are looking for the perfect strategy which does not exist. It is better to have more strategies into your collection when you generate strategies than having no strategies after hours of generation.
Remove the Acceptance criteria to be sure.
So if this is what you are missing, the best way to find out if this is the reason is to simply remove the Acceptance criteria, see if you will have strategies into the collection.
If you do, then you start adding some Acceptance criteria slowly until you find the golden middle, as I say, where you have good strategies and at the same time they are filtered with the Acceptance criteria.
If this is not the reason then probably you have some issue with your historical data, there are some bars missing, or anything in tools that you have placed wrong.
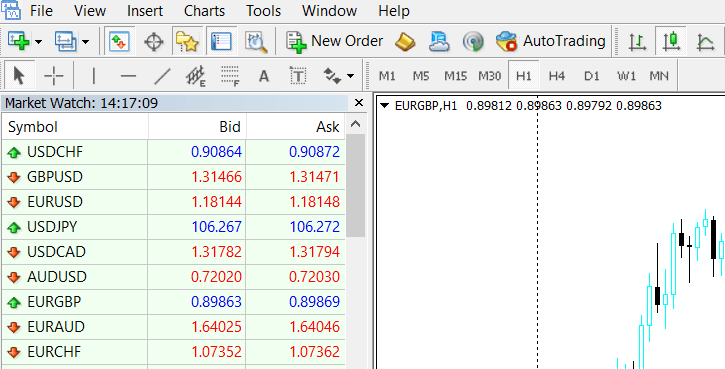
Could be the trading hours, make sure you calculate them well according to your time zone, and actually according to the time zone of your broker because sometimes you will see that your broker will show a different time zone from what is your local time.
So when you’re calculating the London, the New York, or the Tokyo Stock Exchange hours, make sure to calculate them according to the time zone you see on your Meta Trader. It is just above the Market Watch where you see the time zone of the broker.
4. “How do the working minutes impact the outcome of the generator from this course and the other Algo trading courses?”
The outcome is not really connected with the working minutes. The more the generator works, the more strategies you will see. It’s just time. You can set it to work for 6 minutes, you can set it for 1 hour, you can set it for 10 hours which is 600 minutes.
Normally, I show in my algo trading courses that I set it to 10 hours during the night when I’m out, or when I’m sleeping, or when I’m not in front of the computer. Or even when I am here recording the lecture videos, I generate strategies.
I run the generator like all the time because I really want to get more strategies so I have a bigger choice. So probably this answers the question, the more you run the generator, the more strategies you will have, the bigger choice you will have. But it’s not that it will bring you better strategies with time, it will just bring you more strategies with time.
So the more you run the generator the better.
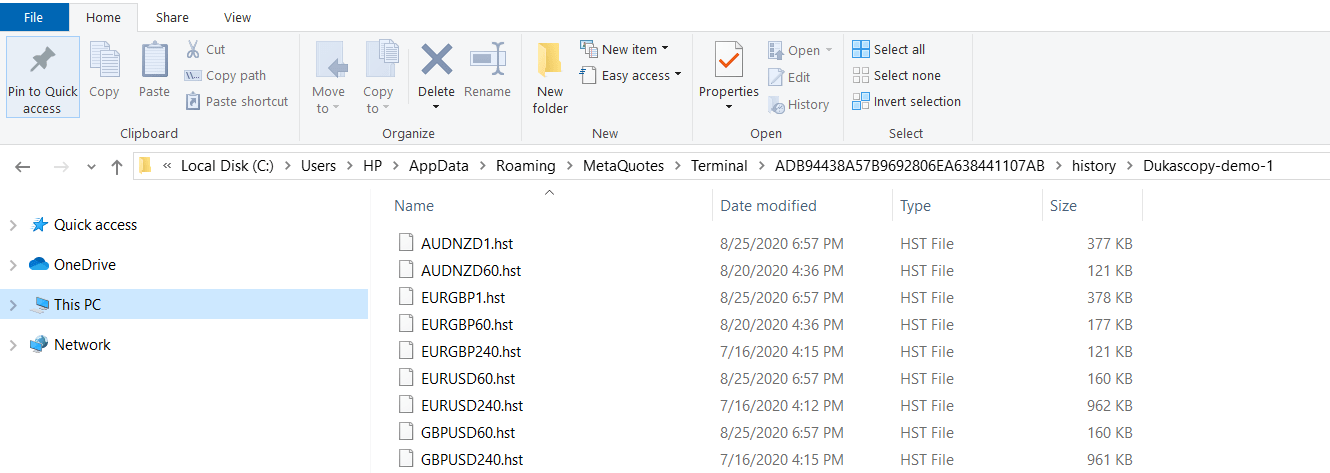
5. “How do I save the historical data bars that are loaded if I reinstall the Meta Trader?”
You can save the historical data bars as HST bars which you can find if you go to file, and then you go to open data folder, and then you go to history, and there you will see the HST files which are stored there.
So just copy those, place them in a folder, and later on, when you install the Meta Trader you can place them back. So simply, from time to time you can download these files and place them in a separate folder where you will store your historical data.
And if something happens with your Meta Trader, you reinstall the windows, you reinstall the Meta Trader itself, you just place them. So do this like every other month or every month if you wish to make sure you will not lose your historical data because it takes time to collect the data and it will be horrible if we lose it.
6. “How often do you make new EAs for this system or any of the others from the algo trading courses?”
Well, as I said already, I generate strategies all the time but personally, to me, this is my work. I do this daily, during the weekends, I do this like all the time. This is my job, this is what I do so I do new Expert Advisors constantly all the time.
I test so many Expert Advisors, I include so many Expert Advisors in my algo trading courses. So I really want to do my best to include good strategies, good Expert Advisors, the robustness to be tested well before actually providing the Expert Advisors in my courses or even if I do it for myself.
I want to trade good Expert Advisors because at the end of the day we’re trading with real money. So we want to make sure that we have good strategies and good Expert Advisors and in order to have those, we need to create new ones all the time. Now, if you do this like your part-time job, as a hobby, just run the generator overnight.
There’s no particular Expert Advisor that will constantly create profits for you.
Run it for 10 hours, leave it there to generate, it will cost you nothing, it’s not time-consuming for you to generate strategies. You just need to set up and run it to generate. You will see how I do it most of my algo trading courses.
On the next day, filter strategies then test them. And this process occurs over and over. But with time I figured out that we need to do this because of market changes, we need to be flexible with the market.
You cannot expect to trade always with 1 single Expert Advisor, which will make you constantly profit. I can tell you that probably 99% of the people that are coming to the Academy, writing me emails, people who are buying Expert Advisors from the market, they hope that they will find this golden Expert Advisor that will make them constantly profits.
Unfortunately, that’s not the reality. If it was, I would give such an Expert Advisor in every course and I would make it easier for everybody. We need to be flexible with the market, create many Expert Advisors daily, test them, and see which one to trade on the live account for the moment.
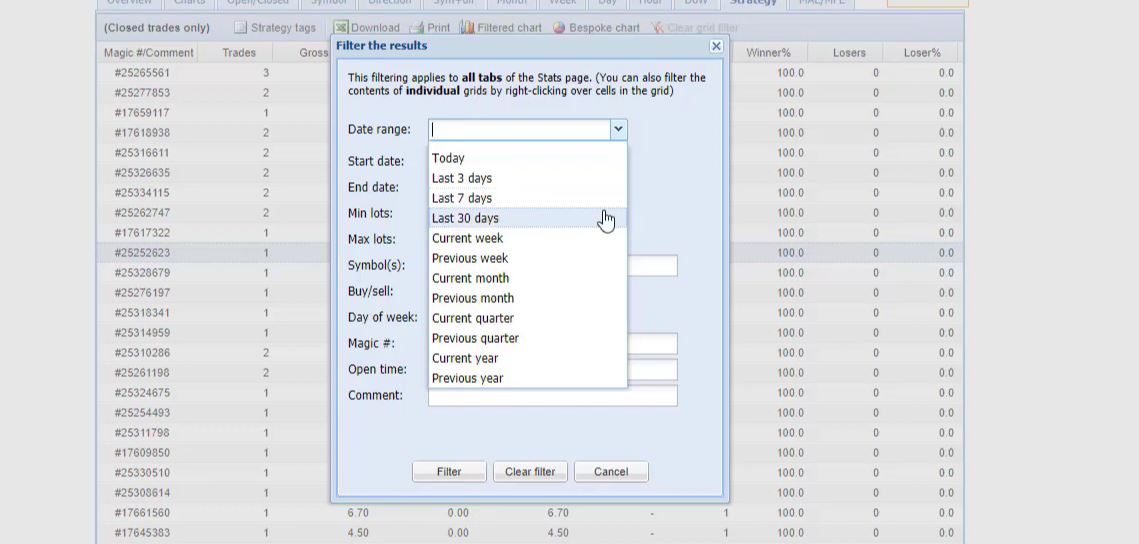
7. “When we monitor the Expert Advisors in FX Blue, should we put constant recent data range?”
When we are testing the Expert Advisors, if you are testing the Expert Advisors for a longer time like a couple of months, or even years, some people prefer to test the Expert Advisors like for really long and monitor the whole period.
You really can change the recent data. For example, you can monitor the Expert Advisors for the last 2 months and always for the last 2 months. So, for example, if it’s now March, I can do it from the beginning of January, and in April I can do it from the beginning of February, and in May from the beginning of March.
I’m always looking at the last 2 months, how the Expert Advisors performed during the last 2 months. And this is an example. You can do it for the last 1 month, for the last 1 week, it is up to you. In most of my algo trading courses I leave it to the traders at the end how they want to manage the EAs.
The robustness of the EAs
But it’s really a good idea to drag the period behind you because this is what makes it important. We’re looking and we’re concentrating on the recent historical data, the recent market conditions. Not the last 6 months, the last 1 year, even if we are using this long period when we’re generating strategies.
But this is different, we do this because we want to have strategies with many Count of trades. This is what brings the robustness, the essential part of the robustness. With the more Count of trades we have in the strategy, the more it is reliable in the future. But this is to generate the strategy.
To follow the results on FX Blue you can use some period for the recent month or 2.
8. “Why do we set 999999… as a number of bars in chart properties?”
Well, there is the next question together with this one, “I still get different bars for all time frames.” The 999… which I said we place in the properties is just because there is a limitation the first time we install Meta Trader with 65,000 bars.
We want to remove it and that’s why we place just 99999…as much as you can so you don’t have basically any limitations. And then if you reopen it, you will see some random number which comes from somewhere in Meta Trader. I have no idea about that. It’s just a number I think randomly they have selected to put. This is because we never see such a huge number of bars.
So we simply remove the limitation for the number of bars and then we just press the HOME key, we load the maximum historical data as possible, and for timeframes, of course, it is different. For M1, M5, you will see a huge number.
Difference between the higher and the lower timeframes in my algo trading courses
In the beginning, probably it will be somewhere between 70,000 – 80,000 bars. If you keep your Meta Trader open for some time, for a couple of months, it will be up to 200,000, 300,000, 500,000 if you keep it like for a longer time. And with the higher timeframes, like H1, H4, daily chart, you will see just a couple of thousands of bars which is normal.
Because one is 1 minute, the other is 1 day. So this is why there is a difference but it’s not connected to where we place the 999. Simply, there we remove this limitation from the Meta Trader.
9. “In all algo trading courses, you include Expert Advisors but in this one, you did not, why?”
Well, there is a simple reason behind that. With this course, I show the system where we are trading with the specific hours for the trading sessions. And with my time zone, these Expert Advisors would not work with any other time zone.
So if I include the Expert Advisors, they will be working only with the traders in my time zone. This you understand is very limited and it doesn’t make sense to do it. So this is the reason I cannot include the Expert Advisors that I use for this system because of the time zone.
10. “Should we really avoid trading currency pairs only with the dollar?”
Well, this is kind of a mistake for every beginner trader at the beginning. As far as I remember I did this mistake many years ago as well. I was focusing to trade only GBPUSD, EURUSD, USDJPY, USDCAD, AUDUSD. Because obviously these are the major pairs and they have the lowest spread and we want to trade the lowest spread.
The problem is that we put too much exposure to the dollar. And when we have some important news for the dollar, when we have some volatile move there with the dollar, it pressures our account.
And sometimes you will see huge profits, sometimes you will see huge losses and drawdowns if you have only the dollar currencies and if you are trading many Expert Advisors only on currencies with the dollar.
That is why I prefer to diversify the risk of a couple of different currency pairs.
These are the 10 frequently asked questions that I receive for the Algorithmic trading course London, New York, and Tokyo system and for all the other algo trading courses. If you have any other questions, you are very welcome to drop them in our trading forum. Many people are already there sharing their experience which is just great and you are very welcome to do it.
Thank you for reading and always enjoy the trading.
Algorithmic trading strategies: the easiest way to participate in the market
Dear traders, I will now show you how to place algorithmic trading strategies on MetaTrader. Most people know them as Expert Advisors or Robots. These are automated strategies that execute the trades for us.
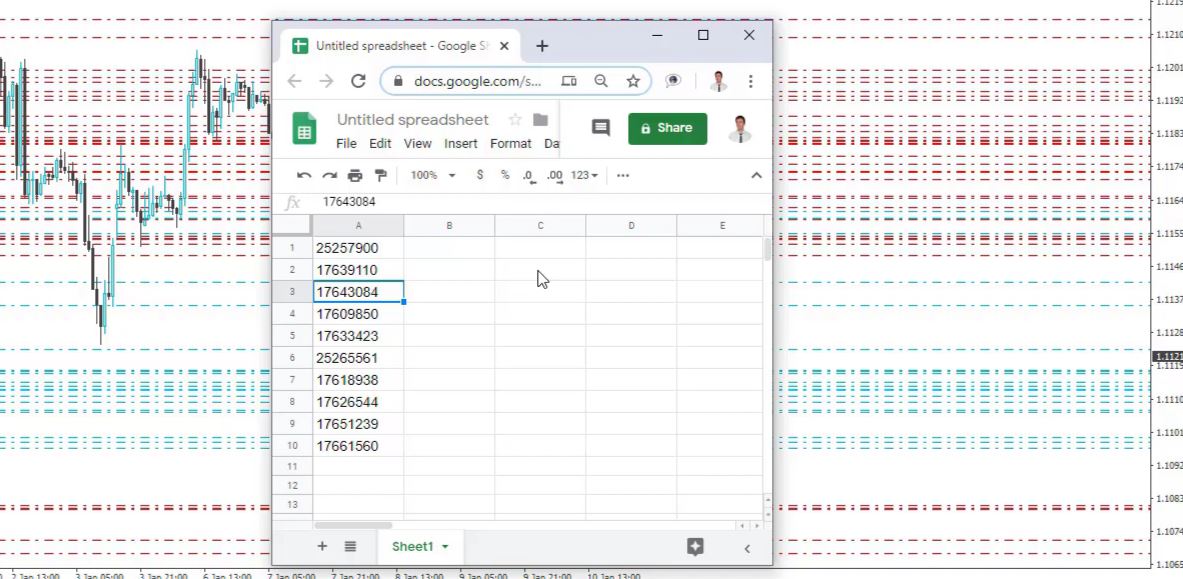
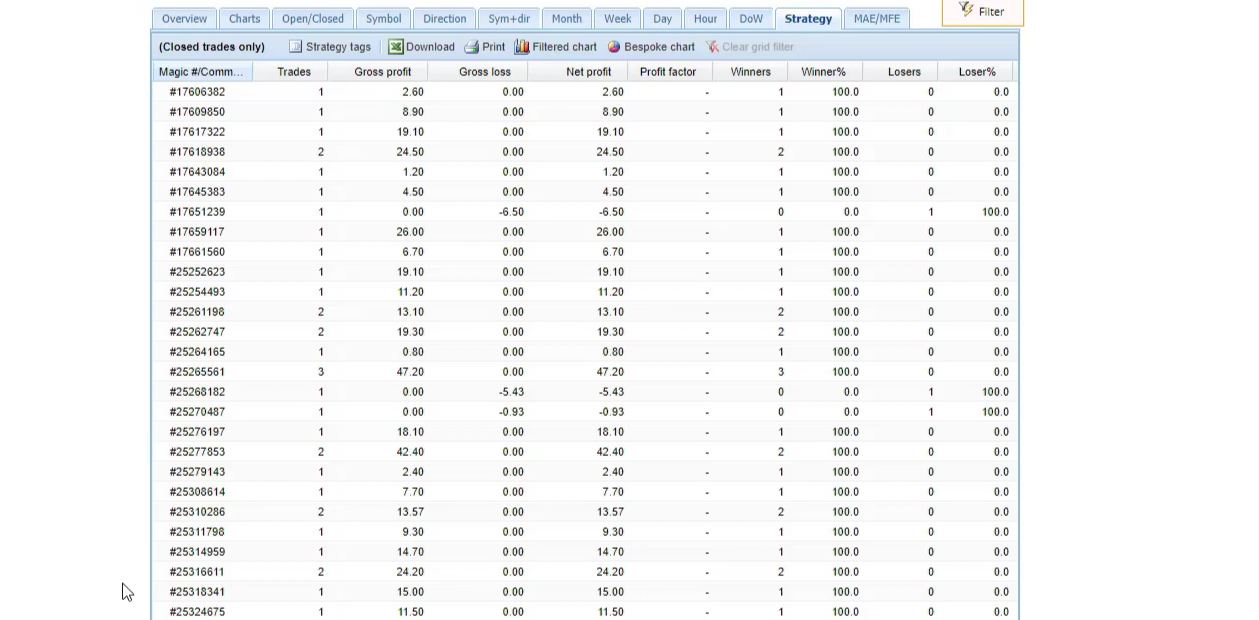
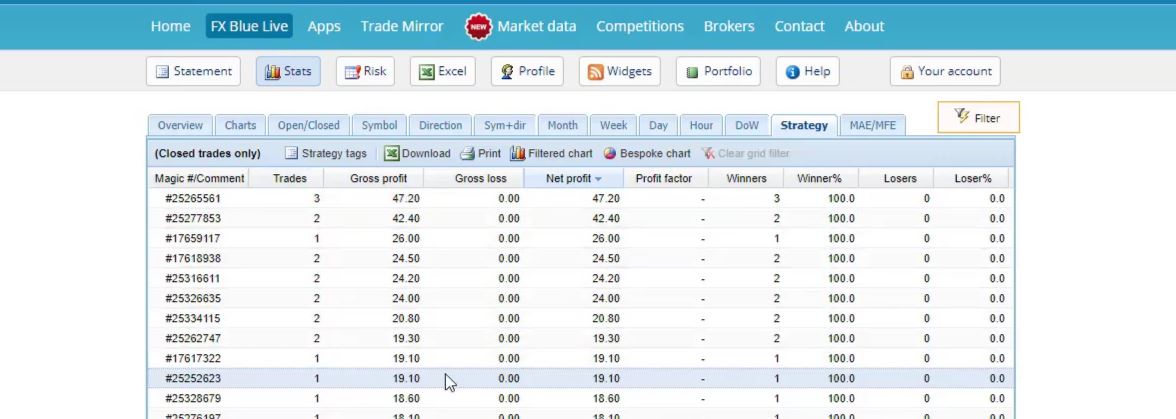
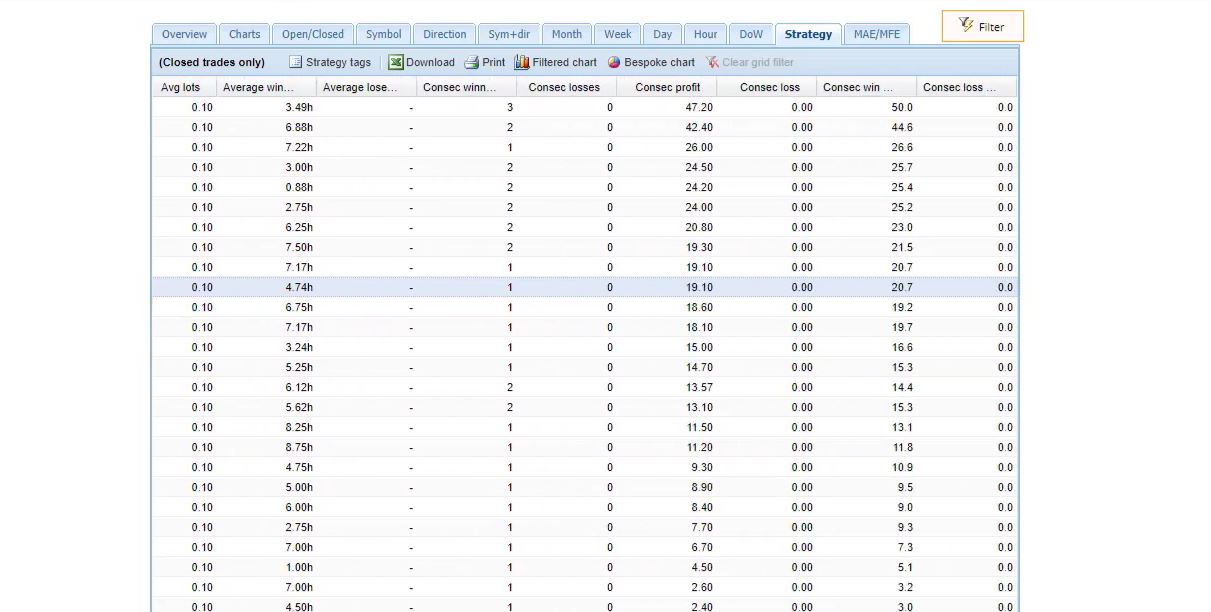
So I have tested 50 Expert Advisors for my Top 10 EURUSD Algorithmic trading course and I have these 10 Expert Advisors on a separate account. Here are the Magic Numbers, and I will show you how to take them out of the 50 Expert Advisors.
The Magic numbers
Once again, I always suggest the students open a second Demo account to practice the system and not rush to trade a live account until you are satisfied with the results.
Second, I don’t want to stimulate anybody to trade real money. You should do that when you are confident and when you have enough experience with the Expert Advisors. And this is why I have opened another Demo account, a smaller one with $3,000 on one of my other computers. I use the Team Viewer software, and this is the platform on the other computer.
The 2nd Demo account
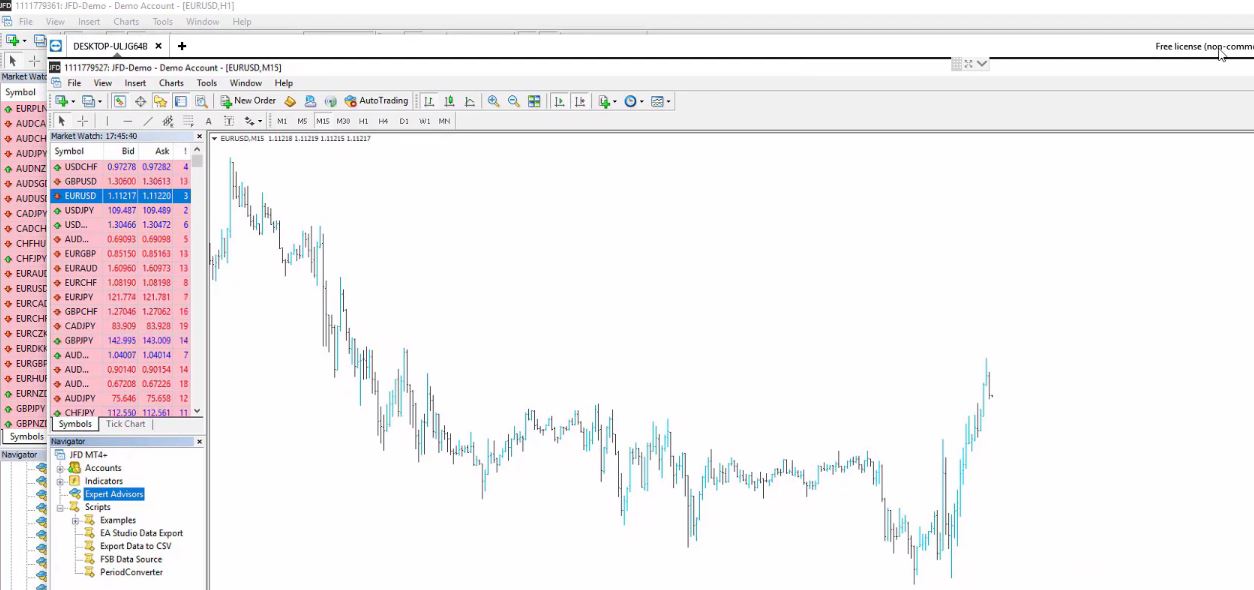
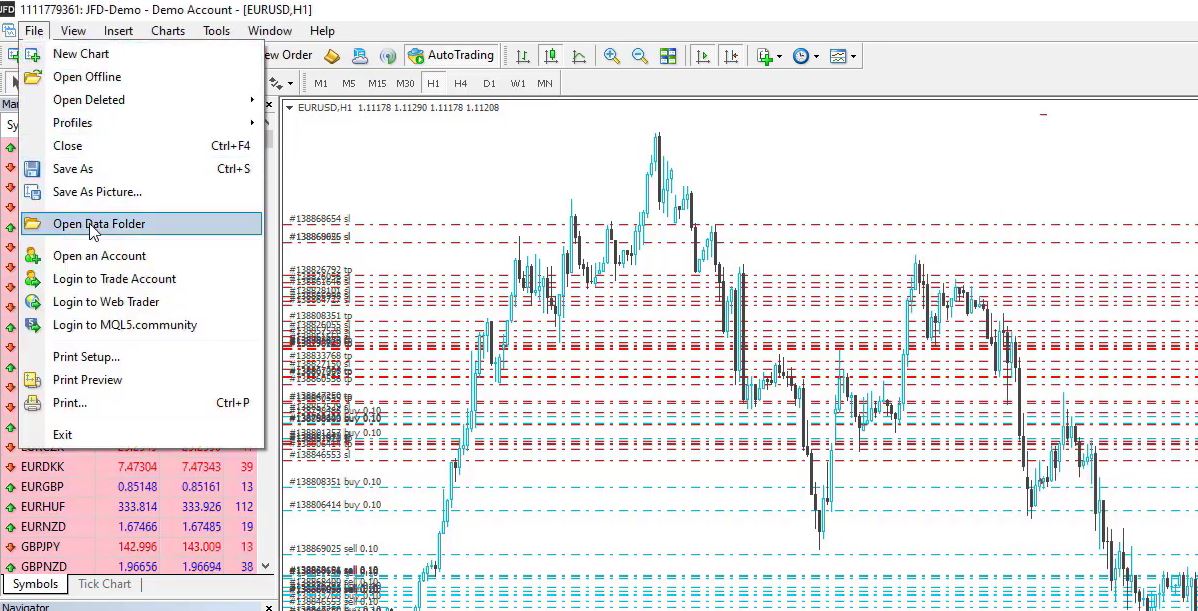
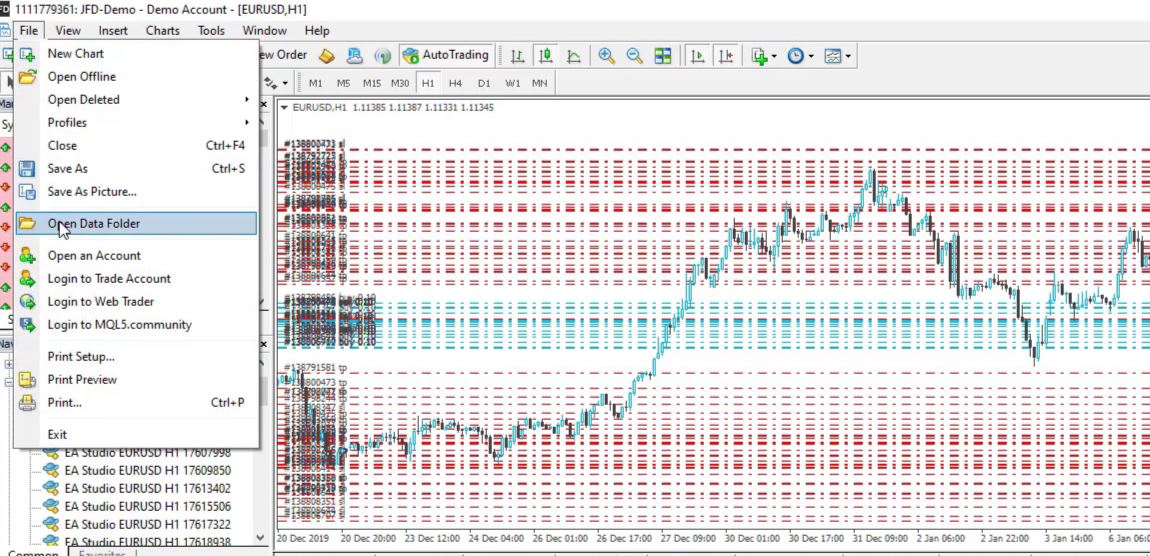
So here, I will place the 10 Expert Advisors or these are the algorithmic trading strategies that did most profit until the moment. I already opened 10 charts for EURUSD. Now, what I will do first is to take these Expert Advisors out of the 50. So I go to File, Open Data Folder,
Go to File then Open Data Folder
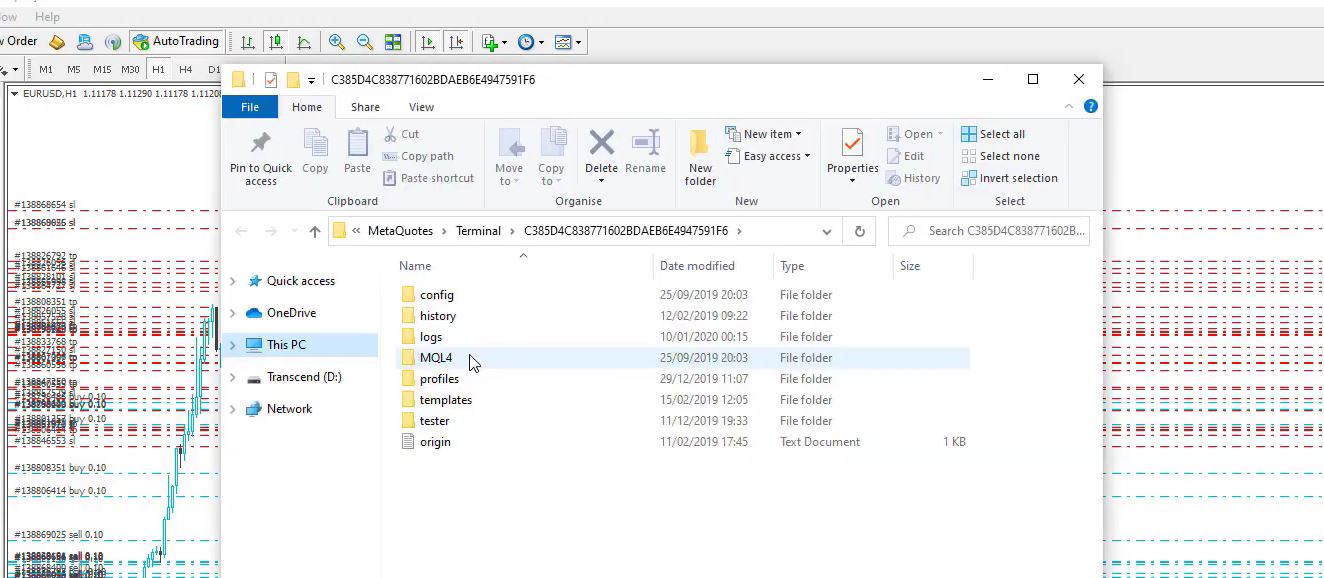
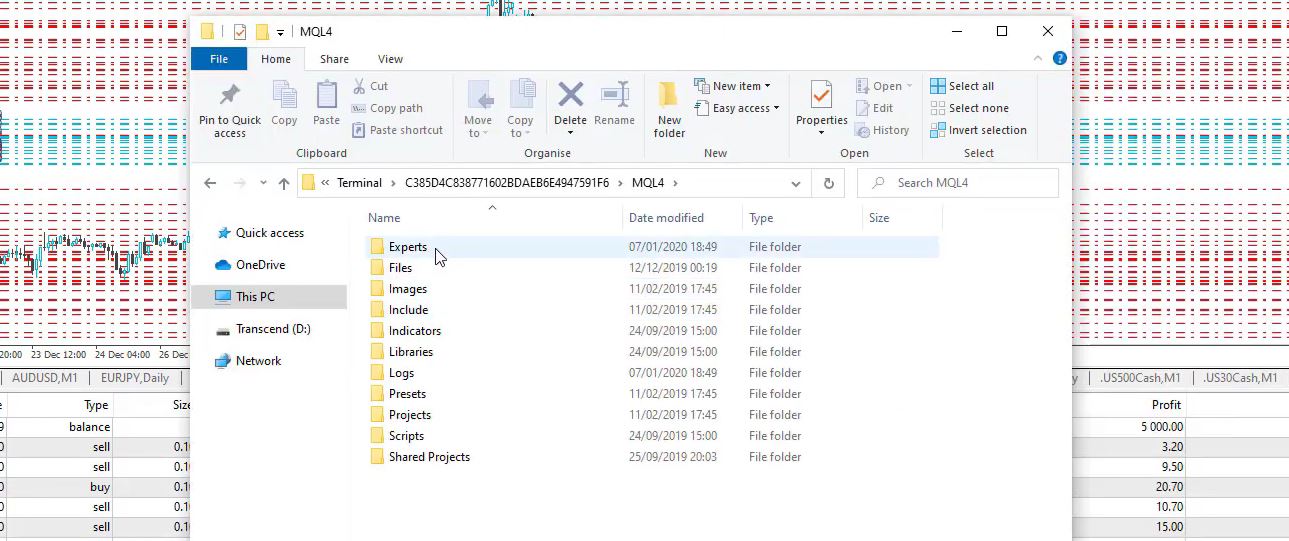
and then I go to MQL4,
MQL4
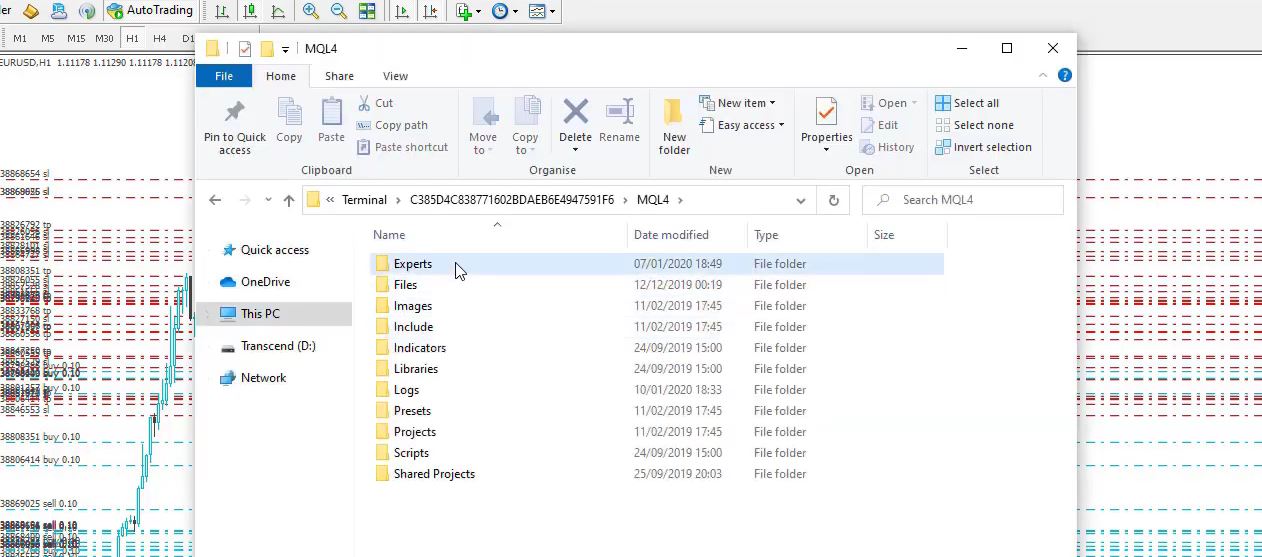
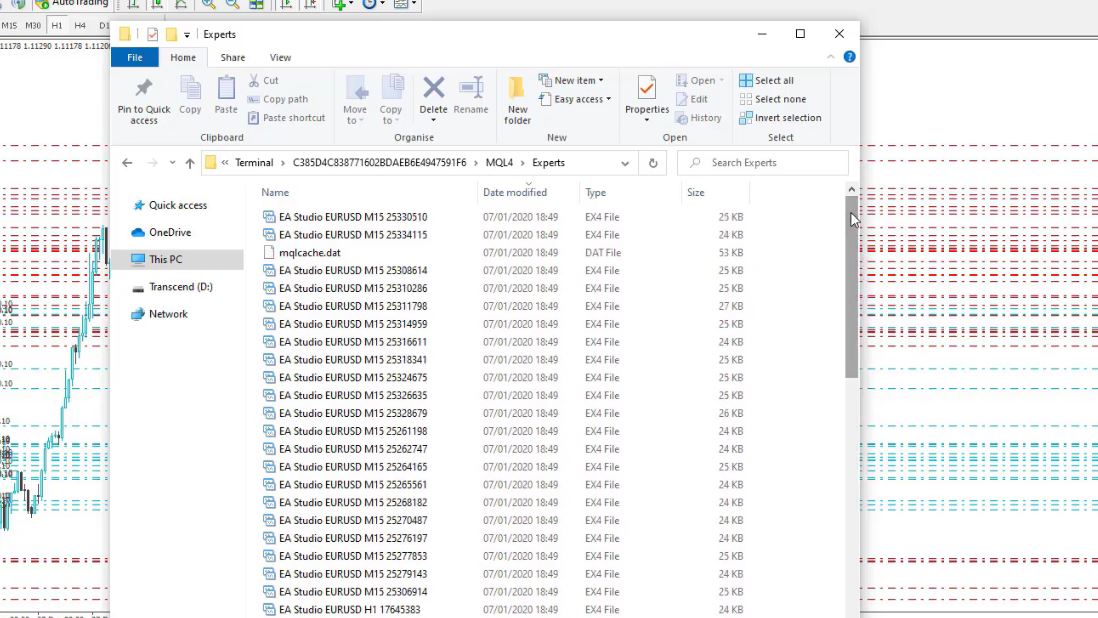
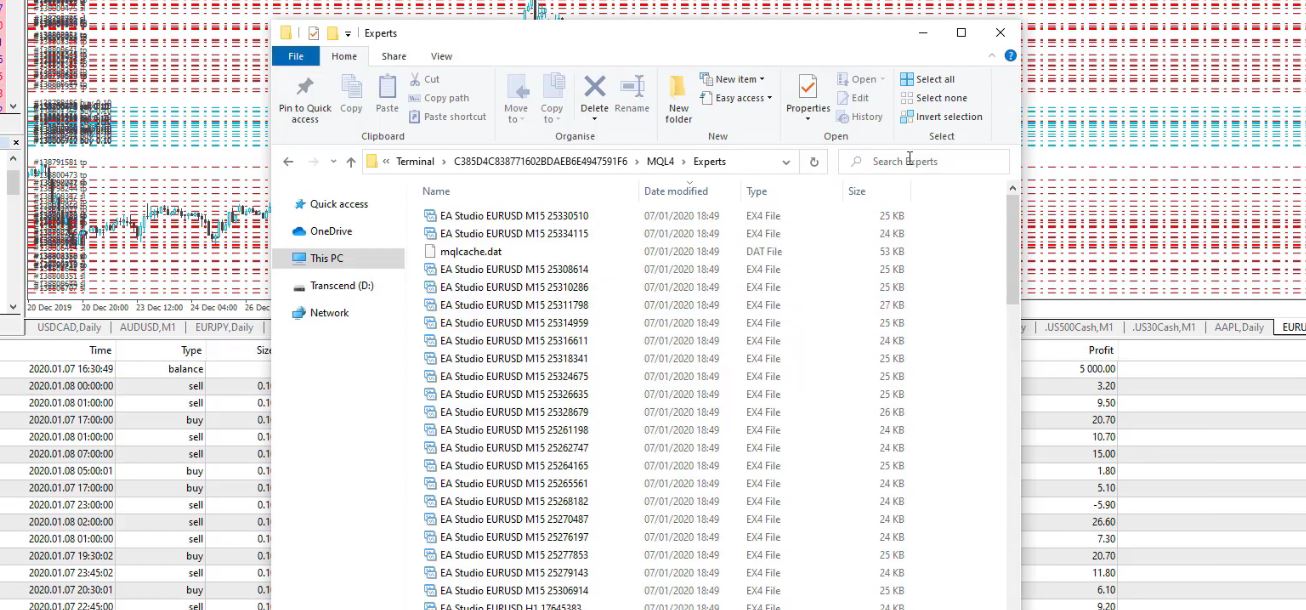
and I go to Experts.
Experts
Now, here are the compiled files, EX4.
The EX4 Files
You can take the code and compile it on the other computer or the other platform. It’s up to you.
You can install more than 1 Meta Trader on your computer to test more algorithmic trading strategies.
But, as well, you can take the compiled files. An important point to note is you can install 2 Meta Traders on the same computer. It’s only that in this case, I preferred to have it on a different computer because I already had a couple of Meta Traders installed on the computer I was using at that moment. I don’t go with more than 3 – 4 Meta Traders per computer. So you don’t need a second computer.
You should have a different Meta Trader platform on your computer. It’s a common mistake that traders open a second account on the same Meta Trader, and they switch between the accounts. If you open a second account on the same Meta Trader and you switch to the other account, you will disable the Experts on the first account.
This will mess with the statistics a lot. You can have 2 or 3 Meta Traders on your computer, but the thing is that you need to place the separate 10 Expert Advisors on different Meta Traders, not the same one. I hope that’s clear.
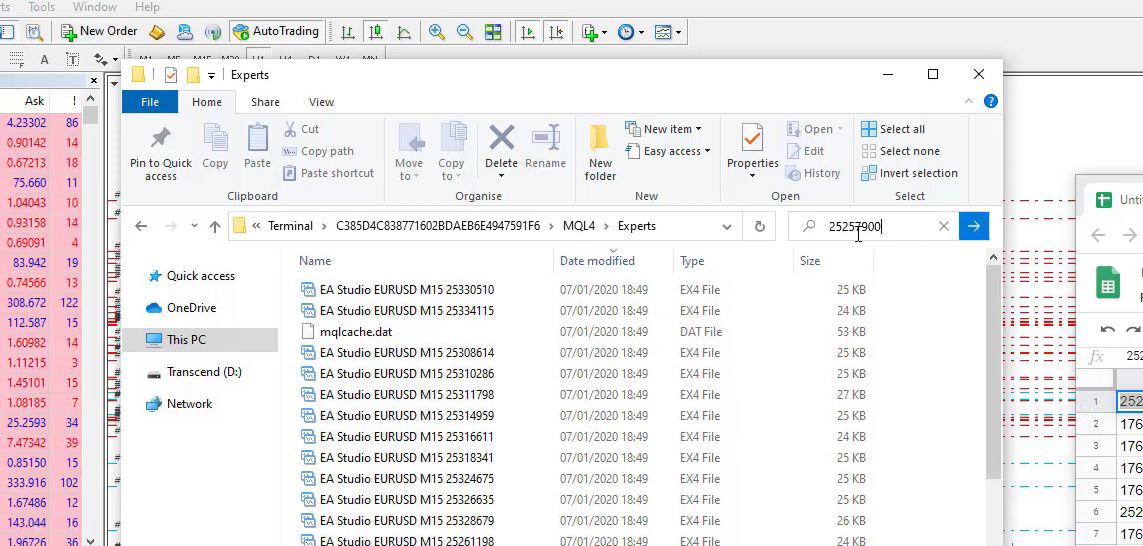
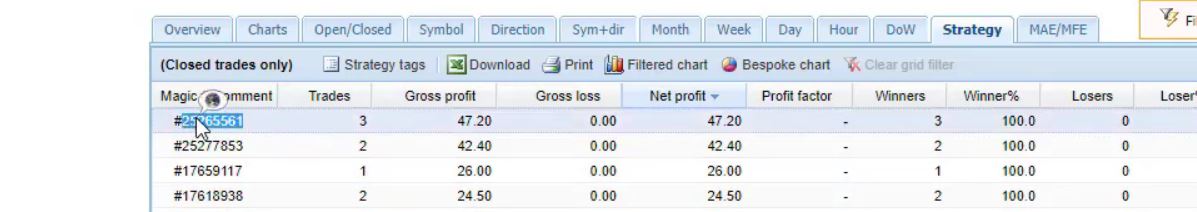
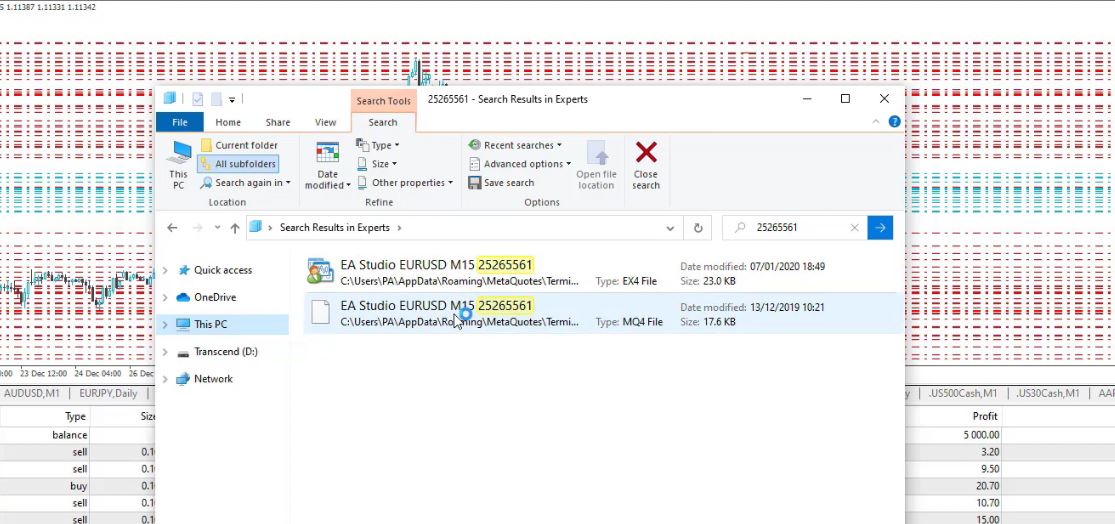
Search Experts if you want to find algorithmic trading strategies by the Magic numbers
Let’s go back to the Expert Advisors. I have the Search Experts bar, which makes it easy. I will copy the Magic number, and I will search for the Expert,
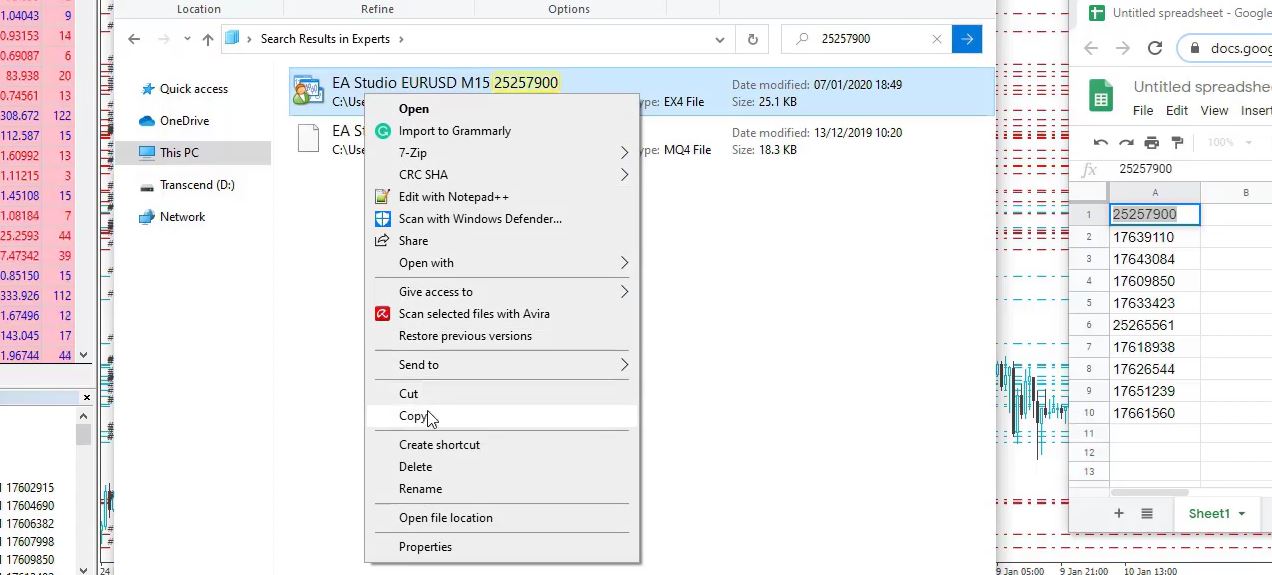
Copy the Magic number and paste it in the search tab, and it gets displayed. So I will copy it.Copy the Expert Advisor
Now, you can create a folder where you will paste them, or you can paste them straight away to the other platform, it’s up to you. It doesn’t matter.
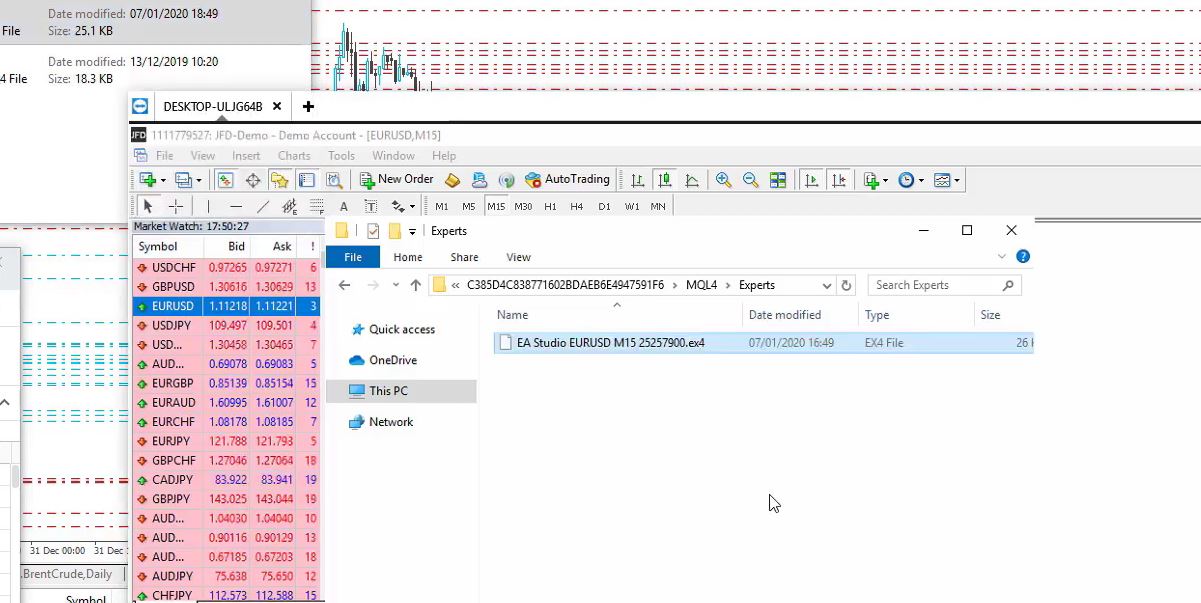
The thing we need to do is to move the Expert Advisors. File, Open Data Folder, this is the second account on my other computer, MQL4, Experts, as I showed before. This is where I want to paste those Expert Advisors. The 10 Expert Advisors, and here they are. So I will paste it right over here.
Paste it in the Experts folder of the 2nd account
And then I go to the second Magic Number.
I copy it, and I paste it in the search bar and search for it. After I find it, I copy it, and I paste it on the other computer. So this is what you should do for each strategy.
Risk diversification: the idea when trading many algorithmic trading strategies
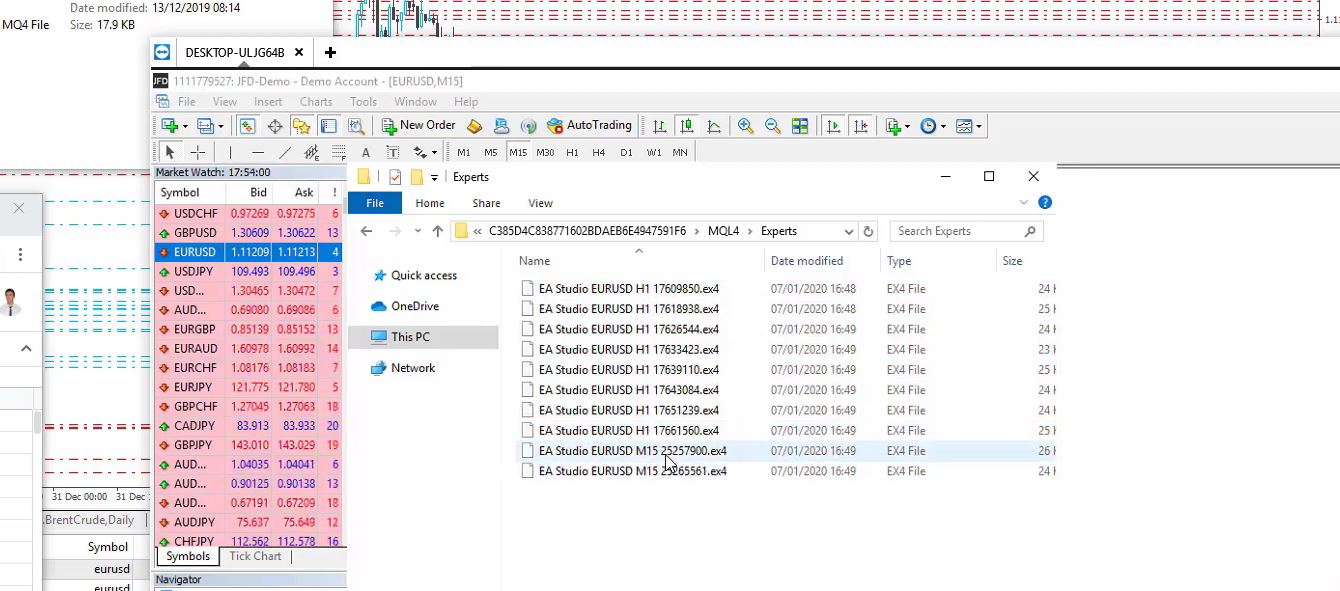
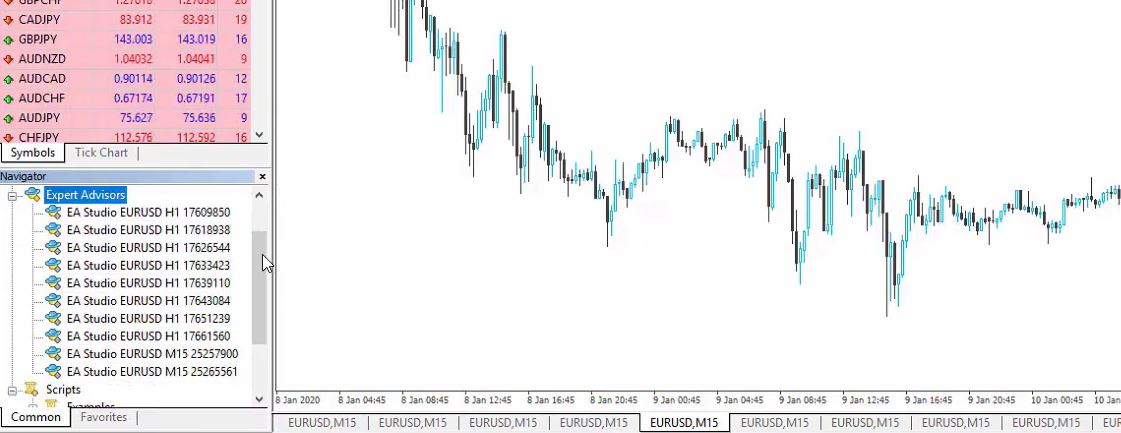
So now I have the 10 Expert Advisors on my other platform, and what you can notice is that 8 of them are on H1, and 2 of them are on M15.
The 10 Expert Advisors on the 2nd account
And this doesn’t mean that the M15 algorithmic trading strategies are not profitable or the H1 are better strategies. It’s just that for this time that I am testing, I have more H1 strategies that perform better.
I still have minimal statistics to say which algorithmic trading strategies will be better overall. The thing is that we want to combine H1 and M15 to have better risk diversification. Different strategies on different timeframes.
I used spreadsheets, but you can use anything like Notepad, Word, it doesn’t matter. Or you can even write the Expert Advisors on a piece of paper if you want, it’s just that copy-paste works fast and easy.
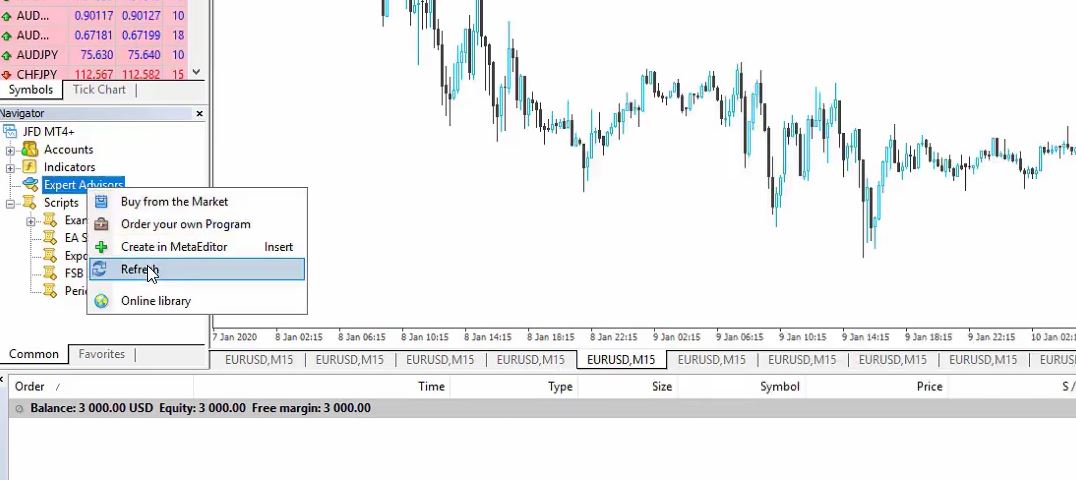
I will close the tab with the Expert Advisors in the first platform, and I will go now to the other platform. I will go to Expert Advisors, right-click, Refresh,
Right-click on Expert Advisors and click Refresh
and I will see them right over here.
The Expert Advisors are displayed.
Now, the thing is that we have 8 out of the ten on H1, so that I will make the first ten charts on H1. Make sure you are trading on the right timeframe and not mixing it up.
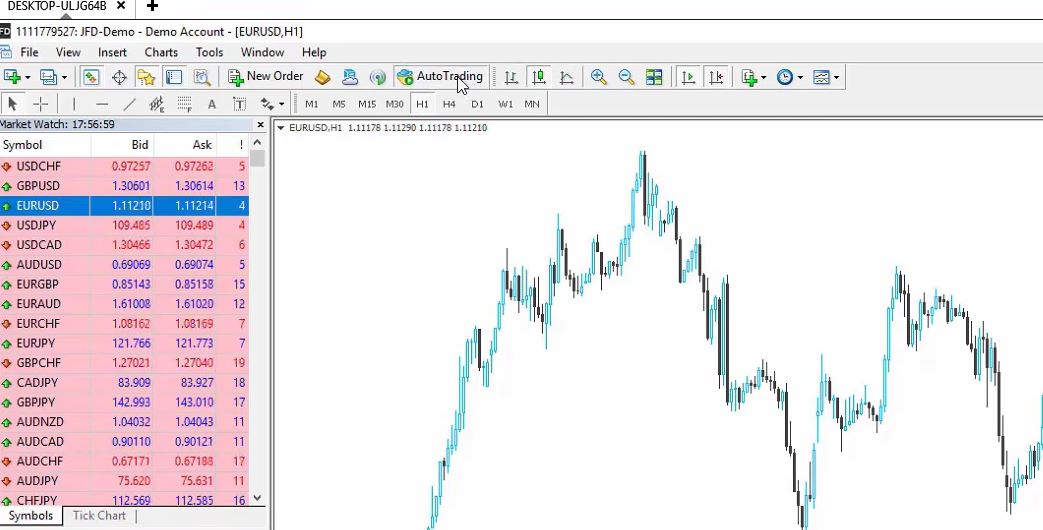
Enable AutoTrading
The M15 strategies should be trading on M15, and the ones for H1 should be trading on H1. Now, I will start with the first Expert Advisor. As you already know, we need to enable AutoTrading.
Enable AutoTrading
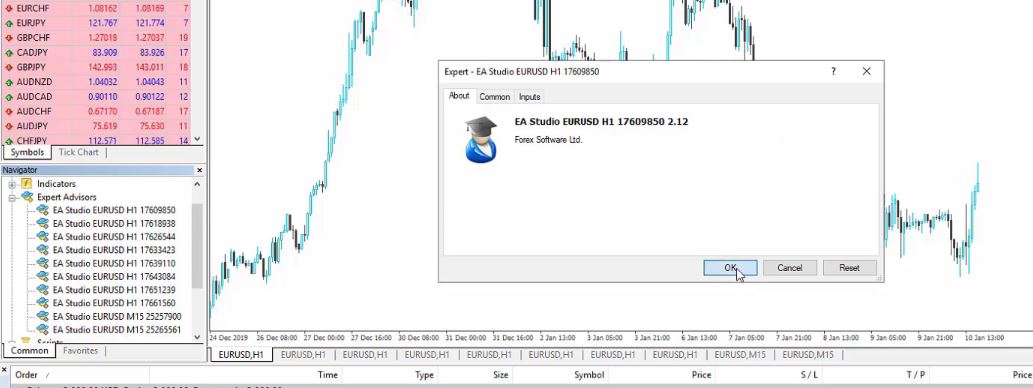
I will double-click on the first one, click on OK, and it’s attached over the chart.
I double-click on the first one and click OK.
The second one, click on, OK.
And I will place these algorithmic trading strategies on the 10 charts. So this is how I do it; it’s nothing complicated. You need to get used to the process. Test the 50 Expert Advisors in one account, open a second account, place there the top 10 Expert Advisors. And, of course, you can place the top 3 if you want, or just the best Expert Advisor.
For example, I have one of the Experts that made a significant profit. This one over here.
Expert Advisor with a high profit
But the idea is not to trade one Expert. The idea is to trade many. In the statistics, some strategies are profiting, and there are algorithmic trading strategies that are losing at the current moment, which is normal.
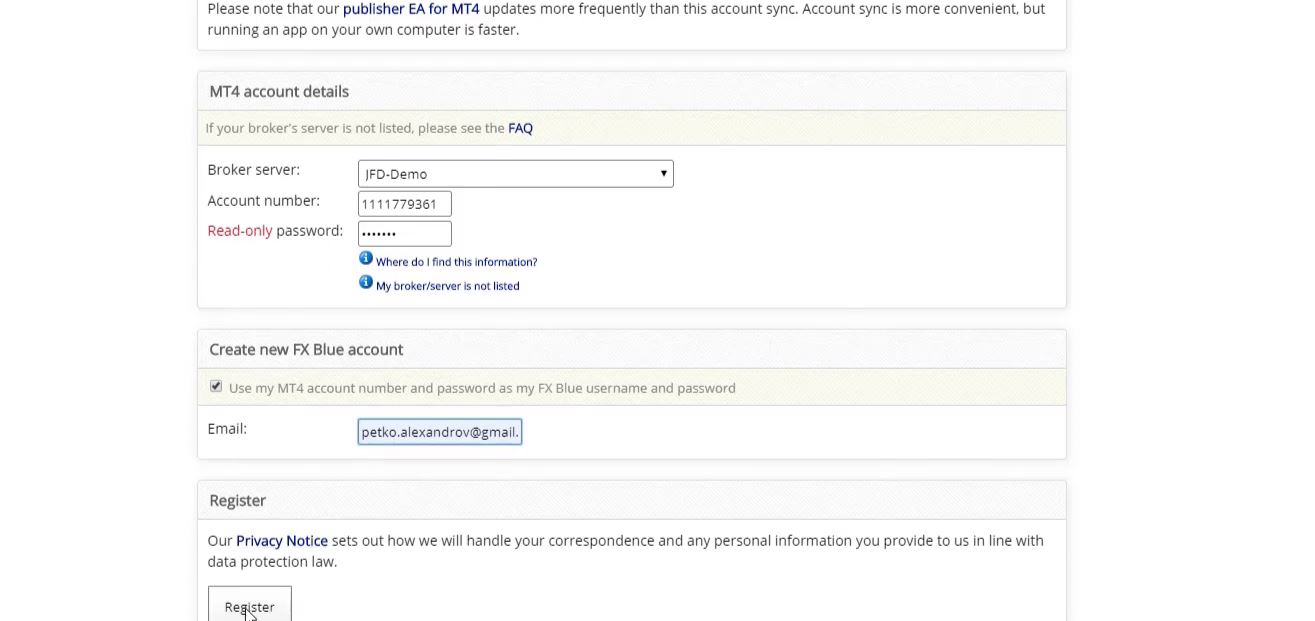
Connect your account with FX Blue after placing the Expert Advisors
Overall, the account is on profit, but I want to lower the risk, and I want to trade only the profitable strategies at the current moment, and I want to trade them in a separate account. Of course, I will continue monitoring them.
I don’t do it like every day. Usually, I do it over the weekend and on Wednesday. I check it two times a week. I see which are the top 10. If I have to change any of the strategies, I change them, and this way, I keep trading the senior Expert Advisors.
So after you place the Expert Advisors in one account, connect it with FX Blue. After you open a second Demo account and you place there the top algorithmic trading strategies, you will have work just 2 times a week. If you want, you can do it 3 times. Don’t make it every day; give it some time. Give some time to the Experts to open and close trades.
The best thing is that we don’t stay in front of the computer to trade with the strategies, they open and close the trades even if you are outside doing anything else. Also when I record lectures, the Expert Advisors keep trading. This is precisely what I find great about trading with Expert Advisors, and this is why I share it in my courses.
So make sure you follow the steps exactly from the course. You will need to open two accounts, one for testing the 50 Expert Advisors and another one to place the top Expert Advisors.
This is how I manage the two accounts. This is how I follow the results, and this is how I separate the top Expert Advisors into another account. It is essential to practice on a Demo account.
You will not be losing any real money while you are practicing, and while you are testing these algorithmic trading strategies. If you have any questions about the process, you can have a look at the Top 10 EURUSD EAs course from where you can download the ready Robots.
Stochastic trading strategy is what I will teach you today!
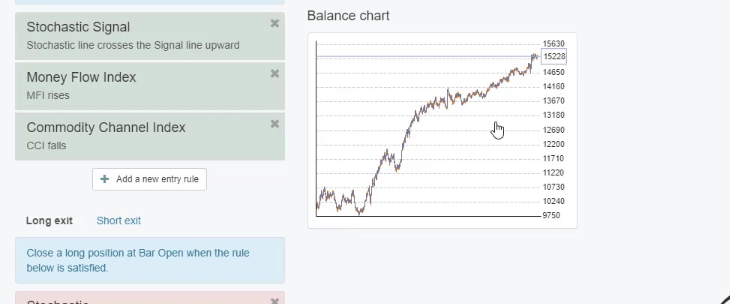
Hello traders, today I will share with you a stochastic trading strategy that I generated recently for one of my courses, The Automated Forex Trading course + 99 Expert Advisors. And I was very impressed by the results that EA Studio showed me. This is because you can see what a stable balance chart I have with small drawdowns.
The balance chart
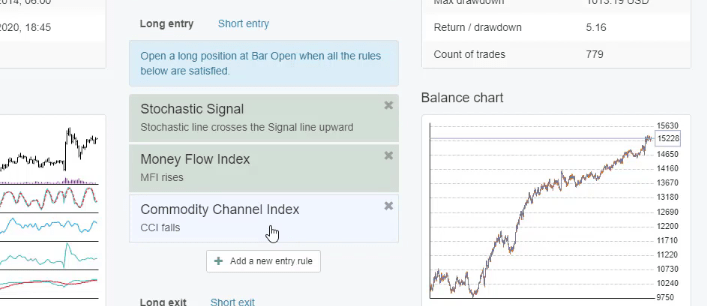
We will have a look at the statistics of this stochastic trading strategy later on. But you can see that this is not just a stochastic strategy. It’s much more because it combines the Money Flow Index and the Commodity Channel Index or as everyone knows it, the CCI indicator.
It combines the Money Flow Index & the CCI
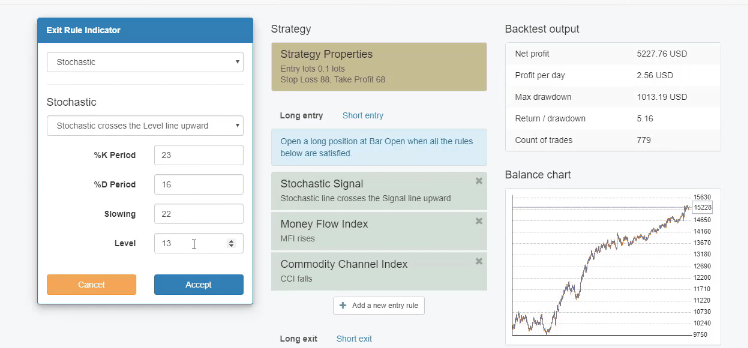
So these 3 indicators combined give the entry rule. All of them should confirm the trade before this strategy opens the trade. And we have as well the stochastic as an exit condition, we have a Stop Loss and a Take Profit with this stochastic trading strategy to protect the capital and to ensure better results.
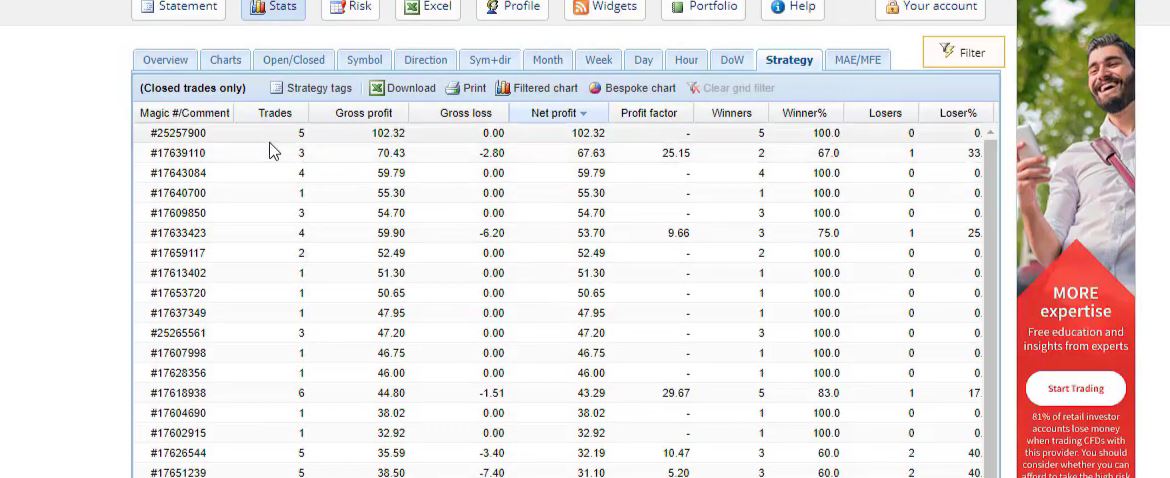
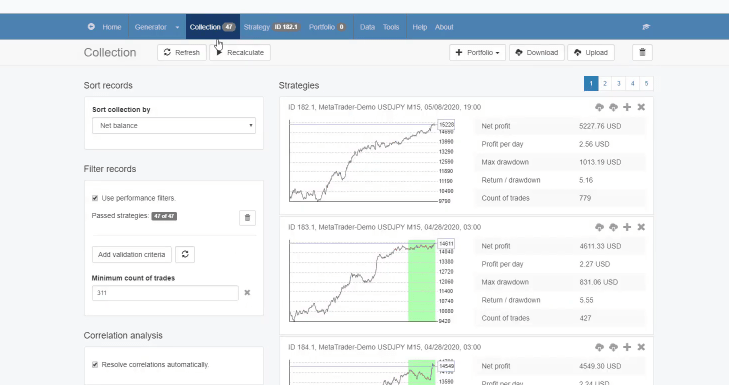
So this trading strategy is for the USDJPY. And for the recent update of the course, I have generated 47 strategies. I have used the Out of Sample tool in EA Studio as you can see in the strategies below. There is the In Sample part and the Out of Sample part which is marked in green.
Collection
Give the Stochastic trading strategy some time
For the beginner traders, the Out of Sample allows us to test the strategy on unknown historical data. This means that I have used 80% of the historical data to generate the strategies. As for the rest 20%, I have tested the strategies.
It is also possible now to filter the strategies that are in the Out of Sample part so I see as a result only the strategies that are profitable during the Out of Sample part. So is this stochastic trading strategy that combines the Money Flow Index and the CCI.
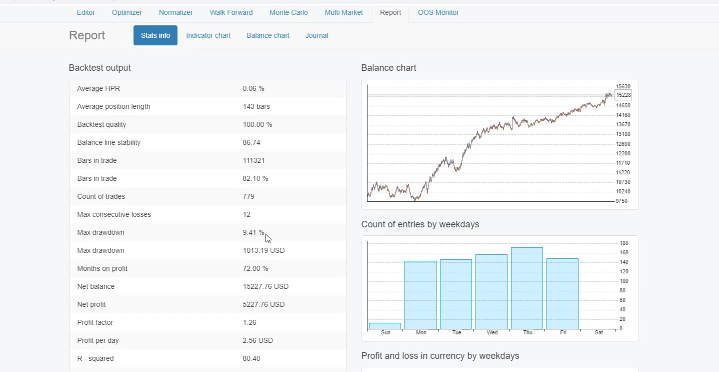
The statistics of this stochastic trading strategy are very promising because we see a maximum drawdown of 9.41% which is great.
The statistics
My minimum is 20% and this is double less which is great for such a long period of time. I have been testing this strategy since 2014 and in numbers, this is $1,013 of a drawdown.
Many of the beginner traders that test the strategies from our courses say that there are some losses during the first week or during the first month. You need just to give it a little bit of time because as shown on the balance chart, there are periods when the strategy is losing.
Practice the Stochastic trading strategy on a Demo account
It is very normal, not just for this stochastic trading strategy but for any other strategies. Either on the Forex market, on the stock market, or the cryptocurrency market. The market changes every day.
We cannot expect to have strategies that are profitable every single day. This is why we test these strategies on a virtual account, Demo account, and we see which ones are profitable at the current moment to use in our live accounts.
More statistics from the stochastic trading strategy is Profit factor of 1.26. The Profit factor is the gross profits divided by the gross losses. As well, the return to drawdown ratio is 5.16, maximum consecutive losses is 12, and we have count of trades as 779. This means that for the whole period, this stochastic trading strategy executed 779 count of trades.
And the more count of trades we have, the more robust the strategy. We don’t depend our trading on a strategy that opened just a couple of trades. First, it’s not an active strategy, and second, the statistic is not reliable because it opened just a couple of trades.
The difference between stochastic & stochastic signal
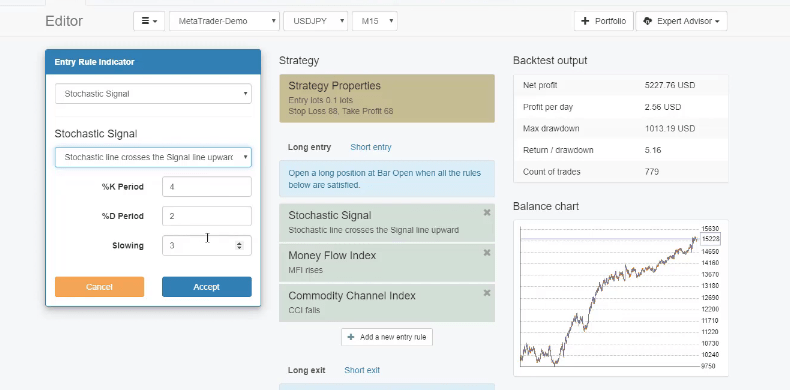
But 779 is a good number so I can rely on this stochastic trading strategy. Now, let’s have a look at the details, the Stochastic Signal uses the rule – Stochastic line crosses the signal line upward. And we have K Period of 4, D Period of 2, and Slowing is 3.
Stochastic signal
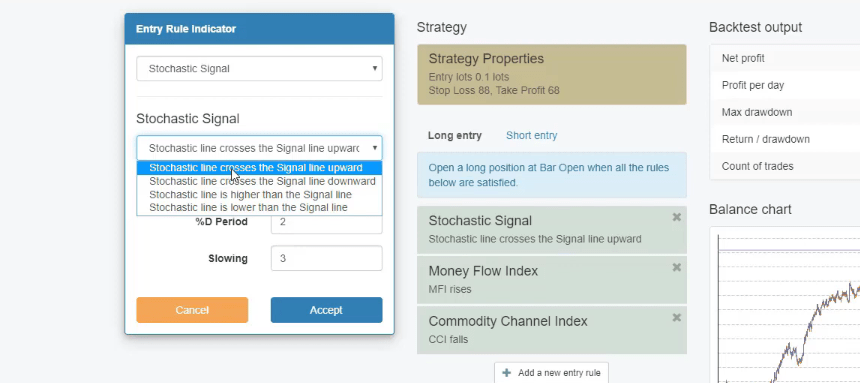
And you can notice that the exit rule is just stochastic and the entry rule is stochastic signal. What is the difference? The difference is that the stochastic signal uses signals that involve the signal line in the indicator.
You can see what are the 4 rules that are available – Stochastic line crosses the signal line upward, Stochastic line crosses the signal line downward, Stochastic line is higher than the signal line, and Stochastic line is lower than the signal line.
Stochastic signal rules
So all of these signals involve the signal line.
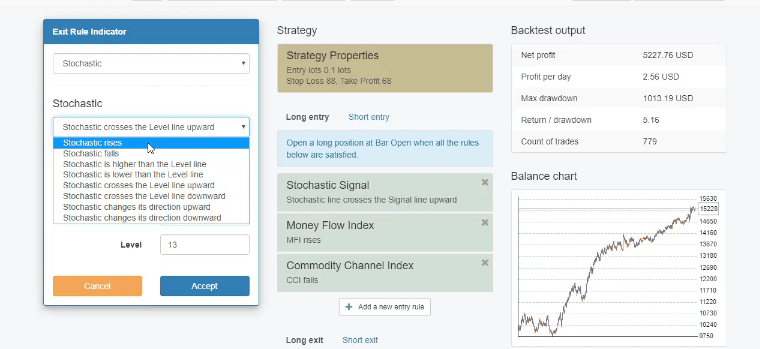
While in the stochastic exit rule, we have the following rules – Stochastic rises, Stochastic falls, Stochastic is higher than the level line, Stochastic is lower than the level line, Stochastic crosses the level line upwards, Stochastic crosses the level line downward, Stochastic changes its direction upward, Stochastic changes its direction downward.
Stochastic rules
The Money Flow Index
You can notice that all of these entry rules for the Stochastic trading strategy involve the stochastic itself, the level lines, and the direction, but not the signal.
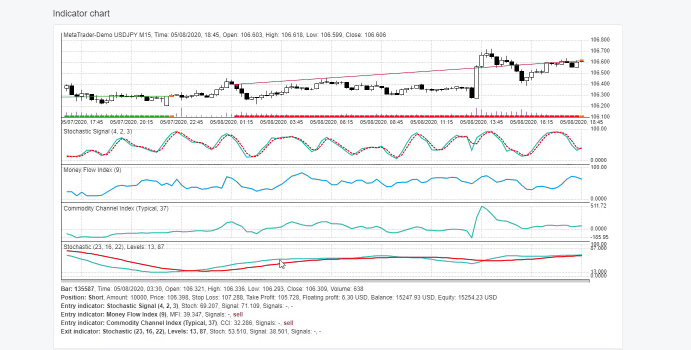
And for the beginner traders, if I click on the chart, you can see below that for the stochastic indicator, we have the stochastic line and we have the signal line.
The indicator chart
So this is why in EA Studio, sometimes you will see the stochastic signal as an entry or exit rule. And sometimes you will see just the stochastic indicator which, one more time, is the same indicator. They just use different entry and exit conditions.
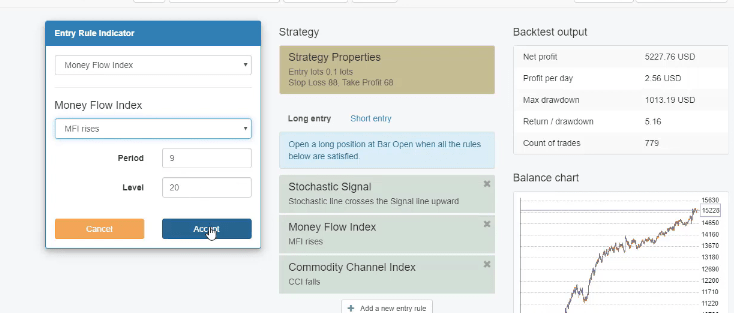
Now, the Money Flow Index uses the rule – Money Flow Index rises which confirms the direction of the stochastic signal, we have Period of 9 and Level of 20.
Money Flow Index
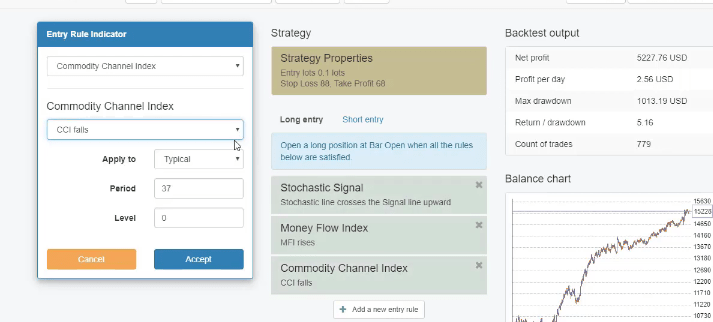
And we have the Commodity Channel Index or the CCI with the entry condition to fall, period of 37.
The CCI
And as an exit rule, we have – Stochastic crosses the level line upward, K Period of 23, D Period of 16, Slowing is 22, and Level of 13.
Stochastic
What more do we have with this stochastic trading strategy? A Stop Loss of 88 and Take Profit of 68.
Usually I round the numbers
What I usually do with the Stop Loss and Take Profit is to round the numbers if they don’t have a huge impact on the performance. Even this strategy improved a little bit. And then I increase the Take Profit to 70 and the balance chart improves even more.
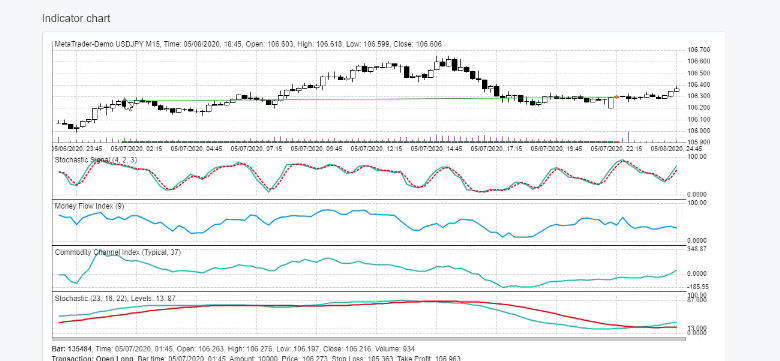
Now, if I click on the indicator chart, I will show you some example trades that were executed with the stochastic trading strategy. All of the indicators are displayed below. Let’s have a look at some long trade first and then we will have a look at a short trade.
So at this candlestick, we have a long trade which means that the strategy executed a buy position.
A long trade
This is because, in the previous bar, we have confirmation from all of the indicators. This is how this Stochastic trading strategy works.
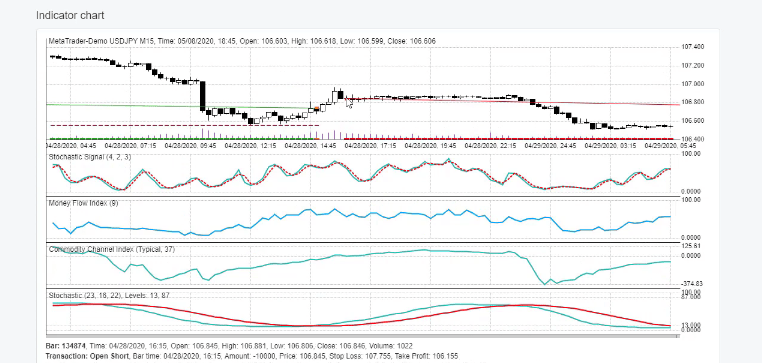
On the opening of the next bar, the trade is opened. This trade was closed due to the exit rule, the stochastic line crossed the level line upward and the trade was closed. Let’s have a look at a short trade on the 28th of April, 2020.
A short trade
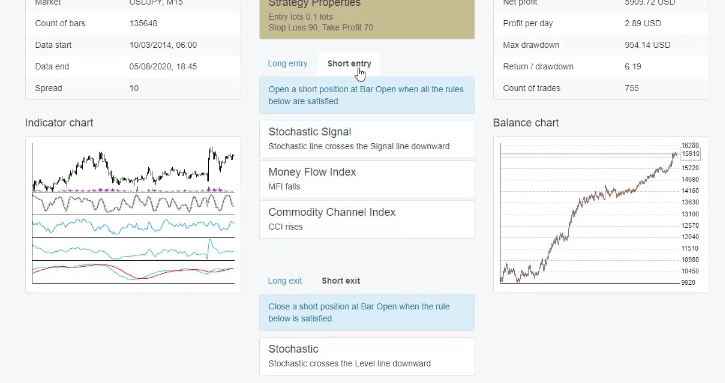
Use the short exit button and short entry button
We have a short trade because we have confirmation from the Stochastic Signal, from the Money Flow Index, and the CCI index.
And as we said, the stochastic trading strategy follows the rules – Stochastic crosses the signal line downwards. This is for sell trade which is the opposite of the buy rule.
And as we said, this strategy follows the rules that we need to see the stochastic crossing the signal line upwards for a buy which will be the opposite for a sell. So it will be stochastic crossing the signal line downwards and this is exactly what happened.
We have the confirmation from the Money Flow Index which falls. As we said, for a long trade, the Money Flow Index should be rising and here it’s falling. And the third one, the CCI indicator rises and for the buy, it should be falling.
So we have just the opposite of the rules that are in a long trade and this trade goes to positive and we have our Take Profit reached just a couple of days later.
If you have difficulties with short and long, just use the short exit button and short entry button. This will convert the indicators or it will just show what are the rules to enter short or to sell.
Short entry button & short exit button
You can register for the EA Studio free trial from our Home page
The easiest way to remember it is that we are looking for the opposite events. Trading with this strategy on the Meta Trader platform manually or algorithmically is up to you.
What I would suggest you do is to build this strategy with Expert Advisor Studio for your broker, for your historical data and just add the indicators one by one using the parameters that I have shared with you. You will see what the balance chart is with your broker.
And this is very logical to do because most of the brokers provide different quotes for the prices with a different spread. This results in different backtests.
You can test it on a Demo account. I always suggest for my students to test these strategies on a virtual account. If you like the performance, you can use it for your live trading account.
And if you haven’t used EA Studio, you can go to the Home page and register for a free trial.
Register for EA Studio free trial
You can build many similar Stochastic trading strategies with this software
During these 15 days, you can export as many Expert Advisors as you wish. You can also generate strategies or build strategies just as I show in my courses.
There is a free course on the Useful links tab. As well EA Studio is available on many different languages which might be useful to you if any of them is your native language.
Thank you very much for reading. Let me know if you find this Stochastic trading strategy useful.
Price action trading is the favorite method for many traders, but few do it right!
Today I will describe the price action trading strategy that we use successfully in the Academy. This is a free lecture, it’s not going to be part of any of our trading courses.
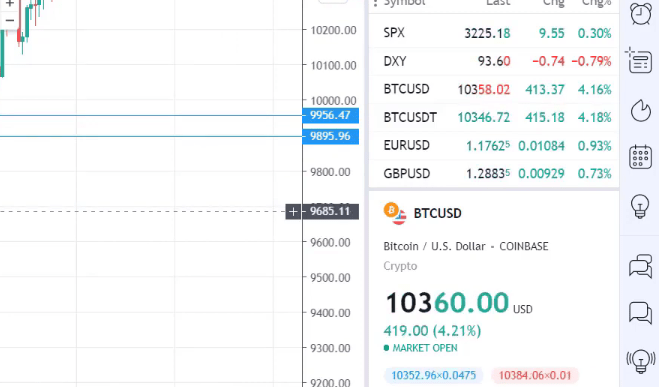
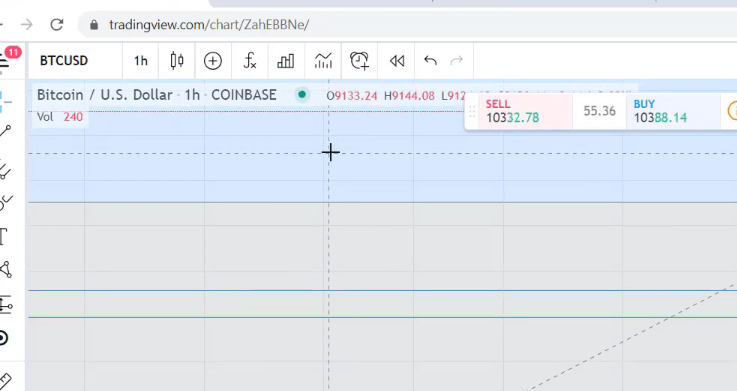
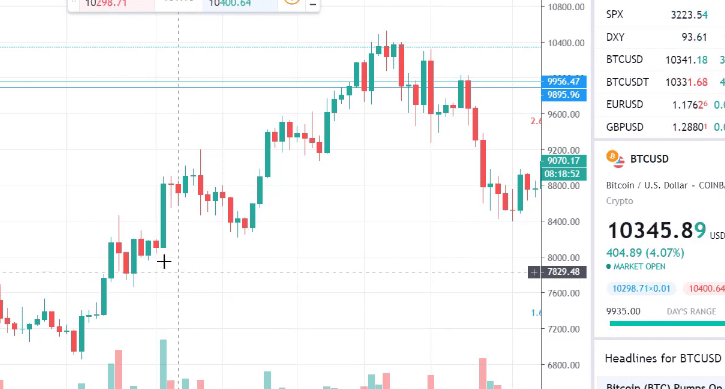
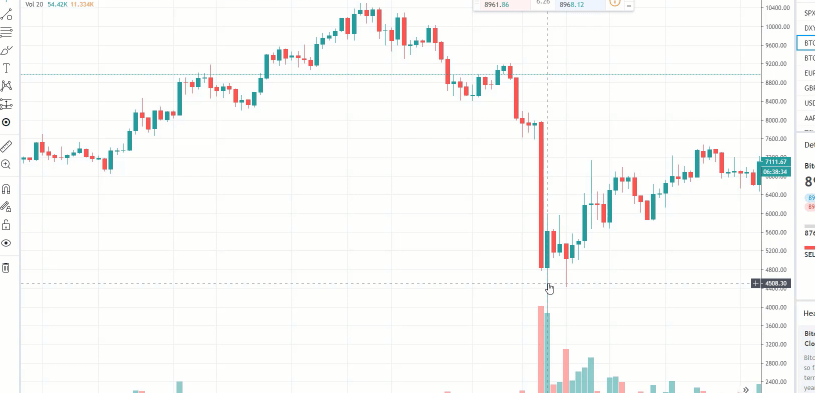
We will keep creating lectures to share with you the strategies and trading systems that we use in the Academy. Now, as a price action trader, I’m always looking for volatile assets such as Bitcoin. And yesterday I had some great profits with the Bitcoin as it passed again the $10,000, which is an important round number for the price action traders, and it is already above much higher.
The Bitcoin surpassed the $10,000 again
In this lecture, I will do a quick overview of the price action strategy that I’m using and you will be able to apply it at the end of the lecture. So all price action traders use different methods, different drawing tools, indicators, different trading platforms, different price action patterns, but what’s common for everybody is the price.
This is why it’s called price action trading because we are trading based on what the price forms. For the very beginner traders, what usually we have on the chart are the candlesticks or the bars.
The TradingView platform is suitable for price action trading strategies
The candlesticks are bars that are formed from the price. The most common outlook is the candlesticks because they give us the idea when the market was positive and when the market was negative. For example, the long red candlestick below shows that it was a negative hour for the Bitcoin.
The candlesticks
And then the positive green bar shows that it was a very positive hour for the Bitcoin. Why do I say an hour? Because one candlestick or one bar represents one hour’s time. This presentation of the price allows us to draw different lines and to use different indicators.
I will explain to you what I use for my price action trading strategy which could apply not only for the Bitcoin but for any other trading asset that you want to trade with. For example, if you are a fan of the currency pairs, you can do price action Forex trading.
Or if you are a fan of stocks, you can do stock trading as well. Anything on the market that moves could be traded with price action strategy, and, of course, we need the brokers to offer it and to provide it to have access to trade with it.
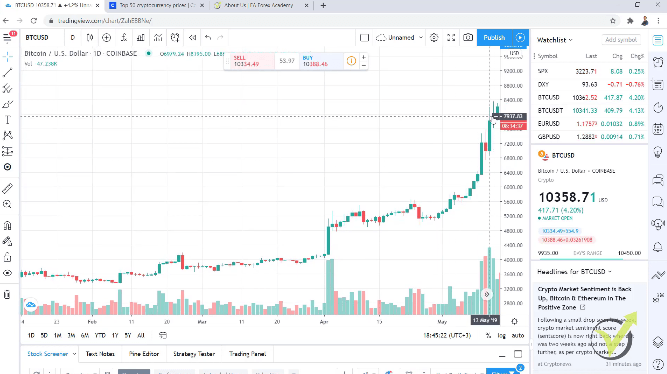
For the purpose of this lecture, I have selected to use TradingView which is a great online platform for trading so many different assets.
The TradingView platform
The trend is vital for the price action trading strategies.
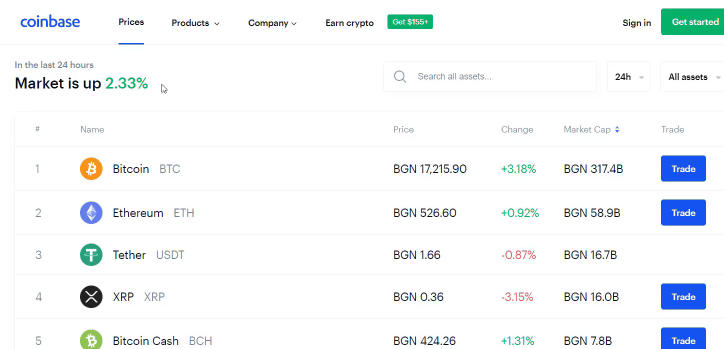
But I’m not related to the platform so don’t take it as a recommendation. I simply combine it when I do cryptocurrency trading or investing and I do the analysis over TradingViewing, in this case for Bitcoin. I have been trading in Coinbase recently, a great cryptocurrency exchange where you can trade so many different cryptocurrencies.
Coinbase platform
will start from scratch for those who don’t have any experience in trading.
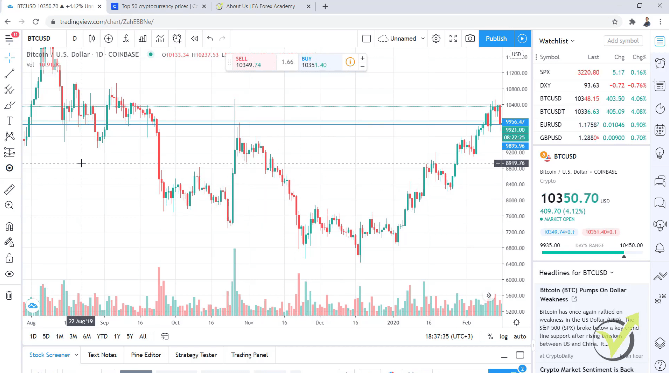
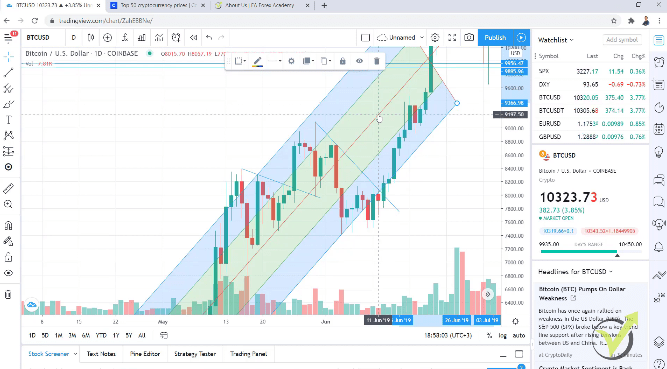
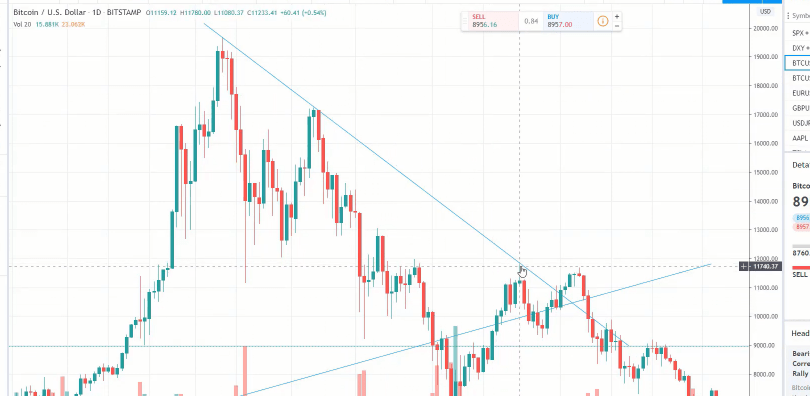
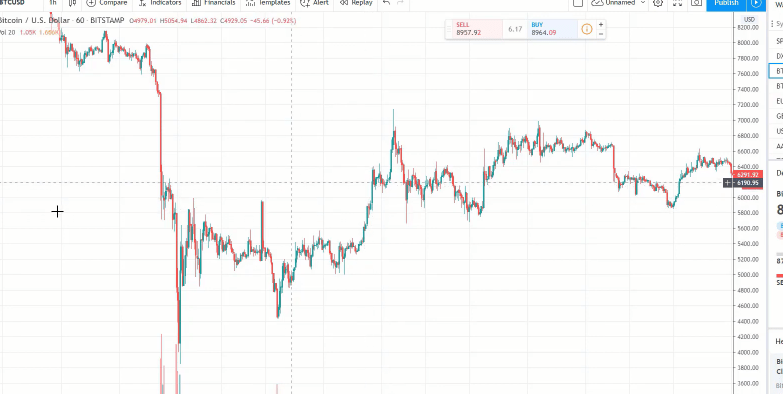
I will go to the daily chart and I will select the period between August 2019 and December 2019.
The daily chart
The first important thing about price action trading is the trend.
The price has the tendency to trend. What does it mean to trend? To go in one direction for a longer period of time. For this period the price was falling. There are some periods when the price is going up, down, up, up again, down. But overall, the price goes down.
The Price action patterns applicable to any asset of your choice
In this case, it dropped from 12,290 down to 6,500 and something. And the Bitcoin lost 2 times its value. One more time, for this price action strategy, I will stick to the Bitcoin because recently I trade it a lot and it’s very volatile.
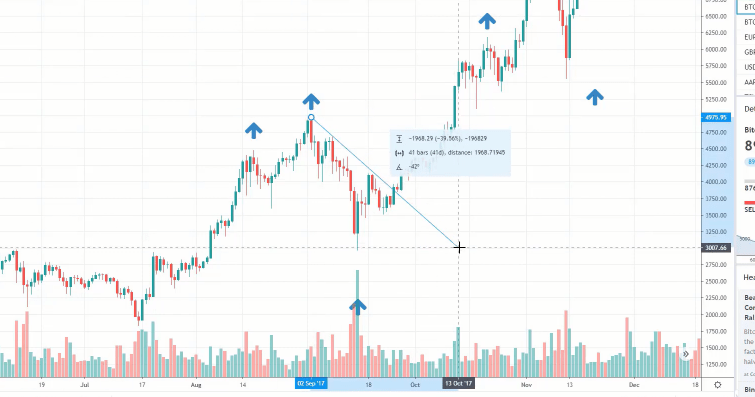
You can apply the strategy to any other trading asset, Forex, crypto, commodity, stocks, whatever you want to trade. And what is the trend? The trend is defined as a series of higher highs and higher lows.
This means that when we have consecutive lower highs and consecutive lower lows, we will have a downtrend. In this case, we have such a downtrend.
So, one more time, in price action trade we say that we are in a downtrend when we have a series of lower highs and a series of lower lows.
Example of a downtrend
The very same thing on the other side, when the price is going up, when we have a series of higher highs and a series of higher lows, this period is an uptrend.
Example of an uptrend
Most price action traders want to trade with the direction of the trend.
CFD trading is when we do Forex price action
And why is that? Because we have a higher chance to be on the profitable side. For example, if we buy, we have a higher chance to reach our targets because we are in an uptrend. Most of the people are buying at this moment. And when we are in a downtrend, it means that the people are selling.
And no matter why we sell the asset, we have a bigger chance to profit out of it because the majority of the price action traders are selling. I’m talking about profits in selling because keep in mind the following:
With the Forex brokers, we have the chance to benefit when the price drops because there we trade with CFD trading which means Contract for Difference.
Or in other words, we can sell an asset without having it previously and we can close the position at a lower price and benefit out of that.
Now, with the exchanges, and especially with the cryptocurrencies, everybody is looking for the moment when to buy because when selling it at a more expensive price, we will benefit.
Let’s go a little bit earlier after the period of 2019. I’m not going to talk about the periods of 2017-2018. This was a wild time for the Bitcoin. Everybody was buying. There were not really rules in there, it was just one direction and everything changed at the end of 2017 and the beginning of 2018.
The market gained stability
However, after 2019, we have a very normal market for the Bitcoin which allows us to apply different price action strategies and to benefit easily and without so much stress as it was in 2017 and 2018. To explain what this price action strategy is, I will start from the plain chart.
And after that, I will demonstrate to you some of my recent price action trade and I will show you some real statistics of my trading and you will see how I applied. As I have said, we are in an uptrend when we have a series of higher highs and higher lows.
It’s very obvious that we have a series of higher highs and higher lows. The price is going up. And what we are looking for is when to join the trend or in other words, when to get on the train.
What is price action trading?
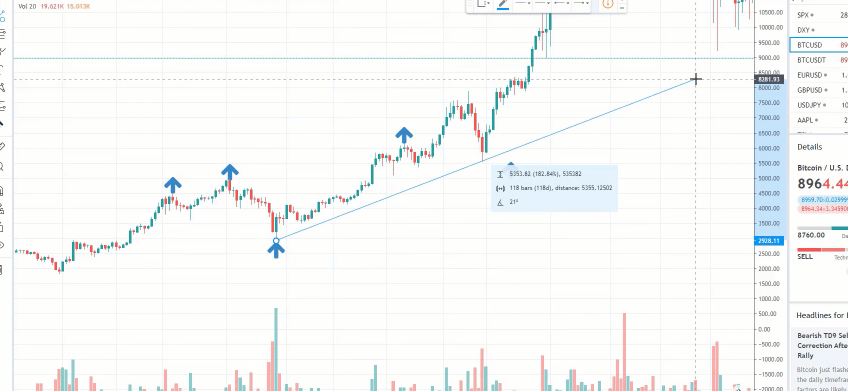
We analyze the price to find the best possible entry, and we use price action trading strategies to know when exactly to buy and when exactly to sell and to get off the train. For this period, you can see below that the price is going aggressively upwards.
The price goes aggressively higher
The mistake most beginner traders do
If you look at the market like that, it’s really risky to buy at such a moment because we never know when the move will stop.
And most of the time, this is a common mistake that the beginner price action traders do to buy at such highs and after that, the price just pulls back and they might turn into a huge loss.
For example, the price reached 8,250, and then it dropped nearly to 6,500. That’s a huge drop and most of the traders just get afraid and they want to sell. They sell because they don’t want to take bigger losses.
The smart price action traders are going to buy exactly on these pullbacks, also called retracement. This is very normal because, at this moment, the smart investors and smart traders are taking their profits. They sell and this makes the price drop.
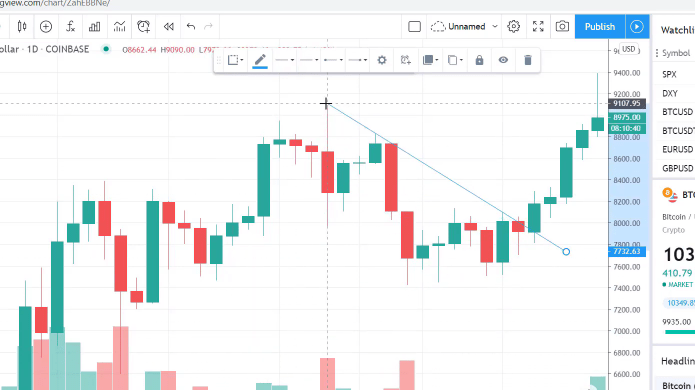
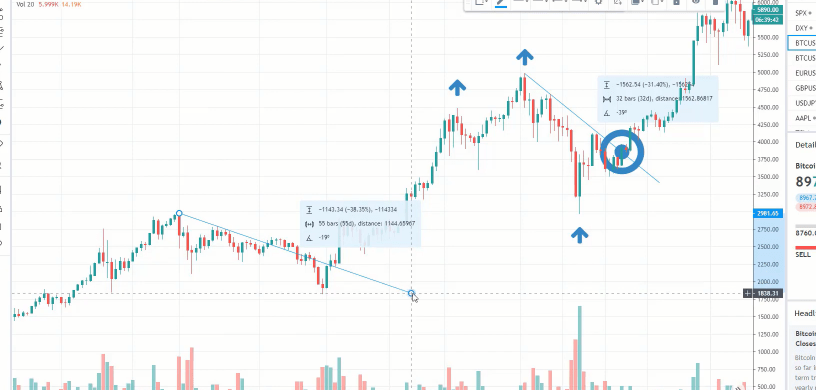
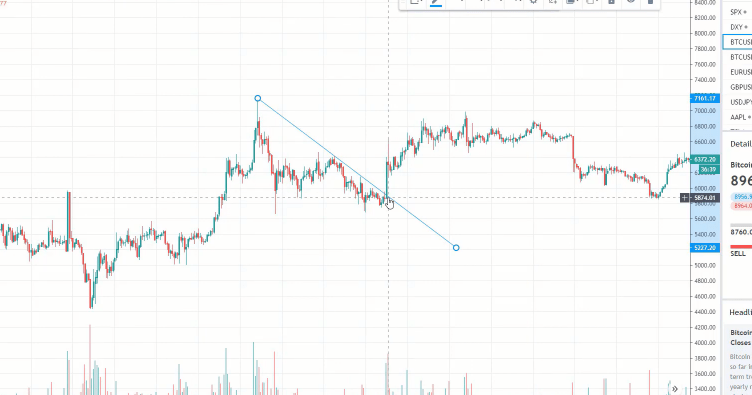
However, the majority of the people still want to buy and they push the price higher. So how can you use these pullbacks? The price action strategy that I use relies on the counter trend line. What is the counter trend line?
The counter trend line is one of the best price action patterns
It’s a line that goes against the trend. As we said, at this period of time we are in an uptrend. So the counter trend line is a line that is against the trend. It’s not with the direction of the trend but it’s against it. It’s the opposite drawing that we do with the regular trend lines.
Counter trend line
And when the price breaks this counter trend line, it’s one of the best entries I have ever used as a price action trader. I’ve been using now the counter trend line for over 10 years and it works great.
And it will continue working great for me and for many of the students that I have in the Academy because it represents the intention of the people to buy again after a normal retracement on the market. Because the price was going up, there was a retracement one time, a second time, and then a huge retracement.
And when the mass of people or the mass of the traders are ready to buy again, they buy and the price just goes up. These are the moves that we want to catch.
This is really easy to be used. No need to go for complicated price action patterns, butterflies, and all colorful charts that you see many traders doing just to make you confused and to sell you different systems and strategies that are so complicated.
Failure of the recent low is not an indicator. It is a sign of weakness.
They really cannot prove to you that they are profitable. However, in my courses, I show live examples and in the Price Action Trading Course, I show real trading from using the counter trend line.
And in my recent Cryptocurrency Investment Course, I showed every single trade that I’ve been taking during the past months and I will keep recording it.
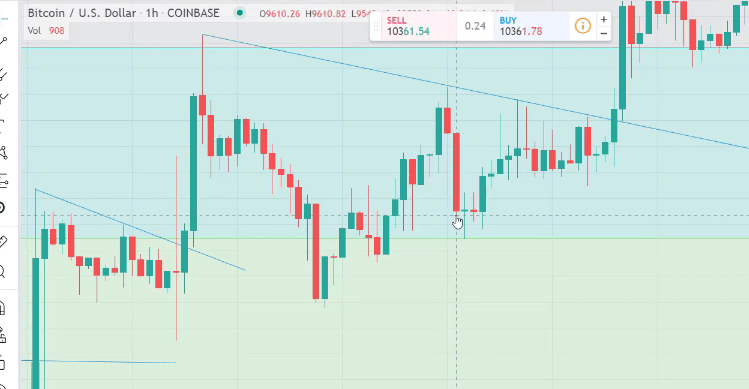
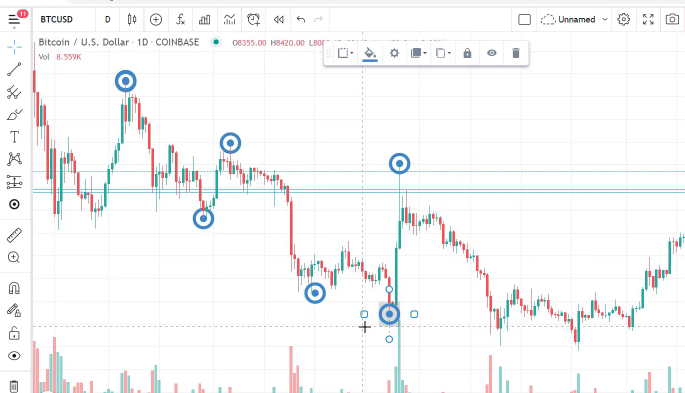
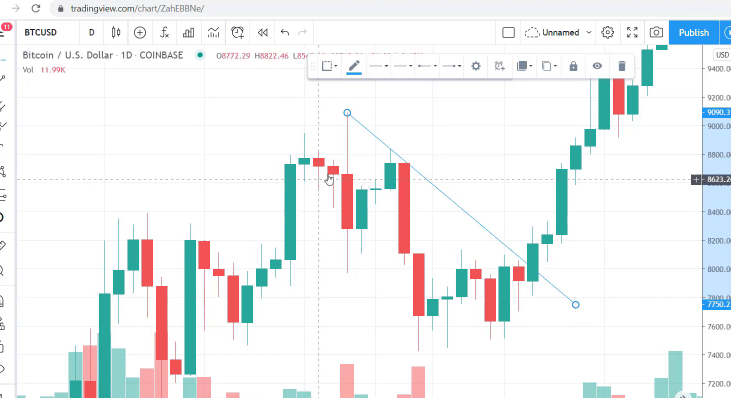
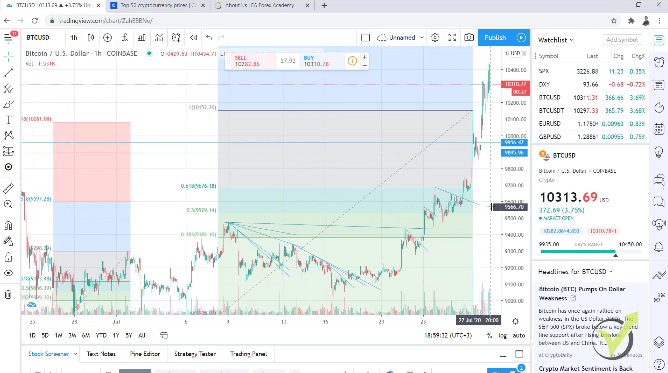
So if you want to see my live examples of how I’m trading with the counter trend line, you can have a look at these courses. But now I want to teach you how you can use it for your trading. To have a look at a more detailed chart, I will go to the hourly chart and I will explain to you how I draw it.
We have a series of higher highs and higher lows, and then we have one lower high which we call the failure of the recent low which means that at this moment, the buyers are trying to push the price higher but they fail and the price forms a lower high.
One high is lower than the other which allows me to draw the counter trend line.
Counter trend line on an hourly chart
This is exactly price action trading because I use the action in the price to do the drawings. And when the traders and the investors fail to take a certain high, the price forms a lower high, and the price drops, and I have the chance to draw a line.
You better stick to the simple price action trading strategies
Very simply, to draw a line you need 2 points. In this case, it is 2 highs. After the retracement, when the mass of people is ready to buy again, the price pushes again. And the moment it breaks the counter trend line is the moment for the entry. This is where I take the trades.
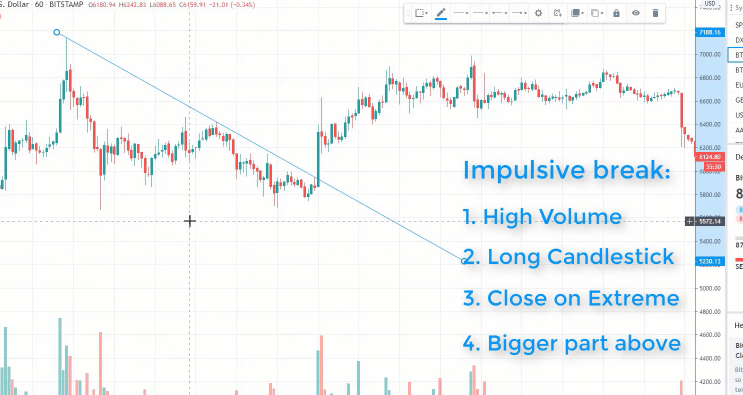
And just a little bit earlier before this example, we had another opportunity, another counter trend line. Again, we have a new high and then the price fails to take it which means that the resistance of the people who are selling is stronger than the buyers and they don’t allow the price to cover that top.
The price drops and this gives me the opportunity to draw the counter trend line. Then a very impulsive break of the counter trend line which happened just in one day and in this case, the price of the Bitcoin moved from 8,073 up to 8,732.
So the counter trend line is a really great price action trading technique that you can apply for any asset. There are plenty of different price action trading strategies but if you really stick to the simple ones, like this price action strategy that I demonstrate at the moment, you will have a better overview of the market.
The Fibonacci is a price indicator
You will see actually where the price is. Because if you draw too many price action indicators over the chart, or even sometimes it can be one price action indicator, it makes the chart very hard to read. I’m not going into details now but I will draw any indicator catching some of the moves. You will see that they are very colorful.
And if you put too many lines, you will really mess up and you will not see the price.
Avoid drawing too many lines
And when we are doing price action trading, the price is what’s most important. So I keep it very simple. Now, if I go to some of my recent examples from this year, actually from yesterday, you will see how my chart looks.
If I go to the hourly chart, you will see that I have colors just because I use the Fibonacci which is a great price action indicator and I use the Fibonacci to know where is my target.
The Fibonacci
And yesterday my target from the previous Fibonacci that I had was just reached. The price reached above 10,081 and I had my target reached which made me sell some cryptocurrencies. I have sold Chainlink, Stellar, some Ethereum because the Ethereum did a great move together with the Bitcoin.
I will show you the results of this price action trading strategy.
And usually what I do is to analyze or I do price action trading over Bitcoin but I trade the smaller cryptocurrencies because, simply, they move faster in percentages. I explained that in detail in my Cryptocurrency Investment Strategy Course.
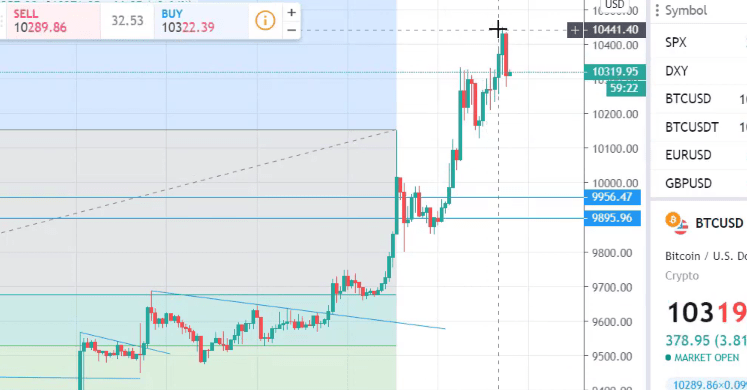
To give you an idea where my last entries were using the counter trend line, I bought the most recent one on the 25th of July, just a few days ago. The price failed to take the high and the price broke aggressively. So I bought cryptocurrency at that moment and it was a great entry.
It was below the $10,000 and when the $10,000 was broken, you can see below where the price reached today, above $10,441.
Where the price reached today
And because I know many of you are very skeptical and they want to see actual results, I will show you some results.
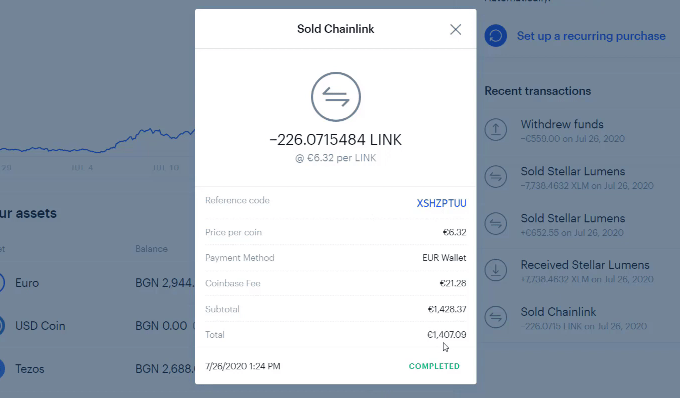
I will open my Coinbase account and you will see that yesterday, on the 26th of July, I sold Chainlink. In this case, it was about €1,407 and I sold 226 of a Chainlink which I bought at a really nice price. My total investment here was €1,000.
Withdraw your funds whenever you need
So from this single trade, I have €407 which is 40.7%.
My Chainlink results
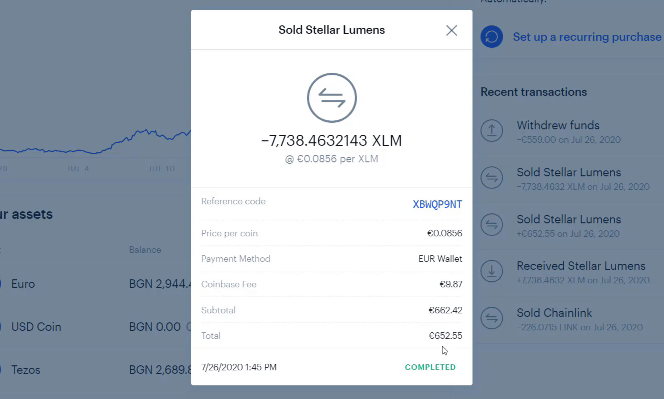
And as well, yesterday I sold Stellar. I sold €652 and my initial investment was €500, so €152 was the pure profit that I did with the Stellar.
My Stellar results
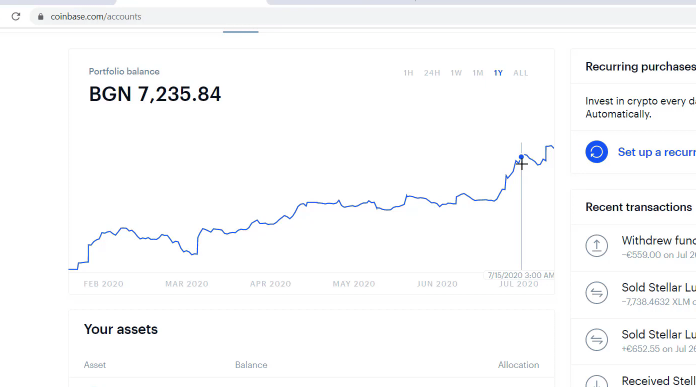
That’s my overall portfolio in one of the Coinbase accounts that I have.
It’s very stable going upwards and it’s in an uptrend which is very good for me.
It’s an uptrend
However, I achieve these stable results over time just by following a strict price action strategy and I have very strict money management which I explain again in the course.
And there’s a recent drop in the account because I simply recorded an example for the course and I wanted to show how to withdraw. So I did a withdrawal yesterday or this was just the profit from yesterday.
I did a withdrawal to my Visa card to show the beginner traders that with Coinbase, there are no issues to withdraw funds back to your Visa card or to your PayPal account. And by the way it happens instantly which is pretty cool. So whenever you need some money from your wallet you can withdraw it.
Do not involve emotions when trading
This is the price action trading strategy that I’ve used for so many years. Recently, I trade a lot of the cryptos because, as I said, since 2019 the market is just a normal market. The price goes up and down and it’s not as wild as it was in 2017-2018. You can apply different price action trading strategies.
But keep in mind that whatever strategy you select to use, you need to be very strict and you should not fall under emotions because as you know, emotions are what make people lose. For example, yesterday I took some profits after the Bitcoin reached my target of 2.618 from Fibonacci and it continued higher.
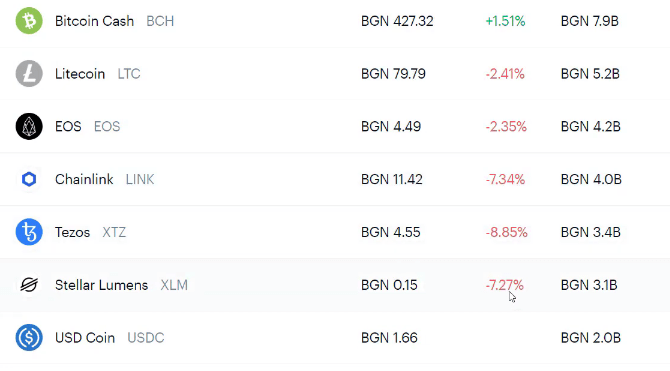
If I allow myself to fall into emotions, I will say, “Alright, let me keep these cryptos longer.” And because the price is going upwards, I want more profit but I will show you what happened with these cryptos that I sold yesterday. I will click on Prices and you will see that Chainlink is down by 7.34% and the Stellar is down by 7.27%.
For some reason, since yesterday the Bitcoin is going upwards, but the Chainlink, Tezos, and Stellar are going downwards.
The Bitcoin is going up but the others are dropping
And if I had waited longer, I would have lost my profit. So I’m very strict. This was my target. I have recorded examples for the course.
The flag is one of the popular price action patterns
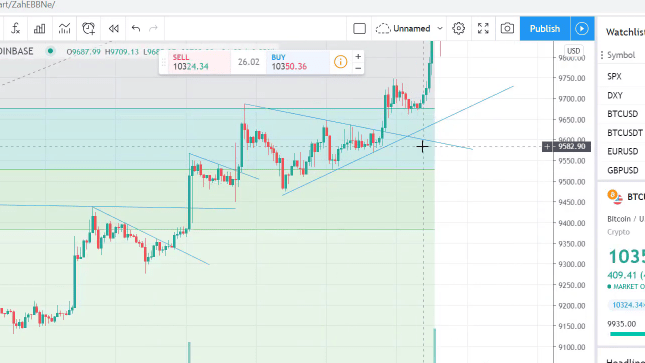
Exactly when the profit is reached, immediately I sell it and that’s it. I’m not greedy to keep it longer or to buy again right after I have sold. I wait for the next counter trend line which still didn’t show on the chart. And by the way, my last entry was a great price action pattern.
Actually it was a flag, I know that many of you are familiar with flags.
The flag
But I prefer just to draw the counter trend line, no need really to draw a flag. For the beginners, the flag is one of the price action patterns where we analyze if the price will go upwards or downwards after it breaks any of the lines of the flag.
So we have a move up, then we have a flag. If the price breaks upwards, it’s expected to continue higher. However, I would not rely on such price action patterns but I would rely on the trend. I would like to see the bigger picture and if we are in an uptrend, definitely I would like to buy.
And to see the bigger picture, you need to go on a daily chart to recognize that we are in an uptrend. So the very small flag that we have in the hourly chart is not really the thing that I am following. I want to know the big picture which is the trend and then I zoom it to the hourly chart to look for price action patterns.
Don’t hesitate to test this price action trading strategy
With this simple price action strategy that I demonstrated, I use just the counter-trend lines to enter the market. And, one more time, I show many examples in my trading courses and recently, especially in the Cryptocurrency Investment course and in the Price Action Trading Course.
Thank you very much for reading the lecture. If you have enjoyed it, I will really appreciate it if you share your experience in the comments below. If you have questions, let me know in the Forum.
Making money in stocks used to be hard, you needed a lot of money to even start and hire a brokerage but now with online, modern technology – you can start making money now. In this article, you will learn all about online stock trading and the ways you can make money from it.
This we guarantee you, over time, as you develop your skills, you grow your knowledge in stock trading and gain the discipline you need – you will achieve the success and the dream lifestyle that you’ve always wanted. And it all starts with knowing what online stock trading is.
What is Online Stock Trading
Stock trading means you are buying a piece of a company, essentially an asset, and hope to make a profit from that by selling it on the stock market which has its daily price fluctuations.
And online stock trading is simply the process where you can virtually trade anywhere in the world, as long as you have access to the Internet, you can be in the Bahamas or your own private beach.
Now, do not confuse online stock trading with stock investing. Investing in stocks is more passive while trading stocks is more active. Both types need skills and disciple but for differences between them, there are 4:
Timeline: an investor would normally hold their stocks for years while a trader will only hold for a day or a week
Market Conditions: traders will often look for spikes in the market while investors will often only make their money by dividends and compounding interests over the years
Risk: investors will only make their money per quarter or per year while a trader can make money within 7 days or less
Mindsets: an investor will often have a more mind learning the fundamentals of the company, leadership, etc – while a trader is more technical in his/her approach, analyzing geopolitical market trends, etc
Now, when it comes to the mindset of a stock trader, there are two:
Active Trader
The active trader is someone who makes a profit at the end of the month. They would normally place 15 to 20+ traders per month, using mainly timing as their strategy meaning fluctuations in the market such as corporate leadership, scandals, geopolitical policies, and more to their advantage.
Day Trader
A day trader is someone who makes a profit within the day. Imagine, buying a stock of Walmart, the price spikes up by 10% – you then sell your stocks and make a 10% profit on your investment. A day trader doesn’t care too much about corporate structure, he/she only cares about the stock value.
History of Stock Trading
As far as official records are concerned; the birthplace of “stock trading” was in France, roughly 1100s – 1150s A.D. – a prominent figure was the Venetian Bank in 1156, who acted more like a quasi coffer for the elite rather than the modern banks that we know today.
Unofficially, it was probably much earlier than that but rather than notes, bonds or securities. People used animals as debt, to barter or loan land, property, or goods.
Now, let’s be clear on what a stock market is. It is essentially a marketplace where people of all social standing can have access to goods such as gold, silver, land, and animals. Today, we call them securities, credit, futures, companies and yes, gold is still on the market.
And the idea behind a stock market or marketplace is you purchase an asset at a low price, it can be a piece of a company like Amazon which is $3,164.68 per piece, and you sell your piece when the value of Amazon goes up.
The most prominent and influential stock market in the world is the New York Stock Exchange, with a daily trading volume of 2 to 6 billion shares or ‘pieces‘ which means the money being made or traded is roughly $227 billion per day.
Wall Street Stock Exchange
Here is a quick history of the United States stock market:
1674: on Wall Street, the first script (it’s a very early version of credit) was exchanged
1929: the Great Depression destroyed the U.S. economy
1933: Banking and Securities Acts were formalized
1940: the Investment Company Act set the rules and standards for investment and mutual funds companies
2000-2001: dot.com bubble and/or the tech crash
2007-2008: U.S. financial crisis
2020: the world pandemic, drove the U.S. stock market down by as much as 20%
The average beginner stock trader makes roughly $3,000 to $4,500 per month – that’s about $150 per day in profits. The intermediate stock trader will normally make 2x to 4x in profits while the expert stock trader will make well over 5 times that. And as per the professionals, well, over 10 to 100 times the profit.
What is Penny Stock Trading
A penny stock refers to a company whose stock share value is low-priced usually around $5 or less. Almost all traded companies start out as having penny value like Amazon, whose penny stock share used to be $14. Now, they are well over $3,000 per share.
Here’s something you must consider; when you invest in a penny stock, you are not investing in it for a long time. Generally, you’re looking at daily turnovers or profits. It’s a fantastic way to grow your investment portfolio meaning your funds for further investing.
And best of all, you’re not competing with the big banks, massive hedge funds, or even billionaire traders like George Soros or Paul Tudor Jones. Most of these professionals ignore penny stock trading because they can only make millions not billions of dollars.
Penny Stock Trading can be very risky
So, I’m sorry to say, you can potentially only make millions of dollars, not billions of dollars; is a million dollars okay for you? The reason why they and you should generally avoid investing long term in penny stock trading is that many of these companies may eventually fail; meaning if they fail, your investment also fails. They disappear, your money also disappears.
It is an extremely amateur move, to invest all of your hard-earned money in a small company – only because you feel it’s going to go in value. It is best to put some of your money in X company, Y company, and so on – diversify your investment as one could grow faster than the other.
Take note that in the trading world of penny stocks, it’s quite common to see a stock meaning, a company’s value to spike upwards of 20% to 100% in a week or sometimes in a day. Imagine, your money triples in worth in a single day! Of course, it can also spike down 20% to 100%.
Stock Trading Strategies
Day Trading
A day trader is someone who makes their money during the time the market is open and before the close. Here’s an idea, imagine, you are a trader in a market that sells gold. You have sellers (companies) where you can buy cheap gold (shares). And you sell your gold to as many buyers at 2x the original price – that’s what day trading is.
The day trader is someone who very much balances their risk to reward ratio. Most day traders only invest 1% to 2% of their money, per trade as most day traders are in for the long game.
Example of 0.5% risk to reward ratio:
You have a $40,000 investment account but you only want to risk 0.5% per trade
You will only risk losing $200 max (0.5% x 40,000)
Common Day Trading Strategies
They would trade fractional shares meaning a quarter, half or third the original value – for example, 1/4 of $100 = $25 share price
Rarely or never invests in penny stocks
Has strict limit order or market order rules
Trades as soon as the market opens – NOT recommended for beginners
Has a set profit percentage per trade – for example, they’ll exit a trade once a share is valued at 10% its original value
Position Trading
A position trader is someone who invests in a company for months or years. This is essentially where wealth can truly be achieved through years of work and experience – you will have your reward.
Common Position Trading Strategies
Uses both technical and fundamental analysis to evaluate possible trends and risk in the market, does not care about short-term fluctuations in the market
Often uses a lot of levels of resistance and support. These are what you may call as from losing money or losing making money
Often they will trade on a range. Think mountain peaks. They analysis the best time to enter, hold and exit
Many other indicators such as Fibonacci retracements – they do this to balance not just the range but also their risk to reward ratio
Swing Trading
A swing trader who banks on the swing or wave of a trend. For example, you have stock on Amazon, and you know with your research that with all the new innovations and expansion Amazon is doing that it will go up.
As the trend line starts to go up, you ride that wave until you exit at a comfortable point. Now, this is important to know that a trend can take days, if not months to start and stabilize. Fundamental research is crucial to analyzing the ideal early entry point.
Common Swing Trading Strategies
There are essentially 2 types, and many more but to not intimidate you and keep it simple, we’ll pick two of the best trading strategies.
#1- Breakpoint: you’re waiting for the market to break your Resistance or Support lines, then you enter.
#2- Ride the Wave: as soon as the market stabilizes at the bottom and it starts to go up, you enter, meaning if Amazon stock stops or stabilizes at $0.50 and now is slowly going up, you enter and exit at about $1,00.
Scalping
A scalp trader is someone who relays banking on spikes or volumes of stock, meaning if Facebook, for example, has a new scandal – you can imagine the impact it will have on the company.
This is where a scalper enters. He/she makes their money in minutes, meaning you could literally make a few $100 if not $1,000 in 1 minute.
Common Scalping Strategies / The Scalper’s Mindset
Now scalping can be tricky as it’s a very emotional game. Most scalp traders trade most based on instinct and some use indicators or oscillators, Bollinger bands, stochastics, and more – again, this is to help them see.
The idea is either you as a scalp trader, go in with no indicators, just you and the market or you use indicators to help you and add some restrictions or balance to your risky behavior.
Note: please always remember that all of these strategies require very diligent research even with scalping. Regardless of whatever strategy you choose to use – never rush into a trade because of a feeling.
Best Online Stock Trading Platforms
Now, telling you which one is the best stock trading platform for you can be tricky as we are all different but to help guide you, here are 6 stock trading platforms or brokers that we recommend:
TD Ameritrade – good for beginner stock traders
E*Trade – good web platform experience
Merril Edge – good rewards program
Charles Schwab – ideal for IRA accounts
Fidelity – good research experience
TradeStation – good platform technology
What to Look for in a Stock Trading Platform / Broker:
Research the reviews on the withdrawal experience of most traders or investors – was it easy, needlessly complicated, hard, or was transaction fee too high and so on.
Based on reviews, has the stock trading platform been reliable over the years? Any scandals? How’s the corporate culture? Customer experience? Are they generally positive or negative?
Make sure the stock trading platform is user-friendly. Are they customizable? Can you change colors? Can you change the sizes of windows?
Do they offer automatic trading or is it just trading?
How’s the customer service? Are they responsive? How fast are they? Are they professional? What do the reviewers say? Do they have any awards? Why? How?
Is your data ?! Do they share your data with advertisers or just theirs? Have they had any security or data breaches? If yes, how did they respond?
Does the brokerage or stock trading platform offer educational resources, a paper trading account (demo accounts)? Do they have a comprehensive glossary?
Stock Trading Tips & Risks to Avoid
When it comes to online stock trading tips, learn the basic terms such as ‘stock market crash’, ‘stock market correction.’ Always diversify and understand the daily fluctuations of the stock market are all great.
But oftentimes, they will not work for you because please understand this – online stock trading is very much tied to your appetite or personality as a trader.
You can be a more aggressive trader who loves the thrill of risky 50% of their money or you’re more passive, conservative and you only want to risk 1% – so the solution this whole concept is to give you two main tips or processes that all traders do but first, common risks for you to avoid.
Risks to Avoid:
Avoid stocks with no volume or very low – you want to trade in stocks with some moderate amount of liquidity, volatility or movement
Again, avoid stocks with no volume – as even if you have meant your share rose 30% after a year – with little volume, who’s gonna them? And let’s not even talk about manipulative market makers or misconduct. You don’t have to be afraid of them, just.
In volatile stocks, you’re an aggressive trader. Most traders are conservative, risking only 1% to 2% of their money per trade.
Avoid Leverage or borrowing. It can sound appealing to have your money tripled by leverage but please note, that it can be very risky and not advised.
Going all-in on 1, single trade. Diversify your trades.
Not having a strict stop loss rule. Again, this is to balance your risk to reward ratio.
NEVER, ever trade because of a or you overconfident because of such and such. Be realistic about this.
Best Two Stock Trading Tips
In stock trading, there are essentially two main processes that all traders go through, quantitative and qualitative research. Most traders go 80% on quantitative and 20% on qualitative. Each process contains tens to hundreds of little tricks and tips, fitted to a trader’s personality.
Quantitative – 80%
The process of quantitative research is essentially mathematical data meaning you collect data on price points, lowest price, highest, common price action trends, a historical mathematical figure such impacts of scandals on the company, and more.
All of this is done to enable traders to determine the trading model that they will use or automate a new trading model. Most traders prefer this method as it’s more logical, it “makes sense” and “numbers don’t lie.”
The best about quantitative research is you can create an automated trading system with it – emotions are the killer of any aspiring stock trader. Imagine, a program, following all your orders with no emotions and you just observe and pivot whenever you want.
Qualitative – 20%
When you think “qualitative”, you think “quality” which means the overall quality, status, or health of the company you are researching. Everything from the motto of the company, its mission and vision, and even the leadership of the company – some traders also call qualitative as fundamentals.
This is very important to understand because if you’re only just looking at the financial statement, the fundamentals, the numbers, the company plans for next year but you’re not looking at Who the CEO is, how his/her reputation and vision for the company and how it impacts the culture of the company, checking if there are any issues within that, potential problems – here’s an example for you:
Looking at Facebook, a lot of people are a little bit wary about Facebook because of some of the things they have done in the past, remember the Cambridge Analytica scandal, and how that scandal impacted Facebook’s shares?
All of this is what Qualitative Research means, it’s all about finding Quality if this product i.e. the company as a whole truly does have a value worth investing or in simpler terms, you are dating the company to see if they are a fit for your portfolio.
Your Step-by-Step Beginner’s Guide to Online Stock Trading
Step 1: Mastering The Basics
Terms such as ‘bearish market’ and ‘bullish market’ are some of the many basic terms you must master. Aside from the many articles we have available here on EAForexAcademy.com – we recommend you watch YouTube videos.
YouTube has so many different free videos from real traders who willingly share their knowledge and experience with you; from the basics of stocks, the stock market, range trading, daily fluctuations, market manipulations, and more.
There are even books on stock trading, here are 3 of our recommended books on stock trading:
The Little Book of Common Sense Investing by Jack Bogle
The Intelligent Investor by Benjamin Graham
Trading for Dummies
The best way is to enroll in one of our Stock Trading courses which teaches you everything you will need to know to start trading and making money in trading stocks.
Step 2: Pick a Broker or Platform You’re Comfortable With
Use the steps we outline on what to look for in a stock trading platform or broker. The more you know about them, the more you will feel comfortable. Just remember, the more the stock trading platform can accommodate to your personality, the better chances of you making money.
Step 3: Open an Account
Once you’ve done your research, simply open an account with them. Please that some stock trading platforms require a deposit before you can register with them so note that in your research if you are comfortable with a platform that does that to you.
Step 4: Paper Trading Account
A paper trading account is a demo account meaning you have access to a virtual trading account with virtual money – this is where you practice everything and most of all, you get to know your personality.
Be as experimental as you can, make mistakes, make wins, use all the different strategies that you can. Remember “practice makes perfect.”
Step 5: Go Live
Once you’ve gained experience, familiarize yourself with the daily stock fluctuations – buy your first share. And remember this, your whole emotional state will shift, it’s not a bad thing – just means, you’re in now. You are a stock trader.
Conclusion
Stock trading has been the key method a lot of ordinary, average people like yourself used to get rich and live the lifestyle that they’ve always dreamt about.
Here at EA Forex Academy, this is our mission; to help youachieve your dreams. We write these articles to share with you our thoughts and experiences that you may see that it is possible that you make money online and escape that office life.
It is extremely crucial that you know the basics and terms of stock trading. The last thing you ever want to experience is to lose money. We don’t want you to lose money, we want you to make money. Research, study, and take notes on all the basics and terminologies.
For you, the next step is to watch our free videos on lessons about online stock trading. Just register here in our Academy and when you’re ready; you can join the thousands of successful students enrolled in our courses.
Just like you, they started out as beginners, not knowing the fluctuations of the market and the strategies to use in those times. Now, with our courses, we teach and guide you on everything you need to know about the stock market, trading and actually making money.
Trading Academy: What you can expect from us this year?
Hello everyone, in this post we will talk about the improvements that you can expect from us at Trading Academy.
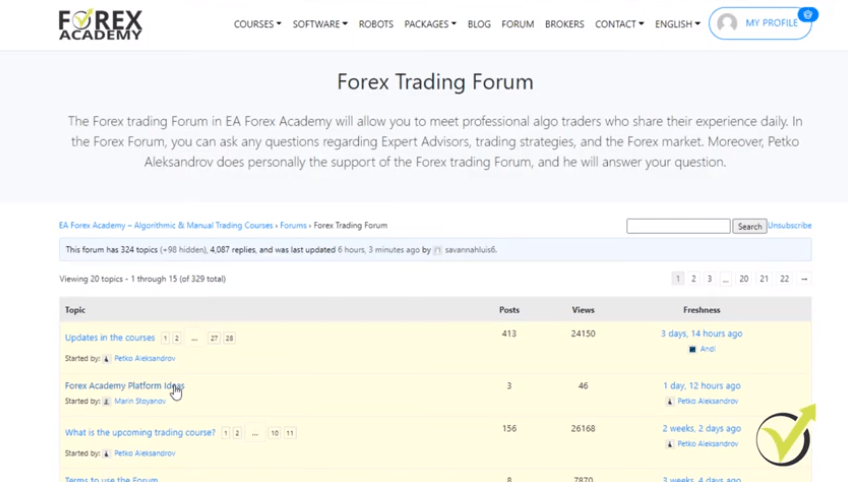
We have opened a topic in our forum where you can share your ideas and give us any suggestions you have.
Forex Academy Platform Ideas topic
We will consider them and if we find them useful for everyone, we will make sure to implement them. The topic was created because we want our Trading Academy to meet the expectations of our traders.
The main idea behind this topic is for our students to be able to write their recommendations. Not only in terms of website improvement, but also in terms of their profile improvement.
We would like to hear their feedback, what they would like to see in the Trading Academy. Because this way, the process will be two-sided and we will make the best product for you. Of course, there will be some discussion. First of all, on the topic you can discuss together with other students what you want to see in the Academy.
Then we will decide internally with the team if the improvement would be beneficial for most of our users. If so, we will definitely add this. Feel free to write in the forum topic. We will check everything and we will tell you once we decide what to add to the website.
We now have a Robots page in the Trading Academy
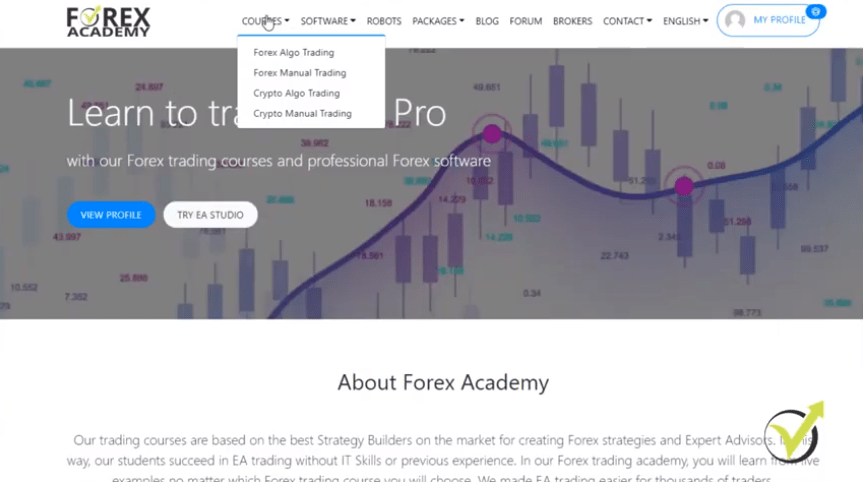
What we have done recently is to separate the courses in 4 different categories.
So basically, they are the same but in different configurations based on what we heard from the students. And now they are much more useful for everyone. As well, we have a separate page with the Robots, something that we were asked for a long time.
Many people want to have just Expert Advisors without courses and lectures. And we did it. We have a Robots page.
The Robots page
These are the Robots from the trading courses which we update every month. So every month you will be getting new Expert Advisors.
Also, we have the option of installments. If you want to take advantage of it, let us know via email and we will send you the subscription button. We use PayPal, which is the most trusted way. And the installments are with 0% interest rates.
We intend to have a complete website redesign
Simply, after the coronavirus crisis, we wanted to make it more affordable for everyone. And one thing to mention here, if you are from the European Union, consider adding the VAT.
One of the major things for this year is that we have planned a complete website redesign. We are preparing a huge redesign of our Trading Academy platform.
The platform was launched back in 2017. We have made several updates since then but they were just minor updates. This will be the biggest one and the most important. One of the features that we are going to have is that our students will be able to write reviews of all the courses.
This way you can see a review from other students and decide if a course will fit your needs. Also, you’ll be able to automatically download a certificate of completion for every course. This might be very useful if you apply for a job, you can attach the certificate to your CV.
The Trading Academy wants to protect our beginner traders from scam brokers
Also, we will make it easier for our students to watch the videos and to complete the courses. The interface will be much more user-friendly. But again, feel free to write your suggestion if you have something in mind. We are in the middle of this process so everything can be implemented.
In terms of content, we are going to prepare more articles for beginner traders. Our students want to get familiar with the basics of Forex education and that’s why we decided to write more articles about beginner traders.
Articles for beginner traders
Also, we have a Brokers page now where we have listed 3 trusted brokers that we have been using during the years.
The Brokers page
Please, don’t take these as suggestions because we don’t recommend those brokers. We want simply to protect the beginner traders from the scam brokers.
If you have any suggestions about other brokers that you have tested, that are reliable, and most importantly that are regulated, drop them in the comments below. It will be useful for beginners. And as well, we are going to do some articles and reviews about alternative trading platforms.
Feel free to write your suggestion regarding a new course from Trading Academy
Not just Meta Trader but anything else you can use to do manual trading, algorithmic trading, and to do it without any issues.
One of the important things that we’re going to launch this year is getting started guides for EA Studio.
We receive a lot of questions in the forum about different tools in EA Studio so we decided to make a complete FAQ section. There will be guides for the EA Studio and the Forex Strategy Builder Professional. But before the end of this year, we are going to launch the Expert Advisor Studio guides which are almost ready.
So we are expecting to launch the new section in the next month. As well, during the next month, we will work on the new Forex Strategy Builder course which will be a free course. We will cover all the questions we have received.
As well, we have a new topic in the forum which you can write and use to give any suggestions about what you want to see in the new course and we will make sure to include it and make it clear for everyone. Last but not least, I’d like to mention about one improvement that I really like and want to see in the Trading Academy.
Trading Academy will be more simple to be used.
There will be the option to login or to sign up with a social media profile. This will make login much easier. We receive questions about forgot my password regularly and we decided that it will be easier for our students and for the new users to use already existing social media platforms that they have invested time to create their profiles.
So you’ll be able to log in with, for example, Facebook, Google, and other social media profiles. As well, our courses from the Trading Academy will be available in the future on other financial websites. We have already many partners who want to offer our courses.
Our courses
But we want to assure you that these will be the very same courses. So it doesn’t matter if you will be taking them from our website or from any other websites, we will update them wherever they are.
Thank you very much for reading. We hope the blog post was useful and if you have any ideas for us, let us know, and we will make them true!
Learning the best Forex indicators is an excellent way for almost anyone to start with Forex trading and make some extra money. However, it only works if the trader has the knowledge required to consistently make beneficial trades. That is why education and knowledge are considered power in the Forex trading world.
There are two main things a trader needs to have knowledge of (besides how to actually make the trades/use a platform). The first is how the market works and the second is Forex trading indicators. Knowledge of these two things together is what helps a person make trades that result in substantial gain rather than loss.
Below you will find a breakdown of the best Forex indicators that every trader should know in 2021.
Forex traders, especially beginner traders, tend to try and learn a bunch of different Forex indicators and then use them all to develop their own trading strategies. When it is that complex, it is much easier to make a mistake and can be overwhelming.
For this reason, it can actually be better to learn a handful of the best Forex indicators and use your favorite to develop a strategy for your trading. If you use multiple Forex trading indicators, you should use different types of Forex indicators, or they will not be nearly as beneficial.
However, you do not have to use a large variety of Forex indicators in order to make a good prediction; some people even use as little as one Forex trading indicator.
But what is a Forex trading indicator?
A Forex trading indicator is a certain change or pattern a Forex trader looks for in the market to predict future shifts and changes.
They can use these predictions to decide the best time to make trades in either direction. The more indicators they are using, the more accurate they can get if they make their calculations correctly, but any error can result in series of trading losses.
An indicator is calculated within a certain time frame, so choosing a time frame is the first step. A Forex trader can look at a weekly, daily, hourly, or even smaller frequency for a specified period of time. By looking at specific data, such as moving averages, a trader can use their knowledge of market patterns to make predictions.
Trend Forex Indicators
Financial markets tend to operate along with certain patterns or trends. Following these trends can be extremely helpful as trading with the trend often lowers the amount of risk you are facing.
Additionally, trend indicators tend to be one of the easiest indicators to track as they are based on long-term moving averages and do not require constant calculation.
It is a great idea for every Forex trader to have at least one trend indicator in their toolbox. Below you will find a breakdown of one of the best trend indicators, the Moving Average.
Trend Forex indicators are typically based on longer-term moving averages (more on moving averages below), but many traders want information on more current/short-term averages because they can be signal faster shifts and changes in or ending of certain long term trends.
The advantages of trend indicators are that they are easy to set up and easy to interpret. They can track both individual currencies and pairs, can follow other trading plans and develop their own, and more.
Forex trend indicators show a large variety of trends, including, but not limited to, uptrends, downtrends, and consolidation phases. Uptrends, which are also called bullish trends, show the price rising. Downtrends, which are also called bearish trends, indicate that the price is decreasing. Consolidation shows a break in movement before it continues along with the trend.
Moving Average
In simple terms, a moving average is a line that shows the average price of a currency or currency pair over a period of time to show the overall direction of the market. There are a few different kinds of moving averages; you will find the two most popular types of moving averages broken down below.
Simple Moving Average
The Simple Moving Average, which is often referred to as the SMA, is the arithmetic mean (average) for a specified time period. The SMA is designed to smooth out price movements so you can easily identify a trend. It is a great indicator when it comes to confirming a trend; however, the longer the period of time someone looks at, the smoother the SMA line will look which means it will have a fairly slow reaction to changes in the market, which is its downfall.
Exponential Moving Average
The Exponential Moving Average often refers to as the EMA. It is very similar to the SMA, but it targets more recent prices, so it responds quicker to price changes. For long-term averages with EMAs, a person may look at 50 to 200 days, and for short-term averages, a trader may look at 12 to 26 days. It is more complicated than the simple moving average, but if you are only using one Forex trading indicator for your strategy, this is a great option. You can use a dual moving average system to come up with fairly accurate estimates for when you should make your trades.
Momentum Forex Indicators
A momentum indicator is a type of oscillator indicator, and it is also a leading indicator. That means that this type of indicator can predict trend changes before they actually occur, which can be extraordinarily beneficial to traders who are trying to plan out their trades.
A momentum indicator is measuring the rate of change and speed of price movement. A trader can then use this rate of change to estimate the strength (or momentum) of a certain currency pair is. If the momentum is decreasing, a trader can predict that the market may go through a retracement or reversal soon, which will help them know if they should make a trade or not. If the momentum is accelerating, a trader can be confident that the current trend is going to hold for a while.
However, this Forex trading indicator is only beneficial if the trader understands the current market environment so that they can use it as the right signal. It can be used as both a confirmation signal and a reversal signal. The momentum indicator should be used as the first in a trending environment, but later in a range bond market. It can be beneficial in both environments, but only if the trader has the proper knowledge.
Momentum indicators are typically one line on a chart, but traders can add a smoothing line if wanted so that they can get a bigger picture of what is actually happening.
MACD
The MACD stands for moving average convergence and divergence. It is a Forex indicator that can identify a trend and then measure the strength of the said trend, which makes it a great trading indicator.
Many traders would argue that it is the best Forex indicator if you are going to choose just one. There are a few different components to this indicator. The first is the MACD line. This line is typically calculated by subtracting the 26 days EMA from the 12 days EMA. The second is the signal line. This is a nine-day EMA of the MACD line. The final part is the MACD histogram, which shows the difference between the MACD line and the signal line.
When the MACD line crosses below the signal line, it is typically a signal that the trader should sell. After they make the sale, they then should wait until the MACD line crosses above the signal line, and then they should buy. Of course, this is only one example of a trading strategy that uses this indicator.
This is a great indicator, especially for new traders, because it is fairly easy to use. It is visual, and it is rather easy to notice divergence, convergence, and crossovers. The downfall to this indicator is that some traders have found that the divergence can be unreliable and therefore believe it is better not to use the entire thing rather than risk a problem.
Volatility Forex Indicators
Volatility indicators are a type of technical Forex indicator which means they aggregate data, apply a formula, and then display the results. A technical indicator focuses on price action, so it ignores other fundamental information about the asset.
Simply, this Forex trading indicator analyzes what has happened in the past and then makes predictions based on that what the market will do in the future.
A volatility indicator is a special type of technical Forex indicator. It measures how much an asset tends to stray from the moving average. If a currency has high volatility, this means that it changes often and often trends far away from what is considered average. When a currency has low volatility, it does not stray a lot from the average trend, and it does not change direction all that often.
If a trader is going to use a volatility indicator, they need to also use some sort of moving average indicator, too, of course. Without a moving average, it does not help a trader all that much to know how much a currency tends to stray from the average. However, if a trader knows a moving average, this indicator helps a trader know how much they can trust that average. If an asset has high volatility, they may be risking more if they simply trust the average than they would if an asset has low volatility.
Bollinger Bands
There are various types of volatility indicators, but one of the most popular options is the Bollinger Bands. This indicator creates a “price channel” around the current market price to help you make accurate predictions. The price channel consists of three separate lines.
The first line is your moving average line, which is typically 20 periods. You can use any value, but experience traders generally recommend 20. The other two lines are lower and upper lines based on standard deviations. The upper line is a resistance line, and the lower line is a support line.
Bollinger Bands are based on the prediction that the market will stay within the upper and lower lines. Knowing the estimated maximum and minimum that the market could shift to can help a trader calculate risk and estimate change. A trader can expect if the market approaches the upper or lower line, it is likely going to reverse soon. Of course, it can move past the lines, but this is extremely unlikely.
Bollinger Bands, while remaining simple and easy to read, add another level of understanding when compared to moving averages alone to help the trader make more accurate estimates. There is always a risk with Forex trading, but having more knowledge and the ability to be more accurate will help minimize these risks.
There are, of course, other kinds of volatility indicators that traders use, but Bollinger Bands tend to be the most straightforward option, making it great for both experienced traders and newbies.
Volume Forex Indicators
Volume in Forex trading refers to how much of a certain asset or currency has been traded within a period of time.
Understanding volume and being able to use volume Forex indicators can be extremely beneficial for Forex traders as it can help a trader get a better understanding of certain trends and changes. It also shows how much interest there currently is for a certain currency. It is important that volume history is used when looking at fairly current data, as older data is usually irrelevant.
You can use a volume Forex indicator for a variety of different things. First, you can use it to confirm trends. If there is a rising trend, there should also be risking volume because price typically increases when there is increasing demand and enthusiasm for an asset or currency. If there is no evidence of this in the volume, it can represent a weak or soon to reverse the trend.
Volume Forex indicators can also indicate the end of a trend. If there is a sharp change in price and a sharp increase in volume, the trend is typically about to end. This can help a trader judge the risk of making a certain trade as they know if the trend they are using is time-sensitive.
Forex Trading Indicators Charts
Accumulation Distribution
This is also referred to as the Accumulation Distribution line. This Forex indicator uses both volume and price to indicate whether an asset or currency is being accumulated or distributed. It is trying to measure and identify divergences between the price and the volume to show the trader how strong a trend is. If the price is moving in one direction, but the line of the Forex volume indicator is moving in the other direction, the trend is probably weak and will change soon.
This line basically shows a trader’s supply and demand and how that is influencing the price so they can make beneficial trades. The line can move in the same direction of the price or the opposite depending on the strength of the market trends at the moment. This trend is basically used to calculate reversals and not a ton else. If a trader’s strategy is based around reversals, the volume Forex indicator is a great option for them if they only want to use one. However, if their trading strategy is based on predicting and following trends, they may want to use a different indicator.
There are, of course, other volume Forex indicators, but this is the most common and favored by most traders who use volume-based indicators.
Conclusion
Indicators are an important part of developing a trading strategy. Without them, trading would be a shot in the dark with a lot of risks. However, the strategy or strategies that a person uses depends upon their specific needs.
Some traders usually have multiple different strategies and may use completely different Forex indicators depending on what strategy they are using at the moment. It is important to remember that the more Forex trading indicators you track, the more information you have, which can help you make more successful trades whether you are buying or selling.
However, with more Forex indicators, there is more room for error, which can be devastating for a trader.
Even if you are not using every indicator on this list, it is a great idea for every trader to have knowledge of these various types of free Forex indicators.
In the world of Forex, trading knowledge is power and can prevent financial devastation. It is also important that you have plenty of knowledge about the market itself to help you use these Forex trading indicators correctly. Additionally, if a Forex indicator ever contradicts your knowledge about the market, this can be a sign you need to look back through your calculations.
Hopefully, this article has helped you understand a little bit more about Forex trading indicators, so you are more prepared to make your next (or first) trade. Good luck!
A Forex trading indicator is a certain change or pattern a Forex trader looks for in the market to predict future shifts and changes.
A list of proven best Forex indicators that can help you in trading:
Hello investors! In this lecture, I will talk about the trend lines and the counter-trend lines. And this is exactly the thing I use when buying an asset, not just for this Bitcoin investment strategy but for many of my strategies that are based on counter trend lines.
This is a free lecture from the Bitcoin Investment Strategy course created by me Petko Aleksandrov.
The trend is upwards when we have a series of higher highs and higher lows and the opposite for the downtrend. Now, with such platforms, we have the opportunity to draw lines.
And, for example, I can draw a trend line that goes with the trend. This is why it’s called a trend line. If I draw it, it will look something like that.
Example of an uptrend
Basically, to draw a line you need to have 2 points.
It shows that it’s an uptrend. And according to the line, when the trend is over, it should be when the price crosses the line. It’s not anymore an uptrend, it turns to a downtrend and actually it does in this case.
For this Bitcoin investment strategy I use counter trend lines
And it’s the very same thing for the downtrend. When we are in a downtrend, this is when we have a series of lower lows and lower highs or we can draw a trend line starting from the top, connecting the next lower high. I will try to make it a little bit more precise.
Example of a downtrend
Try to do it very precisely if you are following a strategy with a trend line. There are a lot of strategies with trend lines.
So, for example, when the price touches the trend line, we can sell again. Or if we’re talking about an uptrend, we can buy if the price touches, and so on.
But in this strategy, I will be using counter trend lines. I usually don’t use trend lines in my trading, I use counter trend lines. What does that mean?
Drawing the counter trend line
The trend line is the one that goes together with the trend. So the counter trend line will be just the opposite thing. We will draw lines that are opposite to the major trend.
The counter trend line
How do I draw it?
I take the recent high, let’s say the market forms 2 highs, one high and another lower high, and I take these 2 points to draw the counter trend line. And this is a strong one because the price nearly touches it, goes down again, and breaks it.
Exactly this break is the thing I use when I use the Bitcoin investment strategy.
This is where I buy and I remember actually this moment in September 2017, it was one of my entries because it matches perfectly with the strategy that I am following.
The trading view
But I will complete it step by step so you will understand me easier. So, one more time, the counter trend line is the opposite of the trend line and I draw it by connecting 2 highs. Just when I have a higher high than the previous one, I’m waiting for a lower high to draw the line.
When the price breaks, this is my trigger, this is the moment when I buy and the place where I buy on the chart. And you can see with trading view when you have a line, you have some more details about the lines which is very nice especially the angle.
But I’m not going into such details about degrees of the counter trend line and so on. And if I go back just a little bit, you will see that I have another counter trend line.
The other counter trend line
Actually this was the correct one I guess because it’s a little bit higher than the other one. So a high, a lower high, and then the price breaks. And, for example, there are places that I cannot draw such a line because I don’t have a lower high.
The coronavirus crash effect
The price just went up, it went down, and it went up again. And now let me go to the recent examples that we have in 2020 so you will see what counter trend lines I used.
It is right here after the crash in March from the coronavirus that made not just the stocks but cryptocurrencies to crash.
The coronavirus crash
But this gave me great opportunities and not only to me but to many investors and traders to buy at a cheaper price.
And I want to be more precise about this Bitcoin investment strategy in my drawings, this is why I will go to the hourly chart. So this is the current market that we have after the crash since March.
The current market
So what we have, first of all, the uptrend was back after these highs were broken.
So we have already a series of higher highs and higher lows. So after that moment, I started to look for buying opportunities. It was really uncertain if the price would go up or if it would crash lower so I stuck to my strategy and I was waiting to see an uptrend before buying any cryptos.
The impulsive break
And below is the first counter trend line that I used.
The first counter trend line I used
And we have an impulsive break. An impulsive break is defined when we have high volume, we have it below, we have a long candlestick, we have close on extreme which means that the candlestick will close near the top. It will not do a move like that.
And then the last thing for the extreme break is that the candlestick above the line should be a bigger part than below the line. So basically, where it breaks if it’s in the middle, half above and half below, this is ideal.
Perfect example of the strategy
This is like the perfect example of the strategy. And later again I will show you examples where I’m executing the positions or actually when I’m buying the cryptocurrencies.
I can draw many different lines, but for this Bitcoin investment strategy you need the best ones
Next counter trend line, I draw only when I have a higher high than this one.
So I don’t draw lines everywhere. Why? Because if I do it this way, I will have hundreds of examples. If I zoom the chart, you will see that I can draw so many different lines. But I want to have a very clear counter trend line.
So I have the top, I have the lower high, and then I’m looking for a new higher high to draw the next counter trend line.
Price breaks, it goes down, sideways, and it continues higher. So we have a higher high and again we have the opportunity to draw a counter trend line.
What prevents me from buying from this strategy
So now it really depends when you catch it. For example, you can draw a counter trend line that is pretty strong if it has 1 to maybe 4 touches, and then the price breaks impulsively. Or if you just catch it a little bit early and a little bit faster, you can draw it like I did.
But there is something here that doesn’t allow me to buy from this strategy and this is the thing I will talk about in the next lecture. So there was the counter trend line which turned out to be a strong one because the price touched it a few times and then it broke.
And then the price retested it and it continued higher. Now, after that, we had a higher high. And then the price went aggressively higher in April.
Now, these all were opportunities for me to buy and I use them and it takes really a lot of patience to wait for the counter trend line. And if you look at the whole thing, you will see that we’re in an uptrend. But I want to buy just when the price pulls back which is very normal on the market. Just before it starts to go up again, I will buy.
The price goes up and down, forms higher high, higher lows, then it fails to take the high. Then I draw the counter trend line, and when it breaks it, I buy again and again
So these are the different entries for me when I’m investing in cryptocurrencies and there is one tiny little thing that I use or that I look for before I buy and I will show you in the future updates in the course.
Using Simple Forex Trading Strategies is the simplest way to participate in the market
Hello, dear traders, this is Petko Aleksandrov from Trading Academy and I will show you that using simple Forex Trading strategies can bring you great profits. No need to look for complicated strategies or complicated robots.
I have placed the Expert Advisors over the MetaTrader platform. Or in other words, these are simple Forex trading strategies that are executed automatically. And I have created the Expert Advisors with EA Studio which is a professional tool for algorithmic trading.
You can see there are many trades opened already. Basically, the blue lines show where the trades were opened and the red lines show where the Stop Loss and the Take Profit are.
The strategy
And when there are many Expert Advisors, it’s really hard to recognize anything from the chart and we don’t use it.
We don’t look at it. Basically, what we are looking at is the terminal where we see the open trades and mostly what I’m focused on is the account history.
Account history
This is where we see the closed trades and the result. Currently, I have already $422 of a profit and an open profit of $20, and this is for less than 12 hours trading. But I focus on the account history. So even if my account goes on a loss, if the open trades go on a loss, this is fine.
I am taking into consideration only the closed trades because the open trades change and the result changes all the time. For example, just an hour ago it was above $100 of a profit over here, now it has reduced to about $20.
So on the account history, we see the closed trades. And these are the actual results that we have from these simple Forex trading strategies. Now, having the account history when we trade with Expert Advisors is really a headache to follow the results.
On the right side, you see Comment which is the section where we see the Magic Numbers.
Comment
But even if I arrange it according to the Magic Numbers, it’s hard to see which simple Forex trading strategies are profitable, which ones are losing, and which are the most profitable. You need to calculate it or put it in Excel and do some calculations from there.
And this is just less than 1-day trading, like 12 hours of trading. When I trade with these Experts longer, it will be really hard to do it from the account history.
So I use external websites like FX Blue or Myfxbook. And actually, from the Forex software company which has developed EA Studio, we are expecting such a tool in 2020, it will be free for everyone. But at the moment I am using FX Blue and I connect the account via FX Blue Live.
So I will connect my Demo account to FX Blue and if you don’t have any of my other courses, you will see how it is possible to follow the results in the account very easily with such a statistical website.
I will click on register, and here I will need to select my broker server. I will press J to find it easier. Please don’t take any of the brokers as a recommendation. I need to select any for my courses.
But there are many brokers listed and if you don’t find your broker server, you cannot really do a lot. I mean I don’t think they will add if you ask them, you just need to switch to any of the other brokers.
The registration to follow the results of so many Simple Forex Trading strategies is easy.
But anyway, there is a huge choice that FX Blue displays. And I will need to enter the account number. Then I will paste the read-only password. This is the investor password, and then I can enter any of my emails, click on Register, and that’s it.
FX Blue registration process
An important point to note, you need to click on the account synchronization,
Account synchronization
and even if you don’t make any changes, click on Save changes.
Save changes
This will simply synchronize your account. And then when you go to Statistics you will see that my account is connected. So I have now many more statistics from the Meta Trader history for all the Simple Forex Trading Strategies that I use.
The statistics
What I have is a weekly return, monthly return, Profit factor. Now, this is an expectation based on the performance so far. So it’s not something we are looking at.
As I said, what we are focused on is the account history. Basically, the closed trades that we have so far. And we have just 2 days of history and it’s even less because I placed the Expert Advisors yesterday. And then we have a lot of statistics, charts, and the balance line is just great at the moment.
Charts
You have Open/Closed trades, Symbol, we have only EURUSD here in the Direction, and many more.
Backtesting the Simple Forex Trading Strategies
What I’m focusing on is Strategy. When I click on Strategy, I see all the strategies that opened and closed trades up to this moment.
Strategy
Here are the Magic Numbers so I know which Expert Advisors actually make the most profit. And here we have trades, which means the number of trades. So some of these Simple Forex Trading Strategies opened just 1, 2, one opened 3 trades already. And actually, I think it made the most profit of $47.20.
And then we have the Gross profit, Gross loss, Net profit, a thing I use to arrange the Experts. So when I click on it, I will see first the negative results. But when I click on it one more time, I will see on the top the strategies that have the most Net profit. And this is exactly what I am looking at when I am choosing the top 10 Expert Advisors or the top 10 strategies.
Simply, I can see until this moment which are the top Simple Forex Trading Strategies that are currently making a profit on the current market from yesterday till today. And this is the most realistic test that you can have with the Expert Advisors and strategies, not backtesting them. Of course, backtesting is great because it shows the performance of a strategy, something we cannot have with manual trading at all.
Profit factor for the Forex Trading strategies
The most realistic test is to test these Simple Forex Trading Strategies on the current market, on the current market conditions when you will actually be trading with them. So we can see 1, 2, 3, 4, 5, 6, 7, 8, 9, 10. For the current moment, these Expert Advisors until the one with Magic Number ending in 623 are the Expert Advisors that make the most profit.
Most profitable EAs
Now, all of these Expert Advisors still don’t have a Profit factor because they did only profits, and the ones below did only losses. The Profit factor is defined as the gross profit divided by the gross loss. And when we have profits and we have losses we will see the Profit factor. And then on the right side, we have a lot more as statistics; we have Winners, Losers, Average win, Average loss, Best trade, Worst trade, a lot of statistics.
We also have the longest trades, the shortest trades, pips are something very interesting that you can have a look at especially if you are trading some strategies with different lots. Then having the Net profit will not be a very precise statistic but when we are trading all the Experts with 0.1 or 1, I mean one and the same lots, then Net profit is just fine.
Practice on 2 Demo accounts
But if you trade Simple Forex Trading Strategies with different lots, then you should be looking at the pips, total Net pips. And until the end, we have many more statistics.
More statistics
So this is how I follow the results of the Expert Advisors, this is how I see which are the top Expert Advisors. Now, you can create your own rules. I mean you can create rules like wait 1 week for the Expert Advisors to trade and see which are the 10 Expert Advisors.
You have the Magic Number. Copy it,
Copy the Magic number
and then you go to the Expert Advisors, Open Data Folder,
Click Open Data Folder
MQL4, Experts,
Click Experts
here they are.
The Experts
And you have the Search Experts tab where you can paste it, press enter and you will find it. This is the top Expert Advisor.
The top Expert Advisor
You can copy it from here and you can move it to your live account. Or as I always suggest in my courses, open a second Demo account and place there the top 10 Expert Advisors, or the top 5, or top 3, it doesn’t matter. But practice on 2 Demo accounts first. So try to simulate like real trading on a 2nd Demo account until you are confident with the system until you get used to managing 2 accounts.
Get 50 Simple Forex Trading Strategies monthly
And actually, it’s really easy to manage it. I mean we place the Expert Advisors, they start to trade, and then we connect it with FX Blue, and then we just follow the results and we see which are the top Expert Advisors. As I said, you can create your own rules. You can wait 1 week, you can wait for 5 trades to open at minimum before you select the top 10 Expert Advisors.
You can keep the Profit factor above 1.2, something which I really like. Or you can use Winners or Losers so you can make your own win/loss ratio, for example, have 7 out of the 10 trades to be profitable in order to move any of the Expert Advisors to your live account. So I leave it up to you. It depends on how you want to manage the account.
My job is to give you the Expert Advisors. In the Top 10 EURUSD courseI will provide you with new 50 Expert Advisors which are Simple Forex Trading Strategies, every month so you will have a huge choice between strategies.
You can combine Experts from different months, you can depend only on the Experts that I will give you every new month, so it’s really up to you. Try to create your own rules, make sure to follow them strictly.
Be sure to follow the rules
As well, when you move any of the Expert Advisors to your live account or to another Demo account, make sure to follow these rules there as well. So, for example, if you say that you will wait for 5 trades minimum to open, or let’s say you wait for 3 trades as a minimum, you will wait for a Profit factor above 1.3.
And you move this Expert Advisor to your live account or the second Demo account. If the performance falls below that, if you see that on the other account the Expert Advisor has a lower Profit factor than 1.3, you remove it from there because it’s not within your rules anymore.
And it’s really recommendable to follow from Filter the last 1 month or the last 2 weeks so we can change the date range from here.
Normally, I look at the last 30 days, and the last 2 weeks which I use start date and end date and I look at the overall performance.
The filter
So make sure that when you are following the results, you’re looking at the long-term, and the intermediate-term, and in the short-term as well. So this is how I trade with the Expert Advisors. Really easy, not something hard.
Practice on a 2nd Demo account before going for a live account
Practice on a 2nd Demo account, you will see that it works really nice to move Expert Advisors from one account to another and to keep the top 10 Expert Advisors on a separate account. This is how you will get the skill to trade always on a live account the Simple Forex trading strategies that are currently profiting. So I have still very few trades opened. I will go a little bit more aggressive.
In many of my courses, I show that I wait for at least 5 trades but here I will go to 3 trades minimum and Profit factor above 1.2. So I want to see Profit factor above 1.2 and minimum 3 trades in order to take these Expert Advisors for my live trading account, or as I always say, better on a second Demo account so you will be able to practice this way.
And this is how I will demonstrate it. So now I will leave the Expert Advisors trading for some time and then we will see what results we will have and we will see which are the top 10 Expert Advisors that make the most profit at the current moment.