Dear investors, in this lecture, I will show you how you can do a Coinbase withdraw to a bank account. I know that many of you, especially the beginners, are worried if you can get your money back once it is invested in the exchanges or the cryptocurrency platforms.
And you have to worry about that because there are so many scammers around – scam companies, brokers, and exchanges. Many people lose just because they cannot withdraw their money. With Coinbase we can withdraw money and I will show you that in this blog post.
I have no problems making a Coinbase withdraw to bank account or to my PayPal account. And personally, I think that it is very important to withdraw money because this way, we see the effect of trading or the effect of investing.
If you just fund your account and you fund more, and you keep buying but you never take a single dollar out of it, you will never really feel the satisfaction from the investing and from having profits into your account.
As well, this is one way to keep the greed away because the more money you have in the account, the more the profits come. Usually, the investors and the traders get greedy and they buy even more. And if the market crashes or something happens against your strategy, there is always the risk of this happening.
Also using a regulated Cryptocurrency exchange is very important. Coinbase is one of the exchanges that I use. I have a free video about the Top 10 Cryptocurrency exchanges out there:
Make simple rules for your Coinbase withdrawals
You might lose a sustainable amount of money. This is why if you withdraw some funds from time to time, first, you will feel great to have them back as a Coinbase withdrawal in your Visa card or in your PayPal account. Second of all, you will stay away from greed which is a bad emotion that drives people into losses.
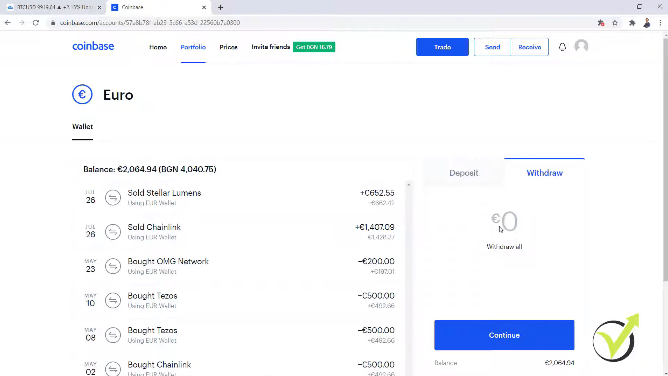
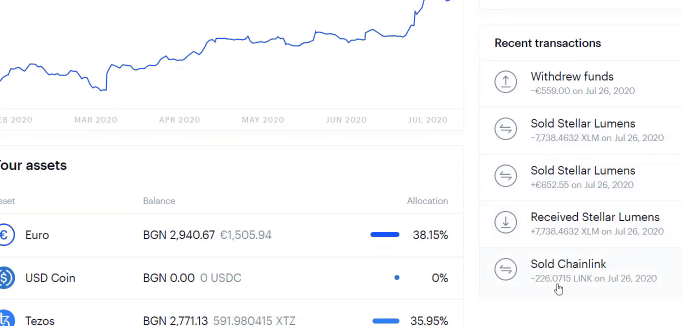
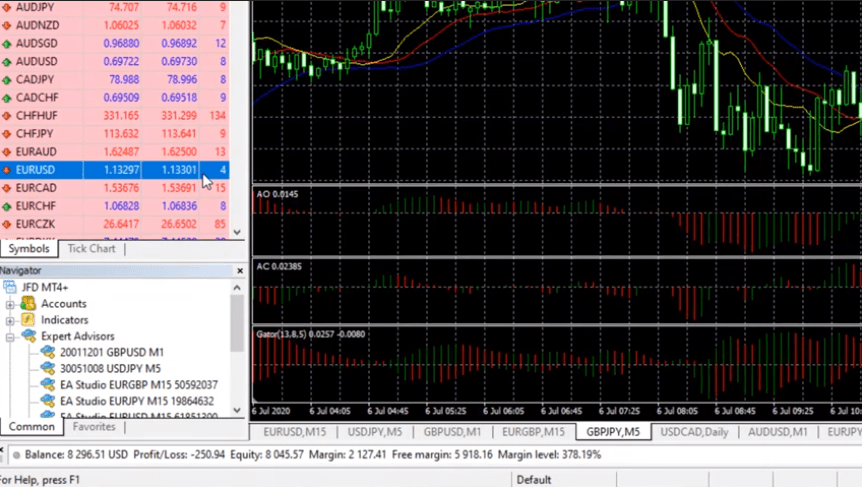
You can make simple rules. For example, now I will withdraw the profit that I had from this cycle and I will click on the EUR Wallet. And on the right side, I have the option to withdraw.
The EUR Wallet
How much was the profit? It was €559 total.
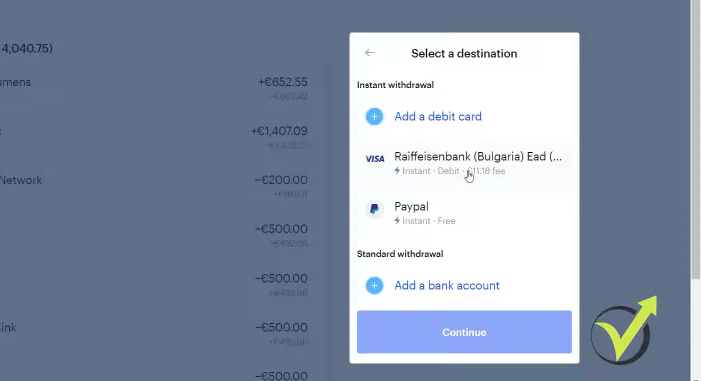
I click on Continue. And Coinbase gives the chance to withdraw to the Visa card that I have used for buying the cryptocurrencies. There is a fee and I have the option to withdraw to my PayPal account which is free without fees. But my PayPal account is in USD and I’m withdrawing EUR.
The conversion rate in PayPal is pretty bad and first my money will be converted from EUR to USD. And when I withdraw it to the Visa, it will be converted to Bulgarian Levs which is the national currency. This will bring me much more losses than the €11 fee.
Coinbase withdrawal methods
Coibase withdrawals are instant
So I prefer, in this case, to withdraw to the Visa card. If everything is in one currency, if you are living, for example, in Germany, you have EUR Visa card, you have EUR PayPal account, and you have EUR Coinbase, great. You will not have any conversions.
Or if you’re in the States and everything is in dollars, even better. So keep these conversions in mind. This is why I prefer now to withdraw the money to my Visa card. I click on it and then I will click on Continue, and the funds will arrive instantly which is pretty nice.
Anytime you need the money from your Coinbase account, you can withdraw it and there will be 11.18 of withdrawal fee. I click on Withdraw now, it will take a couple of seconds. I have now the funds into my Visa card and the balance in the EUR Wallet is less now.
I just got the message on my cell phone that the money arrived in the bank. So it’s really instant Coinbase withdraw to bank account, one of the reasons I’m using this exchange. And as I said at the beginning of the course, don’t take it as a recommendation. I don’t suggest using it.
Coinbase withdraw to bank account is a personal choice
It’s up to you which one you want to use. But before you put a bigger amount of money, it is really recommendable to do such tests.
So buy some cryptocurrencies with small amount of money, then withdraw, see the money back to your Visa card or to your bank account to make sure that the exchange allows you to withdraw money because the scammers, the scam brokers, and the scam exchanges will not allow you to do that.
And, one more time, it’s up to you if you want to perform Coinbase withdraw to bank account. Personally, I withdraw sometimes the profits but at the same time, I want to have balance in the EUR Wallet. So if I have new buying opportunities, I will buy from the Wallet which will result in fewer fees to Coinbase.
Because, as you saw, when I buy from the Visa card, it’s a bigger fee. Or in other words, withdraw money whenever you need it. But if you don’t need it, you better keep it in your Wallet so you will pay a smaller fee the next time you buy cryptocurrency.
The Fibonacci system that I use to take the Profits
I hope these tips were useful to you. And really, it’s up to you if you want to sell the cryptocurrencies because there are so many people that are just buying continuously. And if you are that type of person, this is just fine.
You can use the entries that I demonstrated along the Cryptocurrency Investment course to buy cryptocurrencies and you can just hold them in your portfolio.
The entries
This is just fine if you can afford it and if you want just to keep the cryptocurrencies. But because I’m originally a trader, I prefer to take the profits and not to hold positions. And most of all, because I want to be realistic in the market. And because I love when I do Coinbase withdraw to bank account or to my PayPal account.
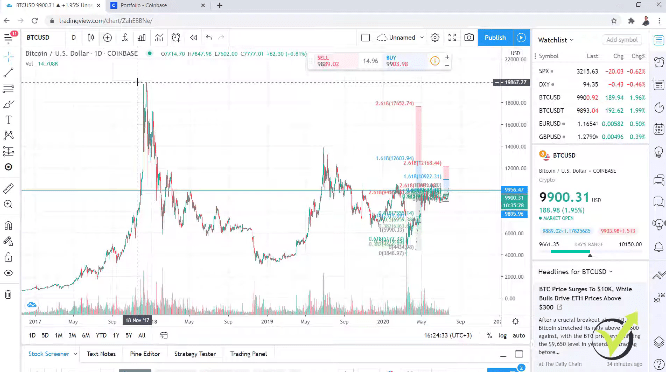
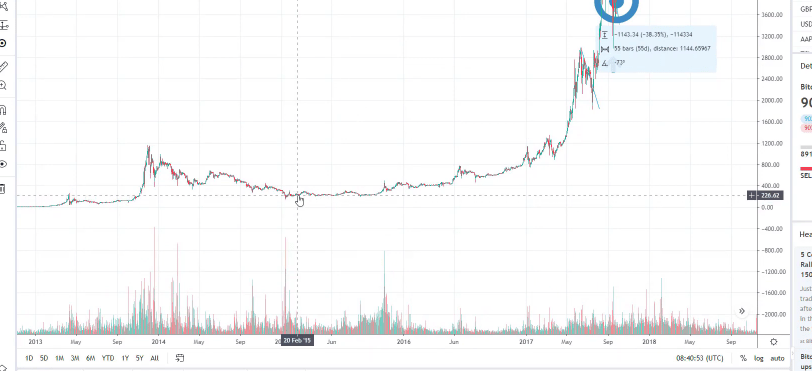
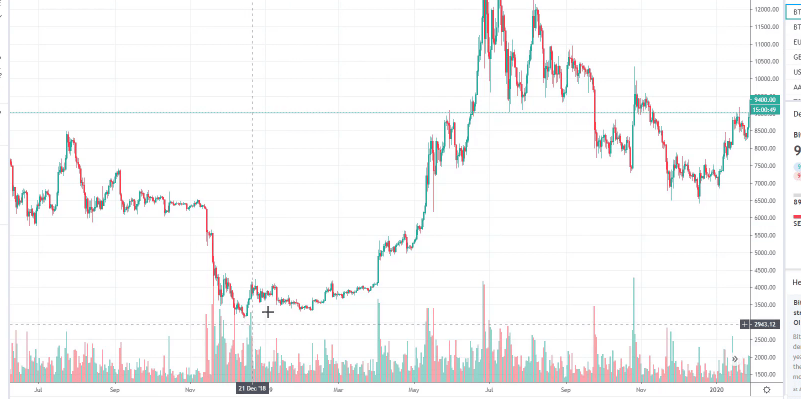
If I go to the daily chart and I show you the bigger picture of the Bitcoin, it is just one time when the price went to 20,000.
Daily chart
I’m not saying that it will never happen again, I don’t know that. But I’m realistic and I see that the price bounced off the 10,000 many times.
So it’s a great level for me to take profits and to sell the cryptocurrencies. And as well I use the Fibonacci which is a great indicator, it is connected to the trend. It works for me really to use the Fibonacci targets. And even if I sell everything, I know that there will be new opportunities.
The Fibonacci
Feel free to ask any questions
There are always new opportunities to enter the market and to buy again. Especially when we sell everything, the price drops, we buy at lower prices and we are on profit again, that’s the best thing in this strategy and in this system.
Thank you very much for watching the course, guys. It was really a pleasure recording it. If you have any questions, don’t ever hesitate to ask me. Send me screenshots of your screen, I will be happy to give you some suggestions, tips, or ideas, or to compare it with my current setup and see if we are looking at the same thing.
If we are not, we will discuss it. Maybe I am wrong and you are right. It will be beneficial for both sides and for all the other students that see the questions, the pictures, and the discussion.
That’s it for now. I will keep updating the course with new examples and new investing opportunities that are there on the market and I wish you always to have a great day.
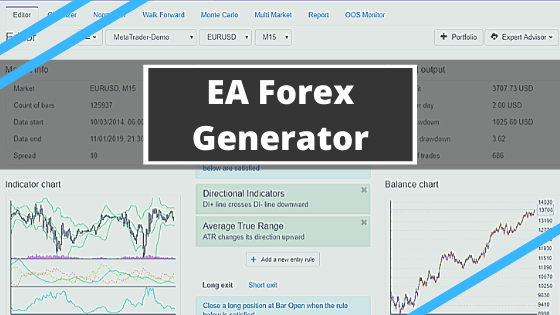
EA Forex generator is what traders use nowadays to create their Expert Advisors
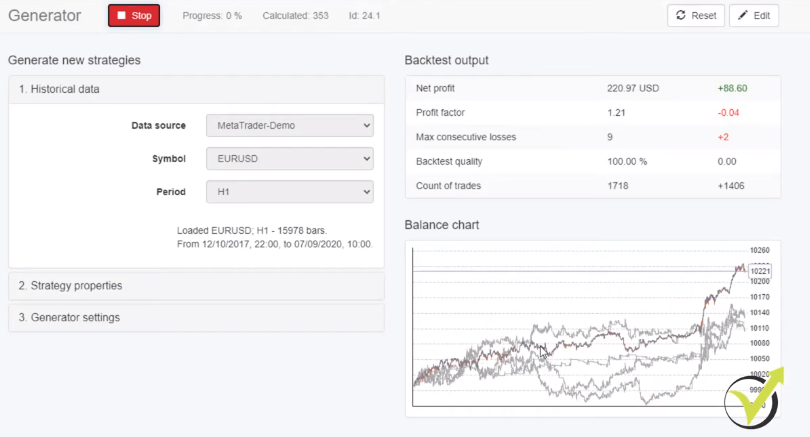
Hello traders, today I will share with you some new features in the EA Forex Generator in EA Studio. Also, I will explain what is the Generator to the people that never used it.
The Generator is a powerful and advanced algorithm that is a core of the strategy builder EA Studio. It uses Historical data (bars and candles) from MetaTrader to generate, optimize, and analyze trading strategies. From there we choose the strategies and automate them as Expert Advisors without programming skills. Actually, we do it with one click.
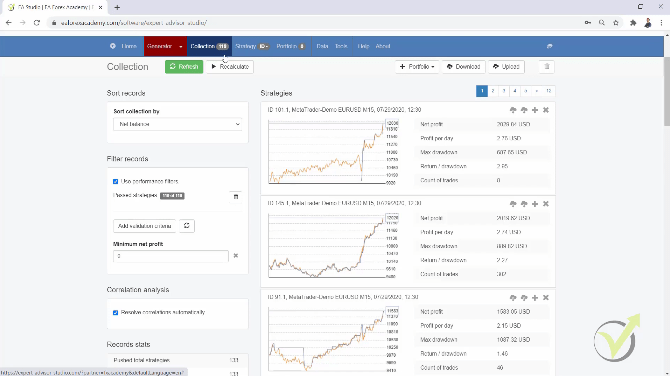
So after we use the EA Forex generate to produce strategies for us they all go to the Collection. What we have now quite interesting is that you can increase the collection capacity from Settings. Until the moment, the maximum was 100. But we can now have 300 strategies into the collection which sounds really great.
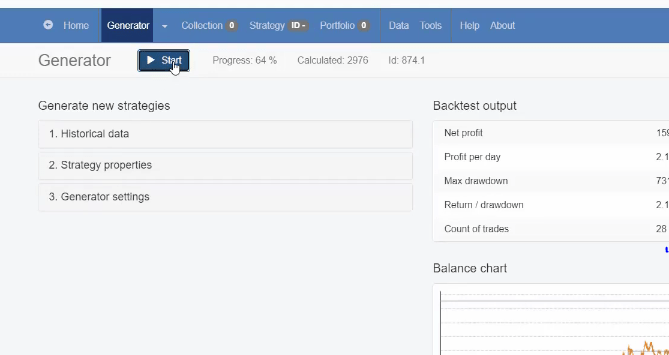
But you should have a couple of things in mind when you are using such a huge number. Let me go to the generator and I will run one generator without any Acceptance criteria just to see many strategies into the collection.
The generator
By the end of the lecture, I guess there will be more than 100 or maybe we can even reach 300 strategies.
So it is great for some people to have so many strategies into the collection. But you should keep in mind 2 things. One is that every time when the generator pushes a new strategy into the collection, it calculates the correlation analysis against each strategy.
The collection is where all strategies go after the EA Forex Generator
Imagine there is a new strategy now, 59 or 60, and there are already 58 strategies, and EA Studio calculates the correlation against each one. The more strategies you have in the collection, it will calculate against more strategies and it makes it a little bit slower.
We have more than 100 strategies in the collection which is quite interesting to see because so far we were used to seeing just up to 100 strategies.
The collection
What I was saying is that this doesn’t make the EA Forex generator itself slower. We have the same speed but it makes the pushing to the collection slower.
It generates strategies and when there is a new strategy, it takes just a little bit longer to push it to the collection because it calculates the correlation analysis against much more strategies. This is not really visual for us, it works so fast.
But there is a little bit of longer pushing that you might want to have in mind. You can feel as something slower is if you have the 300 strategies.
Max entry indicators and Max exit indicators
The next time when you open it and EA Studio loads on your browser with 300 strategies, this might be slower up to 20, 30, or even 40 seconds. But this is just when you load it one time.
I will run the generator again so we reach the 300 strategies. It’s quite interesting to have this option with the maximum entry and exit conditions. As you understand from the name, if you leave it at 4, you will see strategies with no more than 4 entry conditions and 2 exit conditions.
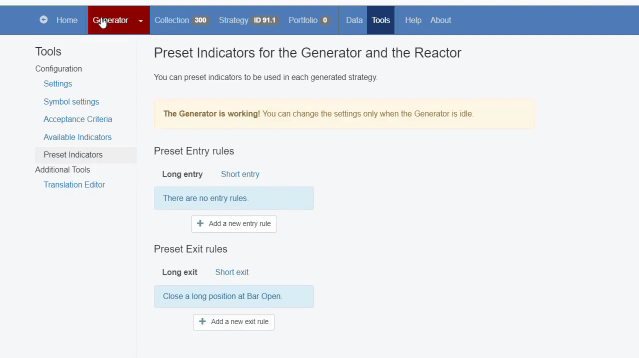
But what’s interesting here is if you are using the preset indicators.
Preset indicators
If you put 3 preset indicators, the EA Forex Generator will have room just for one indicator. So, one more time, if you keep the default 4 as maximum entry indicators and you select to have 3 preset indicators, the generator will add just one.
Now, what happens if you select 4 maximum entry indicators and you select 4 preset indicators? You will see strategies with 5. This is because the EA Forex Generator will always add an extra indicator. So keep that in mind. If you set, for example, 2 maximum entry indicators, you will see in the collection strategies with 3.
EA Studio will continuously be improved
I will stop the generator, we have 300 strategies in the collection. Many people wanted that. I don’t really find that necessary. Personally, I think 100 was more than enough. And just to let you know, many years ago the first generator, the FSB Pro was with just one strategy in the collection.
Then they added top 3 or the 3 top strategies, and then 10. Ever since EA Studio was launched, we had 100. But now because many of the traders want it, 300 is the maximum number. I’m not sure if it will increase further but just, one more time, keep in mind that it might make the whole process a little bit slower.
It could increase even more but this is because we are getting much faster computers. Nowadays, we have computers with 8, 16, 32GB RAM, and before it was just with 2GB RAM. And obviously, EA Studio will improve much more together with the industry.
This is really nice that they keep updating it and improving it. Now, I will remove this collection, I will go to the EA Forex Generator and I want to demonstrate to you what I just said, that if we have Max entry indicators 2 and we use preset indicators, I will add 2 preset indicators.
The role of the EA Forex Generator
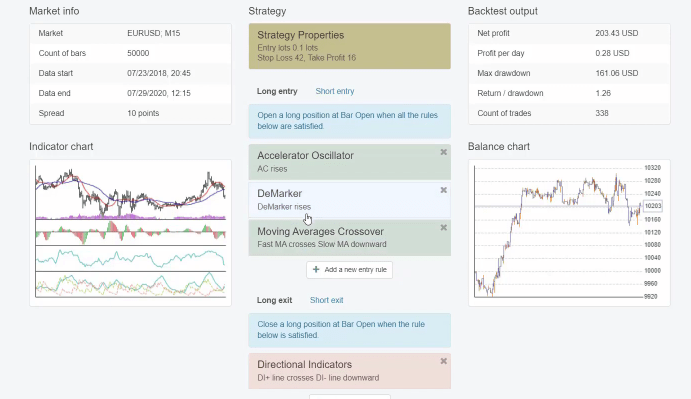
Let me add DeMarker, I click on Accept. We have 2 indicators – the Accelerator Oscillator rises and the DeMarker rises. And in the generator, we will have strategy properties. I will use Stop Loss and Take Profit from 10 to 100 pips.
And in generator settings, one more time, we have Max entry indicators 2 and we have preset indicators 2. Let’s run the generator now and see what we will have. We have already strategies into the collection.
And if I click on any of them, I will click on one because it has a bigger count of trades, you will see below that I have the Accelerator Oscillator rises, I have the DeMarker rises, but I have as well the Moving Averages Crossover.
A random strategy
So the generator added an extra one indicator.
If I go in the collection and click on any of the strategies, this will apply to all of the strategies. There will be an extra indicator. Because at the end of the day, this is the work of the EA Forex Generator, to generate strategies with something additional.
I will keep you posted regarding the EA Studio updates
So if you have 2 indicators, it will add you a third one. These are the updates that we have in EA Studio recently. I will keep you updated with what is new. And if you are using EA Studio daily, it is really important to follow the updates so you will take the maximum out of this great strategy builder.
Don’t forget that EA Studio comes with a 15-days Free Trial which you can use to generate many EAs. This way you will be able to test the EA Forex Generator by yourself.
Thank you guys for reading. If you have any questions, you are welcome to write in our trading forum.
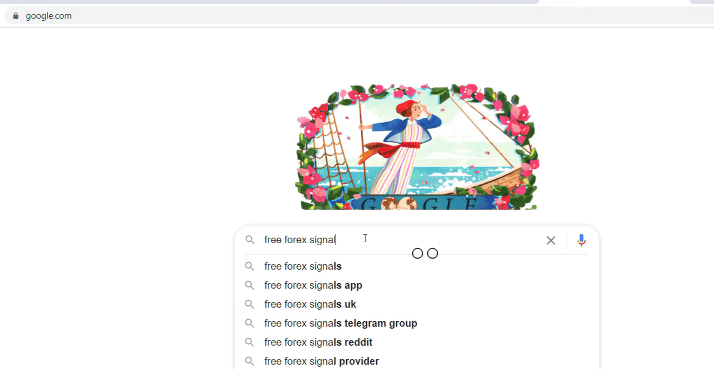
Hello everyone, today I will teach you how to use free trading signals because it is very common for the traders to fall into the trap to go to Google and to search “free forex signals.”
What most traders search for on Google
The results they get are not really free. Most of the trading signal providers will charge you money or they will ask for your email and they will start spamming you and sending you offers. At least they will be trying to sell you something different. Most of the results are from brokers.
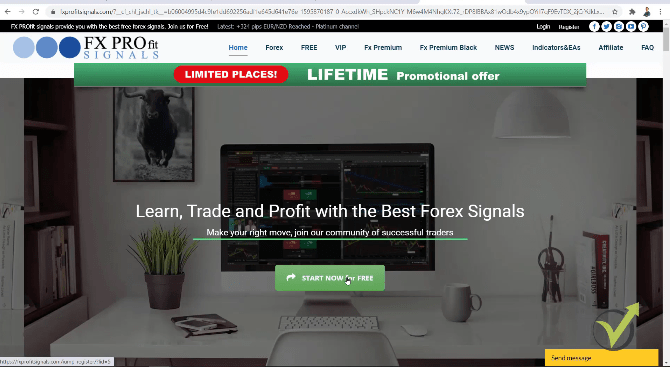
I’ll click randomly on any of the results – FX Profit Signals. The website redirects you to something. What do we have here? Limited places – lifetime promotional offer. I’m not really sure what’s the offer.
The random website I chose redirects you
Start now for free. Learn, trade, and profit with the best trading signals. I just want to show you an example of a signal provider and I want to show you how much they charge for that.
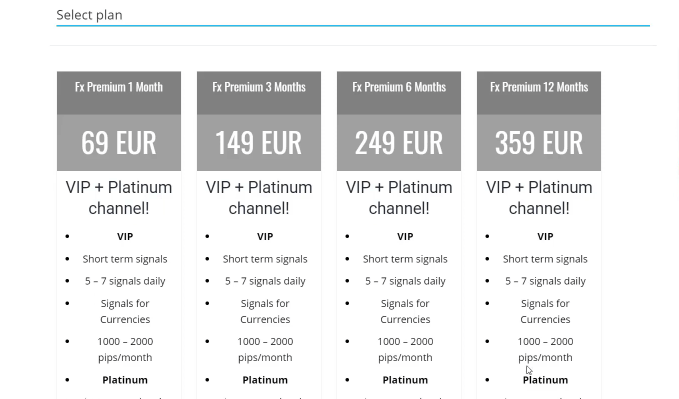
These websites will not let you learn
In this random website that I have landed, we have €69 per month, for 3 months, €149 for trading signals, and for 1 year we have €359. This is for 5 to 7 signals daily.
The charges
Look at the promise, 1,000 to 2,000 pips a month.
Interestingly, we see no backtest, no results, at least I don’t find them from the first view. But they don’t look like cheap Forex trading signals. You can go through the websites yourself to look for more free trading signals. But as you saw, on this website it was free but when you go to the premium and so on, you have to pay.
Now, either they will send you just some free trial period which is quite normal or they will send you a couple of free Forex trading signals just to attract you as a client. The thing with all of these websites and with the whole idea to use live trading signals is that you are not going to learn anything.
Even if you pay for a couple of years, at the end of the day, you will have no idea why these guys are sending these signals to you, what is the strategy behind, and why some days you lose and others you profit
You can do the trading signals yourself
When I say live trading signals, they will not be really live because you will always be late. How these trading signal providers work is they will either send you a message push notification, they will send you an email, maybe some chat, Skype, anything but you will always be late.
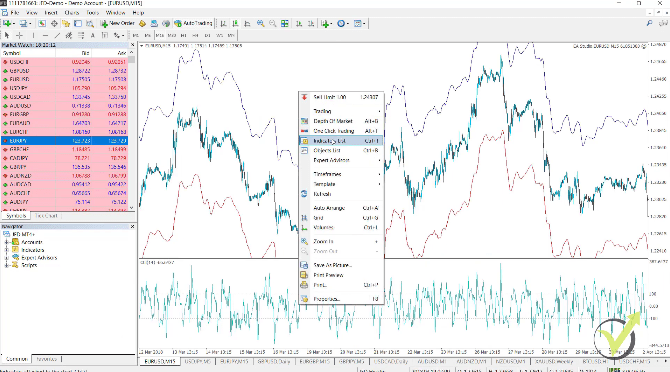
Let’s say I receive such a signal at the moment that I have to buy EURUSD. I will need to open the platform where I have an account, and I will go to EURUSD and I will do one-click trading and I will buy.
I will need to open the platform from where I am
In this case, it took me a couple of seconds because I am in front of the computer and I have the trading platform open.
What if you are in the bathroom? What if you are outside walking? You will stop and you will execute the trade from your phone. What if you are driving? This will be dangerous. Don’t get me wrong. I am not saying you don’t do Forex trading signals.
Why I don’t do live trading signals?
It is expensice
It is Never free
I can do it by myself and I will teach you how to do it, now!
Whichever trading platform you use, you will gain access to the market
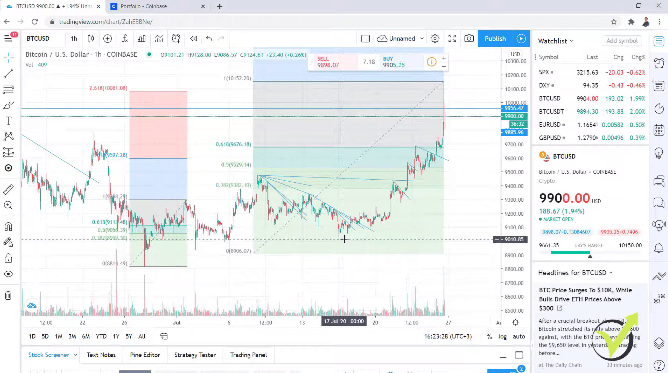
Actually, it could be signals for anything. It could be for the Bitcoin which is quite volatile recently. And just yesterday, I recorded a couple of examples of how I am trading and investing in the Bitcoin and I have my own trading signals from the chart itself.
All of these lines that I have on the chart, they give me signals when to buy and when to sell.
The lines give me signals when to buy and when to sell
Believe me, it’s really nothing complicated. In this free lecture, I will show you 3 different ways that you can have your own free trading signals so you don’t need to pay subscriptions to anybody and you will end up making some money for yourself as additional income.
Or, of course, if you want to do it more professionally, with the time you will have an idea in which direction to go. So number one is the price action trading and I have some great videos about it. I have a Price Action Trading Course where I show in detail the system.
I will show it to you over the Bitcoin. What we have always is the trend. No matter which trading platform you are going to use – it could be TradingView, it could be Meta Trader, all of these platforms give you access to the market.
The Demo account is where you need to start from
If you don’t know where to start, just download a Meta Trader platform from a regulated broker and open a Demo account. This is a virtual account, no engagement. You will not spend a single dollar but you will haveaccess to the market and I will teach you how to have your own signals.
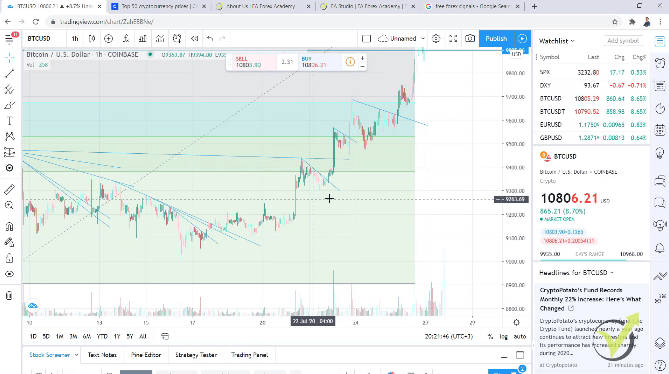
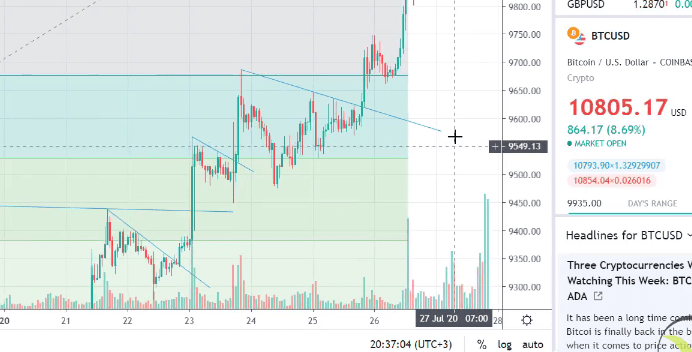
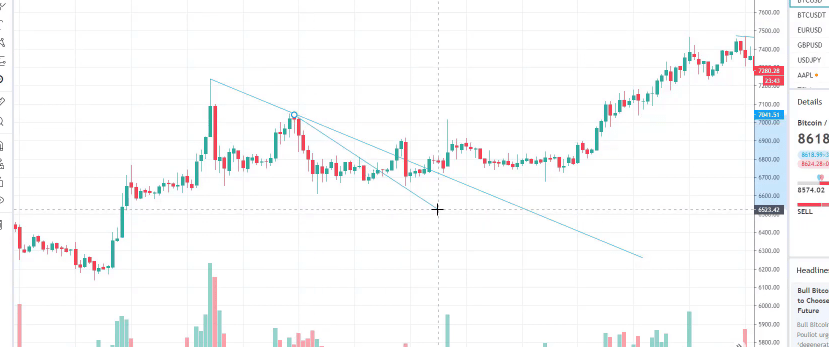
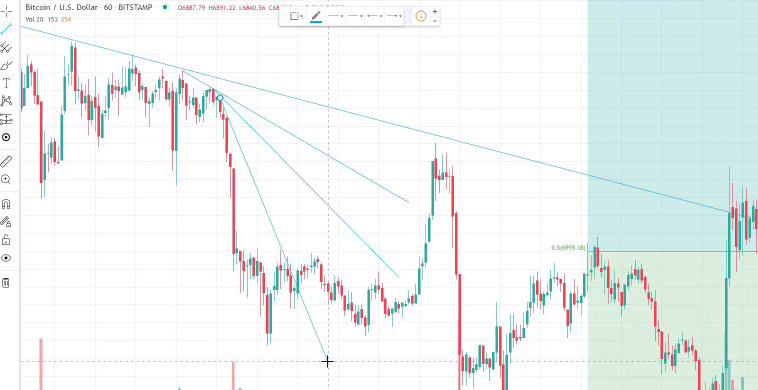
Going back to the TradingView platform, I have the Bitcoin over the chart and I have lines that are drawn over the chart. For beginner traders, when we have the chart, we can draw different indicators and lines, in order to get the trading signals or in other words, to know when to buy and when to sell.
The strategy to get one of the best trading signals that I will share with you now is very simple. What you need to know about the market is that the price has the tendency to trend. In other words, this means that for some period, the price goes upwards or it goes downwards and this is quite normal.
This happens because the majority of the investors at one moment are willing to buy, and on the other, they are willing to sell. Actually, this is just from the coronavirus in 2020. The market crashed. As well, it reflected the Bitcoin. However, it recovered very nicely after that until the moment.
Failure of the recent high is a great day trading signal
It broke the $10,000 just yesterday and I had some really good trading signals and profits which I have recorded for my Cryptocurrency Investment Trading Course. Now, what are the trading signals that I use to buy Bitcoin in this example?
These are counter trend lines. Price forms these highs and lows.
The price forms the highs and lows
The price always moves this way. It moves up and down, up and down, and forms these tops and these lows. Now, when we are in an uptrend or when the majority of the traders and investors are buying and pushing the price higher, we are looking for a failure of the recent high.
This means that we have a high and then the price goes down, goes up, and fails to take the recent high. This is the failure of the recent high and this gives me the opportunity to draw the line which will give me the signal.
Failure of the recent high
On the side, I have the option to draw a line so I can draw a line anywhere I want.
And for this strategy, I need to start from the top and connect it with the recent lower top or, one more time, we call it the failure of the recent high. This gives me a great entry. And I used it. I bought some cryptocurrency the other day and yesterday I made a great profit out of it because the Bitcoin just continued higher.
I don’t pay a single $ for trading signals
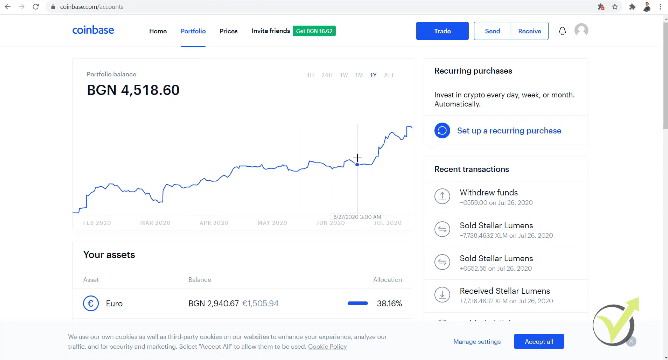
Let’s open one of my trading accounts that I have in Coinbase. If I click on Portfolio, you will see how stable my portfolio goes.
My portfolio portrays stability
And guess what? I don’t pay for trading signals, I do the trading myself with the skills I have and I will share with you some of them.
So yesterday, on the 26th of July, 2020, I withdrew some of the profits. It was €559. And the profits came because I sold Stellar and I sold Chainlink.
I sold Stellar and Chainlink
Just because the Bitcoin did a great move up, I have taken the advantage and I took some profits.
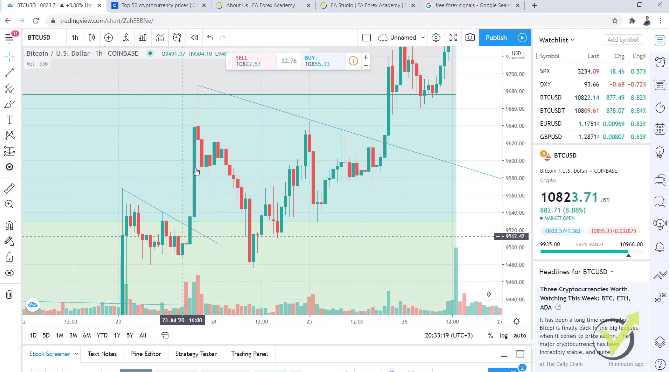
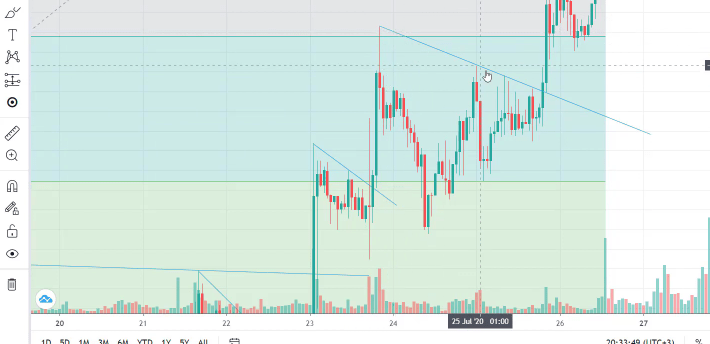
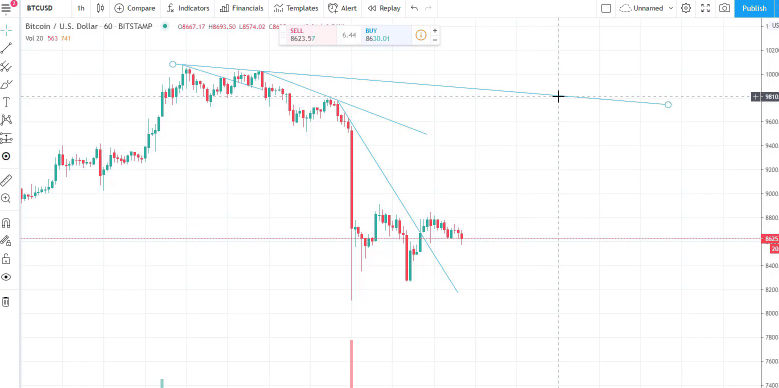
These cryptocurrencies I have bought exactly because of these free trading signals that I’m getting from the chart. And the line we see below is called counter trend line because it’s against the trend. We draw it against the trend. And this is how usually people do it. I do it against the trend and I look for these highs to draw it just in the opposite direction.
The counter trend line
It gives me the great trading signal to get on the market or to buy when the investors or the people that are trading are ready to buy again and they break the line.
Free trading signals are useful when you create them for yourself
I have recorded nearly all of them in my Cryptocurrency Investment Strategy Course and it’s pretty cool because I really don’t spend a lot of time in front of the computer. Just when I have the possibility to draw it, I draw it and then I do nothing, and then I just wait for the price to reach it.
The cool thing here with TradingView is that you have the option to create alert. So, for example, if I’m waiting for the Bitcoin to pass the 10,000, To cross the 10,000 crossing up, I can set it as a value as 10,000. And you will see what options I have – to show pop-up, send email.
So I will get the notification and I will know that the Bitcoin passed the 10,000 and I will get on the computer to buy. Or if I’m at that moment, I know that I want to see the Bitcoin crossing the 9,630 and this is what I had actually as an alert.
And when the price crossed it, I bought immediately and I took some profits. This is a really nice strategy that you can use to trade within the direction of the trend and to get free trading signals from the price itself. We call it price action. I describe this strategy in detail in my Cryptocurrency Investment Strategy Course.
Meta Trader platform
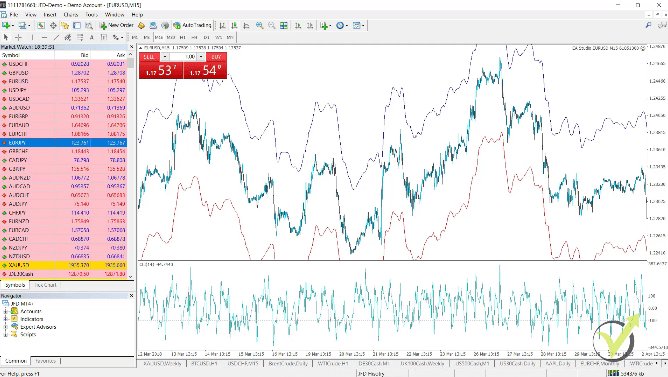
The other way that you can get free Forex trading signals is from the Meta Trader platform. The good thing with this platform is that you can trade automatically with Robots or you can trade manually. I will get to the Robots in a minute. Now, what you see on the chart below are indicators.
All of these indicators give us signals as well.
These indicators give us signals as well
If you are seeing this for the first time, it might look like rocket science but it’s not guys. It’s very easy. I will select the currency pair and on the left side, you can see how many assets I have the chance to choose from.
I have a vast variety of assets to choose from
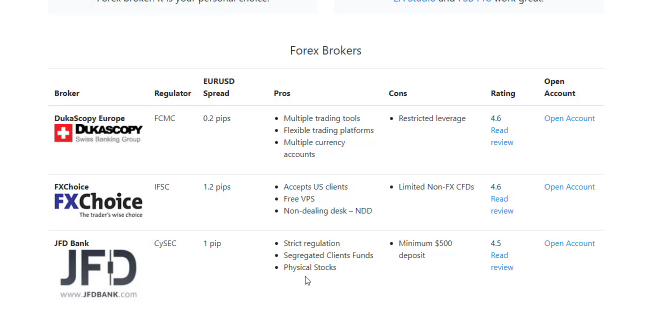
If you want to trade on the Meta Trader platform, you need to select a trading broker. Make sure to select a reliable trading broker. And on our website at EA Forex Academy, we added the Brokers page recently which will be extremely helpful for you if you’re choosing a broker for the first time.
You can learn what is important when you choose a broker and we have listed some of the trusted brokers that we use.
Our Brokers page
We don’t recommend any of them, we just want to make the choice of the beginner traders easier. And we have ratings as well as reviews for each one in detail and you can choose easier which broker to use.
Choosing a Forex broker is essential
There are more tips when choosing a Forex broker. Make sure to check out the page, it’s on the main bar on our website. All of these brokers offer the Meta Trader trading platform. The good thing about it is that it is a free trading platform and it’s the most common one. And guess what? It’s easy to use.
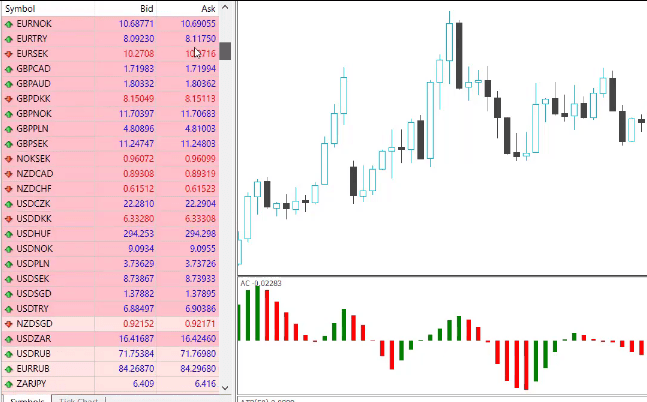
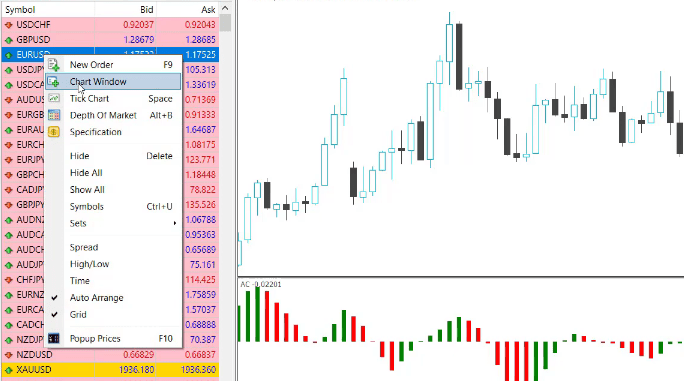
After you select the broker and you install the Meta Trader platform, you have the option to select which symbols you want to trade. Let’s say you want to trade EURUSD. Right-click over it and go to Chart Window.
Right-click over the symbol and go to Chart Window
By default, you will see some indicators over the chart.
I would suggest you remove those because they are just a template from the broker. I will show you some free trading signals using indicators and you will see that it’s really nothing complicated. Below you can see the candlesticks that I showed in TradingView.
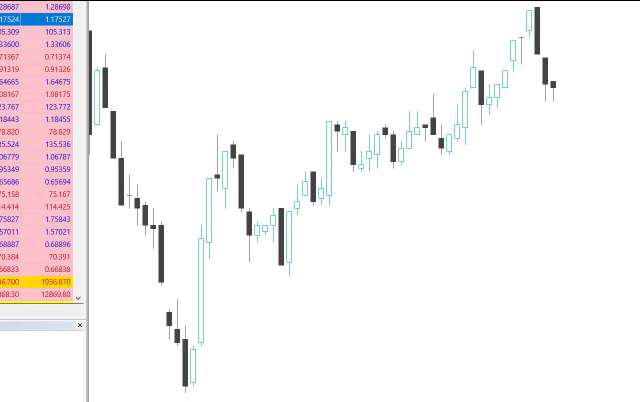
The candlesticks
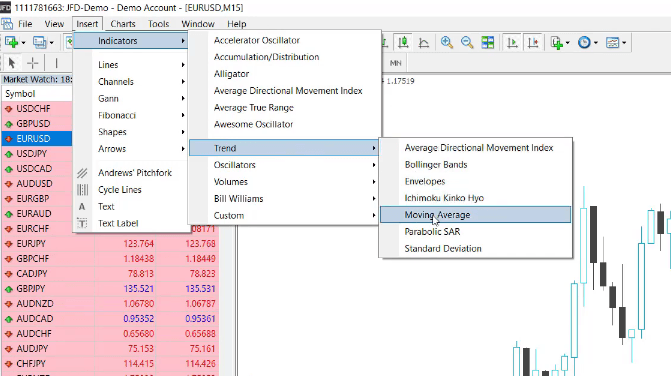
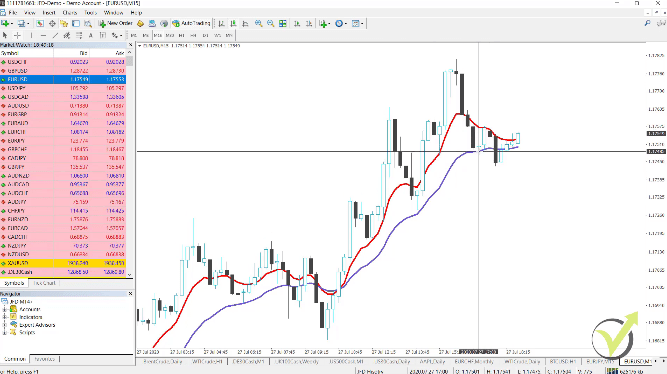
I will switch to M15, which means that each candlestick will be 15 minute period and I will insert some indicators. I will go to trend indicators because as I said, following the trend is very important and I will go to Moving Average.
Moving Average
The different Moving Average methods
There are different Moving Average methods – there is the Exponential, Simple, Smoothed, Weighted. I would stick to Exponential, period of 9 is just fine, and I will click on OK.
What happens is that a line appears over the chart. And Moving Average means that it averages the price of a recent number of bars. In this case, I have selected to use a period of 9. There are dozens of strategies with a single Moving Average indicator and you can use many of these strategies to get free Forex trading signals for yourself.
For example, every time when a candlestick opens or starts above the Moving Average, you buy. If the price is below the Moving Average and it crosses the Moving Average you can buy. If it crosses down again, you can sell it and you will benefit this difference or this distance.
In this case, it’s from 117.06 until 117.36 which is 30 pips of a distance. After that, again the price goes up. After we have a candlestick opening above the Moving Average we can buy, and then when it goes down we can sell. This is quite interesting and quite an easy strategy but it works just when the price is going in one direction.
Difference between fast and slow Moving Average
It really doesn’t work when we are in a sideways market. Only when the price is just going up and down.
In order to avoid wrong trading signals, what you can add is another Moving Average. I will use again Exponential Moving Average but this time I will use period of 21. Let’s change the color to purple so we know which one is the slow Moving Average and we know which one is the fast Moving Average.
Why do we call them fast and slow? Simply, because when we have a smaller period, the Moving Average changes faster together with the price. So if the price changes, the Moving Average changes as well downwards. And it takes a little bit longer for the slower Moving Average to change. However, when these 2 lines cross we have one of the best trading signals.
The fast and slow Moving Average
If you are in front of the computer at this time, they will be live trading signals and you will be able to execute them right away. So the signal to buy would be when the fast Moving Average or the 9 Moving Average crosses the 21 Moving Average upwards.
Free trading signals: no need to pay for the same thing from someone
On the next bar opening, you can take the trade. They cross again much higher and that would bring you a nice profit of between 116.08 until 116.94, nearly 900 pips. Or if I have to be precise, 86 if I’m not wrong with my calculations. Sorry if I am.
I just want to show you the strategy. We have a new cross and another great move upwards and they still didn’t cross. At the current moment, they didn’t touch each other. So having just 2 Moving Averages over the chart will give you great free trading signals.
And whenever you see the cross, you can take advantage of it. However, it is a great idea if you combine it with the bigger trend. What that means is that if you are trading on a smaller timeframe, and I want to go back to the same examples that I showed before, the red Moving Average crosses the purple one downwards.
But what if you sit in front of the computer at that moment and they cross downwards? Are you going to sell? Yes, because they cross on the opposite direction so you will need to sell. But the price goes up and you will be losing.
Use the daily chart to know what the trend is
You will close the trade when they cross again so we will have this loss here which is not a huge one I believe. It’s about 10 to 15 pips. So it’s from 95 up to 06, yes, about 11 pips. But it’s a loss. What I said already is that we want to trade with the bigger trend because the market has a tendency to trend.
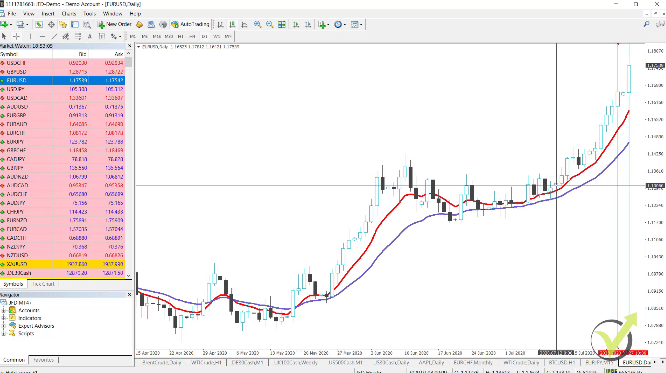
And if I switch to daily chart, you will see that at the current moment we are in an uptrend.
We are in an uptrend
The Moving Averages crossed for EURUSD a while ago. It was on the 19th of May, 2020 and since this time the price goes up. And the price went sideways for a little bit at the beginning of this month and in the end of June.
But now it’s going upwards again and the EUR is much stronger than the USD at the moment, but we are in an uptrend. So always check what is the trend on the daily chart. And you can use again the Moving Averages to see if you have to buy or if you have to sell on the smaller timeframes like M15.
And then use what I show you to buy when the Moving Averages cross. If you sit at that moment and you see the Moving Averages cross downwards, are you going to sell? No, because the major trend on daily shows that the price is going up.
The Expert Advisors will give you free daily Forex trading signals
The red Moving Average is above the purple one. Or the fast Moving Average is above the slow Moving Average. And, of course, you will miss many of these trading signals because you cannot stay in front of the computer all the time.
But guess what? There are Expert Advisors. These are Trading Robots that trade all of these trading signals automatically. Meaning that we don’t need to stay in front of the computer to follow the trend or to follow when the Moving Averages will cross. And that’s really a simple strategy, a very nice one by the way.
You can follow it manually. But obviously, it’s much better if you can do it with Expert Advisors. It’s really not hard. At EA Forex Academy, we’re specialized in Expert Advisors. We teach the traders how to use Expert Advisors or Trading Robots even if they don’t have any previous trading experience.
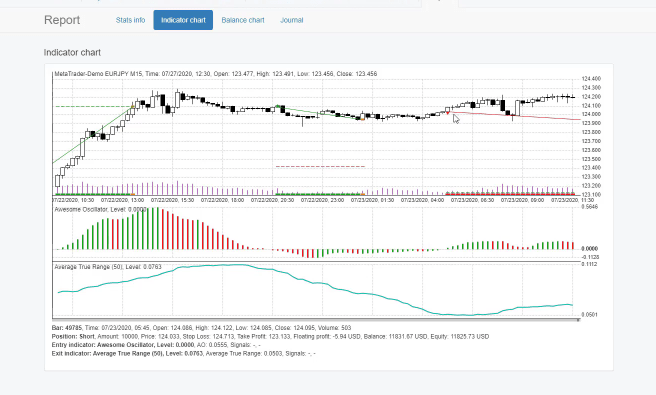
So the Expert Advisors, in simple words, are programs or codes that we attach over the chart. I have one here for EURJPY which is another very simple strategy that I will demonstrate in a second. But when the signals happen, this Robot that is attached over the chart will execute the trade and I don’t do anything.
Learn how we create Robots on our website at the software section
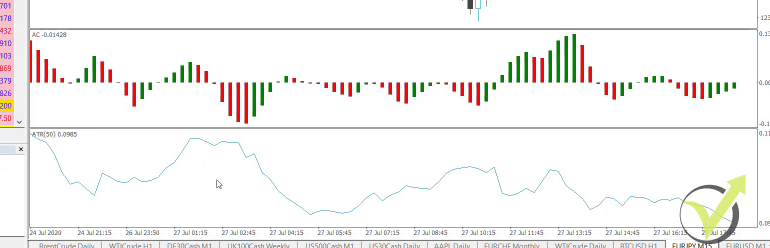
I’m just watching it trading. Now, let me show you what is the strategy that I have with this Trading Robot for EURJPY. I have 2 indicators – one is the Accelerator Oscillator and the other one is the ATR or Average True Range.
The 2 indicators
Probably you are wondering where I get these strategies.
I don’t come up with them by looking at the chart and imagining what will happen or going back over the chart to see what value of the indicators would bring me profit and when I should buy in the future. No. I use software for that. We are in the 21st century and these things are not done by humans anymore.
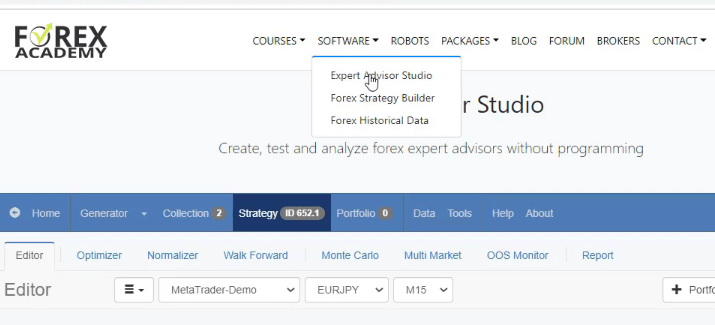
For example, on our website we have 2 software that we use – one is EA Studio, the other one is Forex Strategy Builder. You can find both of them in the software section.
Forex Academy website software section
And there are free courses for each one which will teach you how to use them.
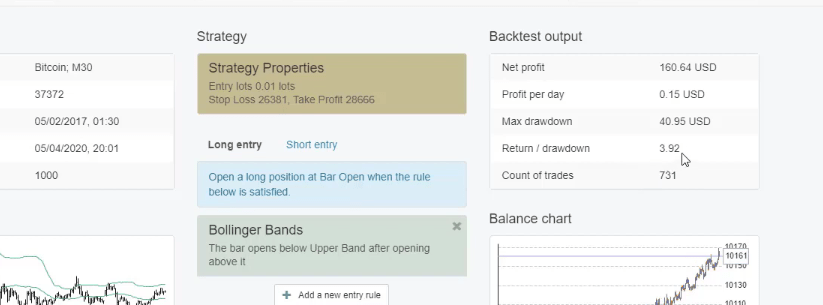
It’s really easy and if you follow the steps you will be able to create strategies and trading signals by yourself as well. Now, the strategy that I have created with EA Studio software uses this Awesome Oscillator as I’ve said, and Average True Range. In other words, the profits that this strategy did.
Every trading strategy will lose sometime and you will always get wrong trading signals. That is normal!
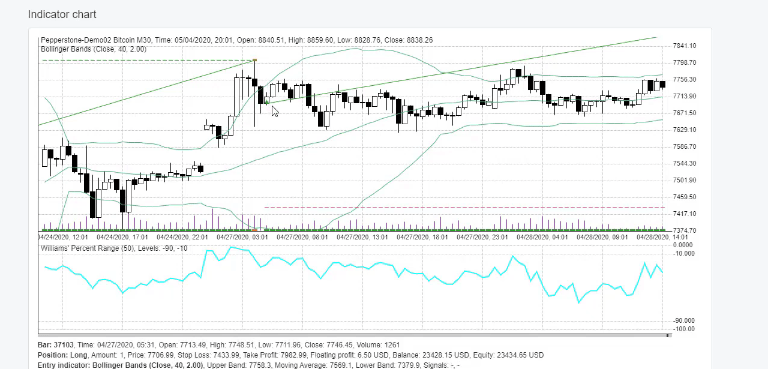
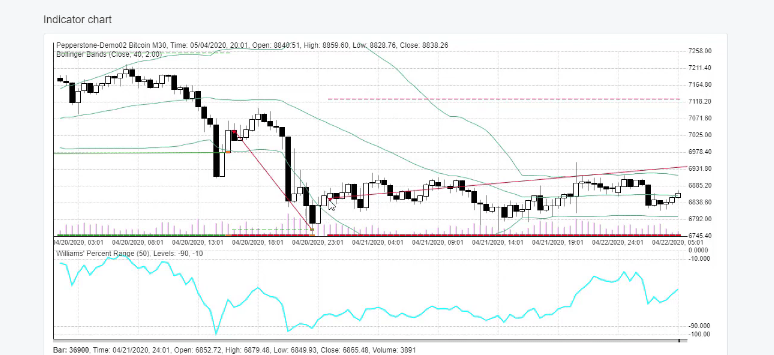
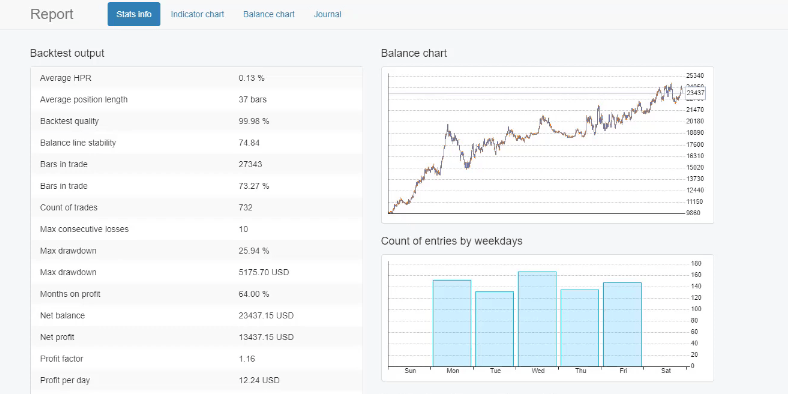
As well, on the indicator chart, I have a great overview of where all trades happened with the strategy, where was the buy trading signal, and where the target was reached. Then what I have, sell signal, the target was reached.
Indicator chart
And, of course, with every trading strategy, there are losses but it is important to have more profits than losses at the end of the day. And to have a good trading signal statistic, you need such software and you need Expert Advisors. Everything else is just a promise from websites that are selling Forex trading signals. Just a promise.
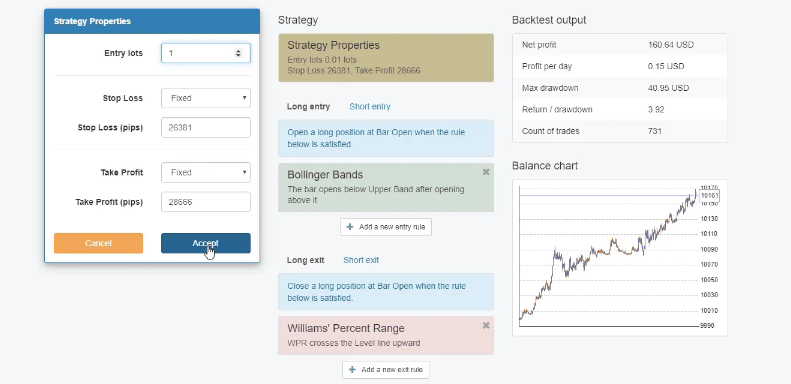
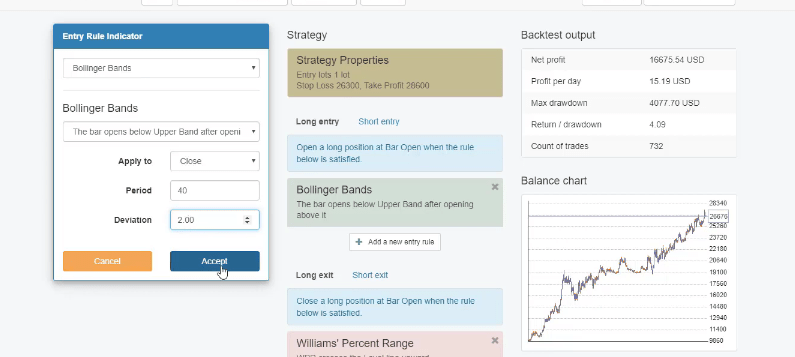
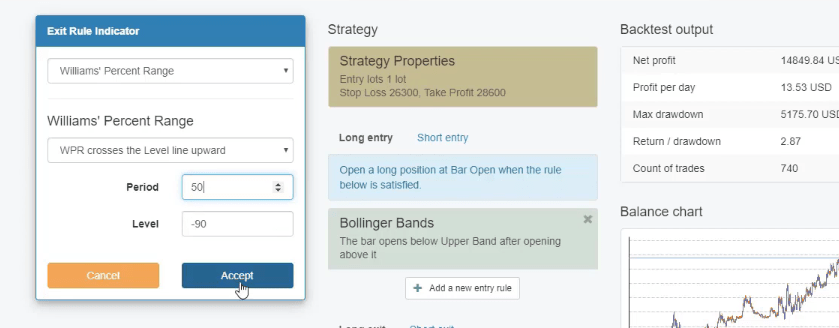
So now let’s see what are the rules for this trading strategy if you want to use it as free Forex trading signals for yourself. It uses the Awesome Oscillator which is an indicator without any levels, it has just 0 line. And the rule is – Awesome Oscillator crosses the level line downwards.
So the bars, when they cross the 0 line downwards we have the buy signal. But in this case, previously we have the cross upwards so it is a sell trading signal. And previously I will show you a buy signal, here it is. It crosses downwards and it’s a buy signal.
The Stop Loss and Take Profit
And we have another one, the Awesome Oscillator crosses downwards and again we have a buy signal. Now, when do we take the profit or when do we close the trade? We do it when the Average True Range indicator crosses the level line downward.
The level line is 0.0763 and the period is 50. How do I know these values? I know it from the software. And the other times when we’re taking the profit is when the strategy reaches its Stop Loss and it’s Take Profit.
That means that we put levels where we want to close the trade if the exit condition is not met until that moment. Stop Loss of 67 and Take Profit of 91. I go back now to the Meta Trader and I will show you some examples.
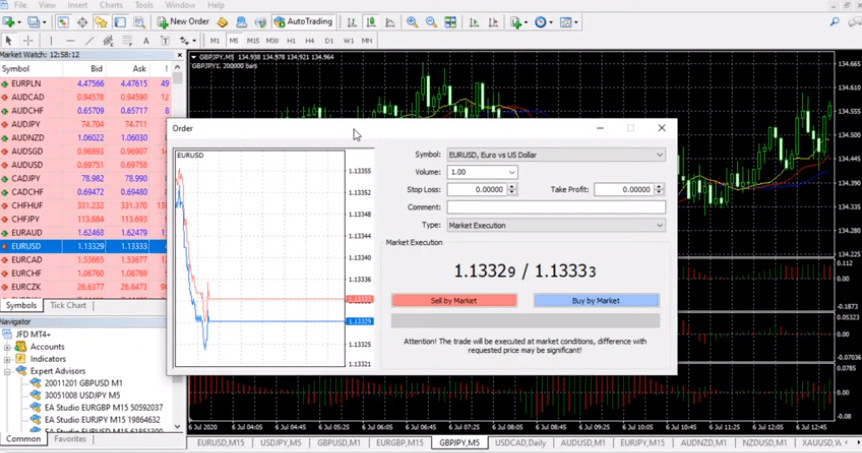
We have too many signals because the Accelerator Oscillator crosses the 0 line many times. When it crosses downwards, we buy. When it crosses upwards, we sell. And we need to put the Stop Loss and the Take Profit which is very easy.
The backtest is very important
If you right-click over the chart and you go to trading, and you select new order, you put the type of order you want to have, you select the price or it could be at the moment buy and sell, and you have the option to put the Stop Loss and the Take Profit. All of that, one more time, we don’t do it manually.
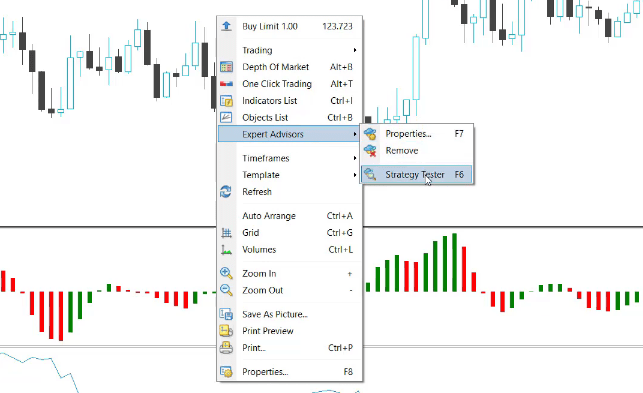
We do it with the Expert Advisors. And they are scanning the market for signals. So anytime when there is a signal, the Expert Advisor will open the trade. And the cool thing with the Expert Advisors or the Robots is that we have the backtest.
With simple words, we can see how the free trading signals did in the past before even using them.
I right-click and go to Expert Advisors, I go to Strategy Tester and let’s test it from the beginning of this year until today.
Strategy Tester
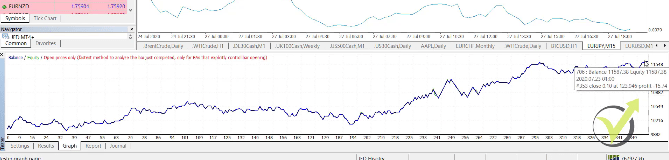
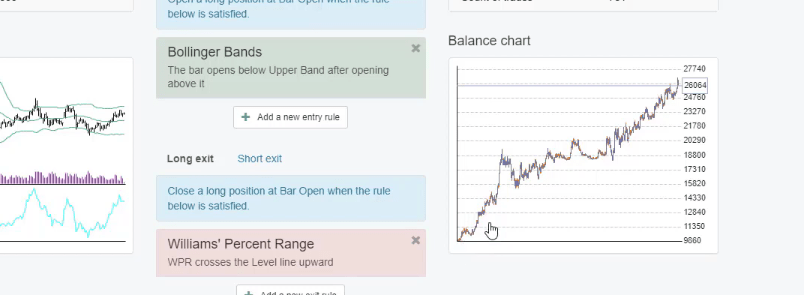
I will click on Start and let’s see what will be the graph. This is a profitable strategy. I can go even for a longer period, let’s go from the beginning of 2019. I will click on Start and I will go to the graph and you can see it below.
The graph
It had many trades. This is 349 trades or 349 above 350 trading signals that formed a positive equity line. Or the overall performance of this strategy is profitable. Even if I go back to 2017, I click on Start, I will go to the graph and it is still going upwards.
Take time to look at the software we use to get trading signals and EAs
It did more than $3,000 of a profit if I’m trading just with 0.1 lot. So all of these strategies that I demonstrated, you can use for yourself to get free Forex trading signals. And especially when you use Expert Advisors and Robots, these are the real live trading signals because you are never late.
When the signal is there, the Expert Advisor will open immediately the trade. When the exit is there, it will close the trade. You will never be late and you don’t have to worry about anything. So give it a try, see how it works. And I would suggest you check the software that we use on the website.
If you are a complete beginner, it’s a good idea to check EA Studio. It’s a little bit easier. I have a free course at the beginning explaining how to use it. There are 15 days free trial which you can use and during this time you will be able to generate many strategies and to test them and to trade with them as long as you want. There is no engagement. This is really the top product on the market.
Do not hesitate to try getting your own trading signals
The easiest way you can go is to use the EA studio. It’s not our software from Forex Academy, it was developed by the Forex Software Company. But we have integrated it on the website so it will be easier for all of my colleagues and traders to use it and to improve constantly their trading.
Thank you guys for reading this lecture about how to create free trading signals for yourself. If you have any questions drop them in the comments below or in our trading Forum.
This article will cover what people think while investing, created by me, Petko Aleksandrov. There is one old theory of how people behave in the markets, especially the beginners. And I modified it last year when I was doing a seminar in Japan. I had 2 seminars – one in Tokyo and another one in Osaka. And I covered a lot about emotions in trading.
It shows very well how people invest in cryptocurrencies and especially in Bitcoin. So I’m pretty sure that you might see yourself somewhere in this lecture because I do see myself when I was starting and putting a lot of emotions in trading.
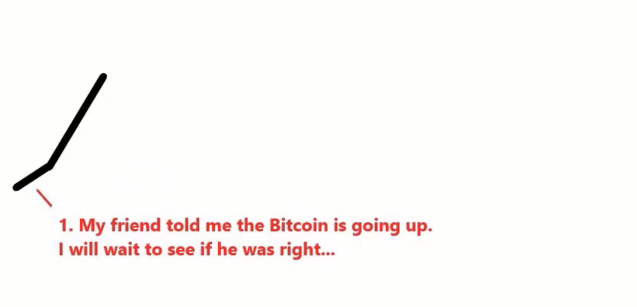
But you should not do that. Let’s get on it and I will attach the presentation as well to this lecture as a resource file. So how it all starts is that usually people receive information.
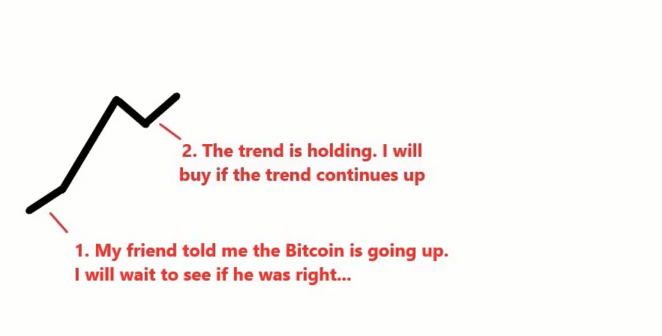
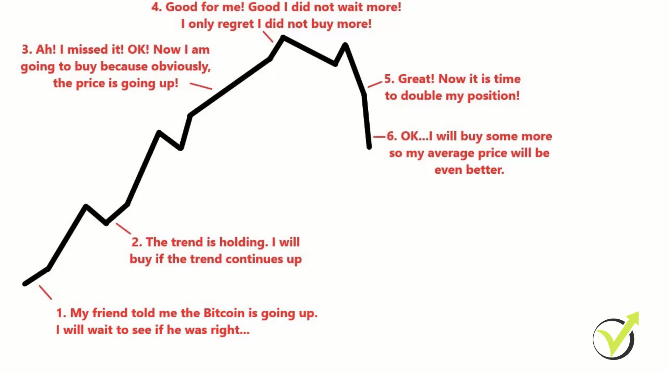
“My friend told me about Bitcoin and how it was going up. “
My friend told me the Bitcoin was going up
This is the first time when you hear about Bitcoin. In the beginning, you are very skeptical and you don’t know what Bitcoin is.
You start reading about it, researching, and you’re not ready to buy just because someone told you that the Bitcoin is going up, for example. So you’re waiting to see what will happen.
The first emotions in trading come when you miss the good price
The price continues higher
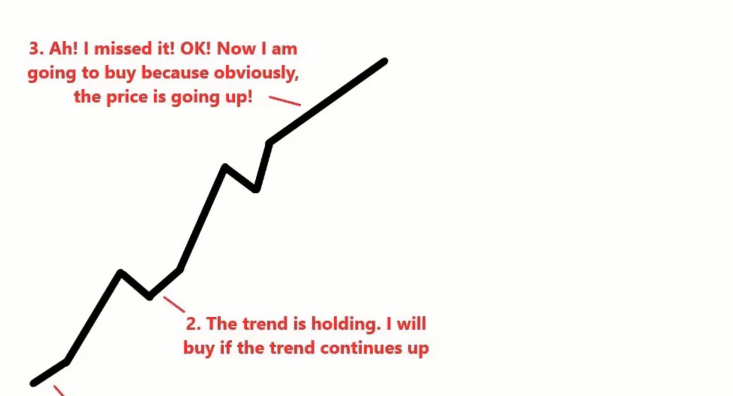
Price goes up, you say, “OK, it’s holding. For sure I’m ready. I’m preparing my account now. If the trend continues higher, I will buy.” Price goes up, “Oh, I missed it. OK, now I will buy because obviously the price is going up. Everybody is buying, I should be buying as well.”
The price goes even higher
So let’s say you buy one Bitcoin. What happens is the price goes higher and you are happy. You already have some profits in your account. You’re experiencing positive emotions in trading.
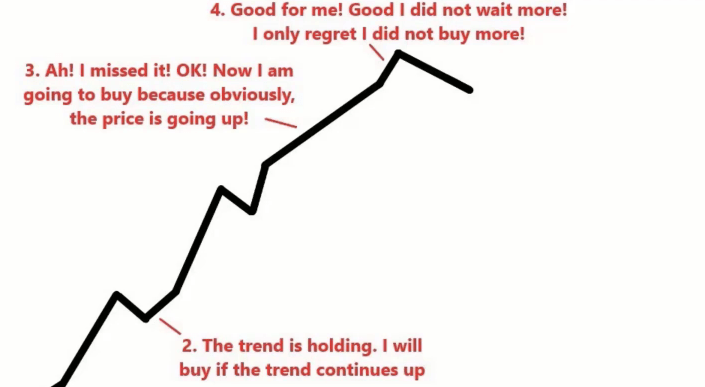
But there is one feeling which is very normal but it’s kind of a strong feeling. You regret that you didn’t buy more when you see a profit.
You regret not buying more
Let’s say that you bought one Bitcoin at $15,000. The price goes up to $19,000 and you’re happy you have $4,000 of a quick profit. This is more than the average salary in most countries around the world.
And you just regret that you didn’t buy more. Regret is not a positive emotion in trading or investing.
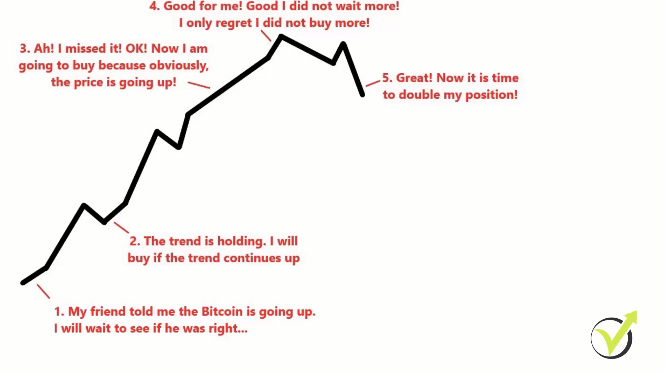
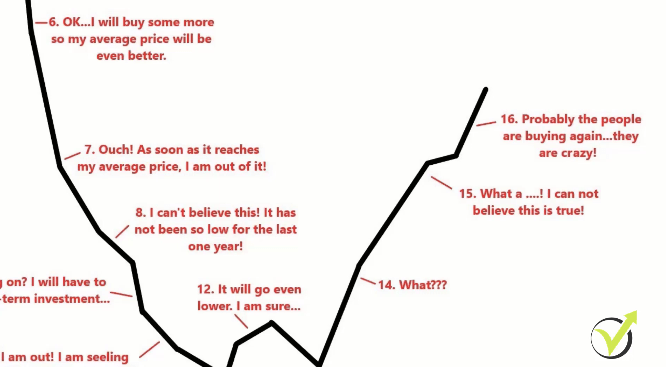
Anyway, what happens is the price goes down and you say, “Great. Now I will double my position, I will buy another Bitcoin. So when the price goes back to $19,000, I will not have just $4,000 but I will have $8,000 of a profit and I will sell it then.”
The price goes down
What drives people to invest all their savings
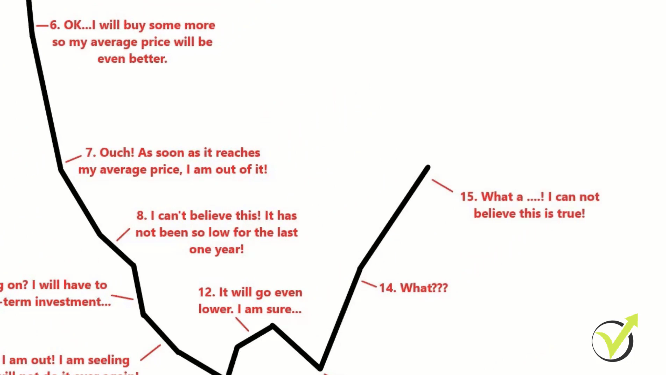
But what happens is the price goes down. You’re getting a little bit frustrated but this is where you start to calculate. You say, “If I buy more now, I will average my position and I will have more profits when the price recovers.” This is usually the point where people put all their money. All their savings.
You decide to buy some more
Everything they had, they will just put it on the market because they want to have a better average price and they want to have more profit from all of that.
The emotions in trading and the emotions while investing will make you take the wrong decisions.
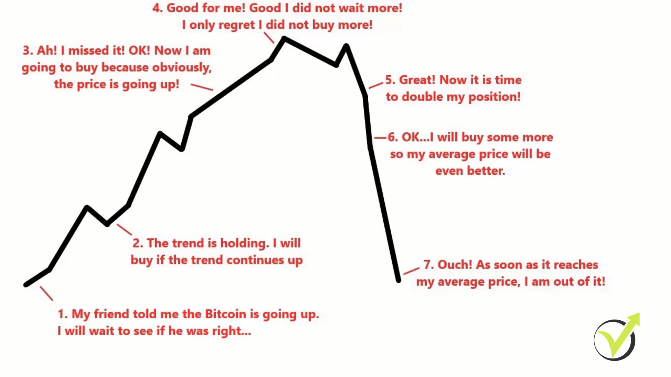
And let’s say you buy another Bitcoin at 12,000. You will have an average price of 14,000. One time 15,000, second time 15,000, one time at 12,042. Divided by 3, average price – 14,000.
But what happens, price goes down.
The price goes lower
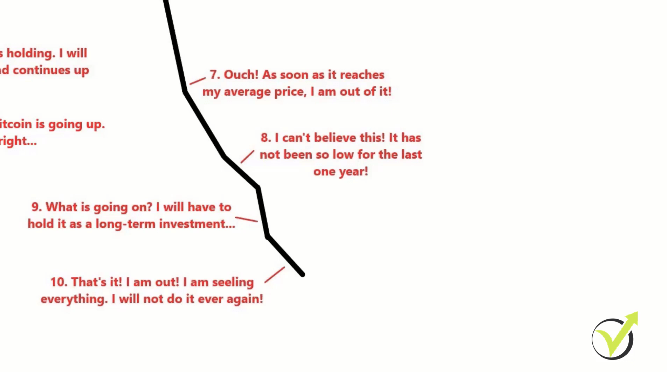
And this is where the people feel pain and just regret it so much and they are afraid. Their only thought is about getting out of it. They don’t think any more about the 19,000. They think about their average price. We set an example of 14,000.
The only thing you will feel at this moment is that you want the price to get to 14,000 so you will sell everything and have 0 losses. You want to get rid of that weight you have on the shoulders, that loss that you see in your account. Because it’s your money, obviously it’s painful and you don’t think about profits anymore. You just want to get rid of it.
People tend to give up drivven by the emotions in trading
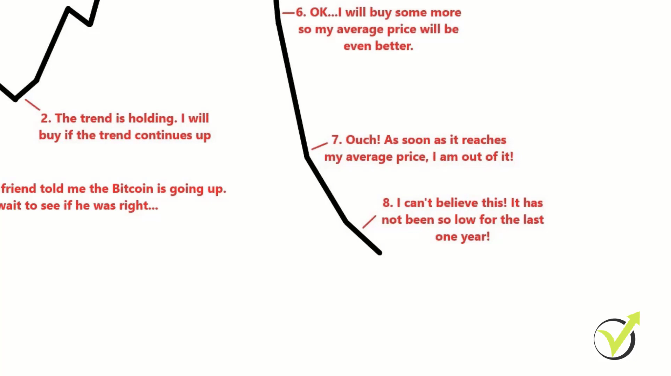
What happens? Price goes down. You cannot believe it, it’s never been so low.
The price goes even lower
The first time you heard about the Bitcoin the price was higher. You never saw the Bitcoin at this price. You never thought it is possible for the price to fall to these levels.
What happens, price goes lower. And you cannot believe it.
You cannot believe it
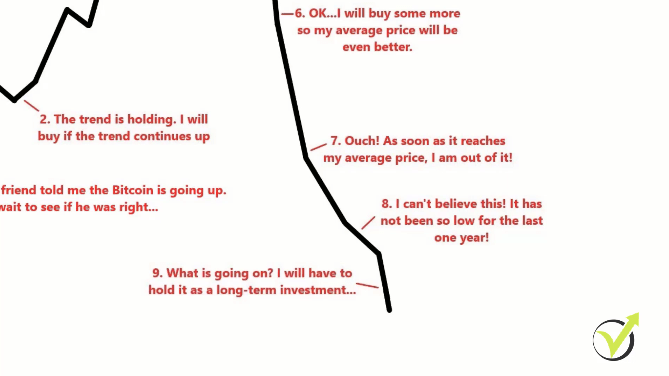
Like what’s going on? You cannot work properly, you cannot handle your daily activities and obligations. And all you’re thinking about is that you’re losing on the market.
And, of course, you’re thinking that probably the price will never recover and you will hold all the losses and you feel awful. This is a horrible moment for the people. The price goes down and you cannot handle it anymore.
Eventually you decide to quit
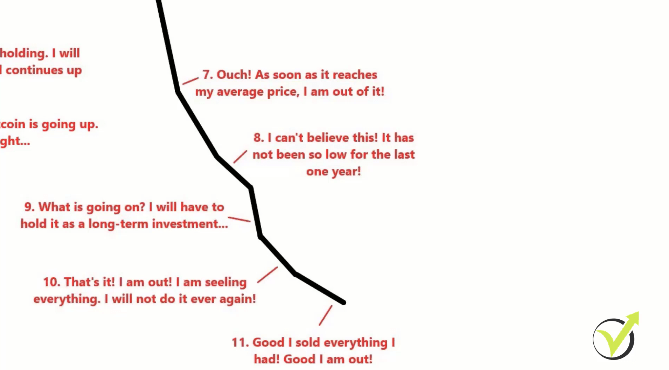
You say, “That’s it, I’m out. I have lost most of my money, I don’t want to lose everything. The price will crash. I am out of it because I cannot.” You are just selling. And all of that from point number 6, 7, 8, 9, and 10, all of these points are called in one word that makes the prices drop as a stone, panic. People panic.
Panic is one of the emotions in trading that drives the people crazy. They just sell and the price drops as a stone.
They sell everything and the price drops
The beginners, everyone that entered on the market for some reason, they want just to be out. They panic that they will lose their money. Nothing is important, they just want to get rid of it and they sell. And all of that selling makes the price drop.
So you are out. You say you will never do it again. You promise your wife and you promise yourself that you will never ever buy cryptocurrency again, whether Bitcoin or any other.
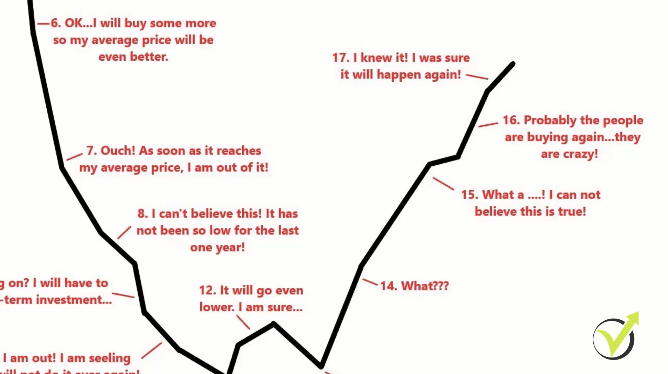
What happens is the price goes even lower and you feel relaxed.
You feel relaxed
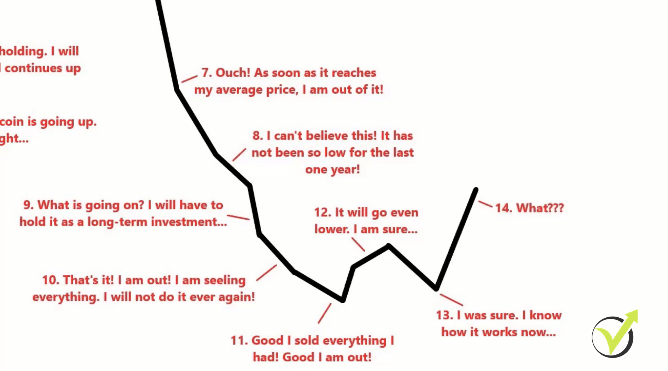
“Good, I sold everything I had. It’s good that I’m out, I could have lost more. I would be at a bigger loss if I didn’t sell so good for me.” There is some recovery and you are sure that the price will drop because obviously it drops so much, it should drop lower.
Price might go sideways a little bit and you’re still sure. “I know I was sure. I know how it works now and I will never do that mistake again.”
What happens? Price goes up and you really cannot understand what’s going on.
The price goes up against your expectation
How come? How come the price is going up after this big fall? Who is buying it? You are not on the market but the emotions while trading are still with you!
Price rises and they start regretting again
The price still goes up.
The price goes higher
You cannot really believe that this is true. The price is higher from where you sold. And you cannot really understand how this is possible. “Really? Who is buying it now? Are the people stupid? Why are they buying it? We lost money.” Everyone lost money. This is what you will think.
Price goes higher and you say, “The people are crazy. I don’t understand why they are buying. For some reason, there are people buying. I don’t understand them. They’re absolutely crazy.”
You don’t understand how the price goes higher
The price goes higher and you say, “Oh my God. I knew that. I knew that this was going to happen. “
You admit knowing this would happen
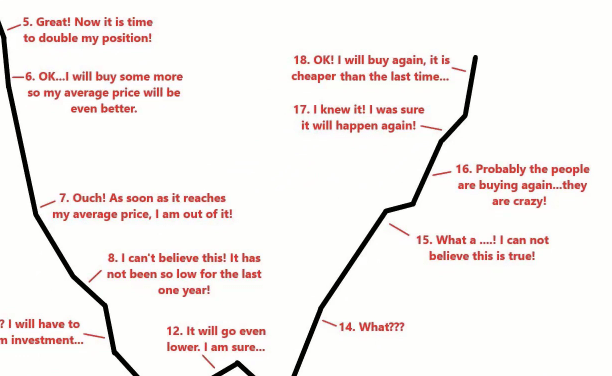
The price is almost at my average price, which I was waiting for for a long time. “Why didn’t I hold my positions? Why didn’t I wait a little bit longer? I sold it at such a bad price.”
Price goes higher and you say, “OK, I will buy again. It is cheaper than the first time I bought and now I have the experience. I know how it’s working and I am again in the game.”
You decide to buy again
And usually people just buy with whatever they saved or with whatever they have left from the previous investments. And this happens all the time, every day.
Emotions in trading are the reason why traders lose
This is how the market works. The price goes up, it goes down, and it goes up again. We never know where it will be tomorrow. But this is how the average person invests in the market. And if you have followed me closely, you will notice that usually, people buy when the price is expensive.
They don’t have the strategy to take their profit. And they are greedy at point number 4 because they didn’t buy more. They are not happy with the profit but they are greedy. And they are awaiting the price to fall so they can buy again. The price falls and they cannot average the position anymore because they have bought with all of their capital.
Nothing is left there because it’s really painful. The only solution is to sell off at one moment. And after the price starts to recover, they don’t have the power, they don’t have the emotions and the mindset to buy again because they took a loss. And they wait until the emotions, the greed and the desire to profit comes again and they buy again when the price is expansive.
So this is how it’s working, guys. I have seen that so many times when I was working for brokers. People coming into the office, I saw their emotions. They were depositing money at the wrong time, they were withdrawing money at the wrong time. And this is what makes the people lose, the emotions. The greed at one moment and the fear on the next moment when you are already losing.
The smart investors do to not put emotions in trading
This gives the opportunity to the huge investors to profit. And they are called smart investors. They are not smarter than you are or than any other beginner trader. They have just more money to hold their positions longer, to average their price all the time, and to take their profit at the right moment.
When everyone else is just entering the market, they are getting out and they make the price drop. This is how it works.
And I will show in the course a precise strategy that I follow, which will protect you from emotions. I don’t put any emotions because I follow the strategies strictly. It doesn’t matter what I feel, if I see the buy signal I buy. If my target is reached, I sell off. It doesn’t matter if the price will go higher, I don’t care.
That was my target, I take my profit. This is how I do it.
Hello traders! Today I will explain the different types of Forex exchanges and how everyone can participate in the market. The Forex market is the biggest one in the world.
It has over $5 billion of daily transactions and everything we do is involved. And, of course, the huge transactions happen with the banks and with the huge institutions that are exchanging really huge amounts every day. For the traders, we can access that via different platforms.
The most common are the trading platforms. This is where we exchange Forex currencies and we speculate on that in order to make profits.
The trading platforms
This is what I show in most of my courses. And there are different methods to do that.
I am specialized in algorithmic trading which for me is the easiest way even for beginners. I travel a lot and at the same time, the Expert Advisors are trading on the Meta Trader platform.
Expert Advisors trading on the Meta Trader platform
Meta Trader platform
For the beginners, this is a platform that is most common especially with Expert Advisors. It is free. Most of the brokers provide it. So one of the ways to participate in the Forex exchange market is via the brokers. They offer us the platforms and then we have the chance to fund an account, for example, a $1,000 account and we can buy different currencies.
The most popular are the cryptocurrencies and I have recorded a couple of courses on the same.
The cryptocurrency courses
We can trade stocks, we can trade futures, or we can trade commodities. Anything that you’ve heard about on the market is available on these platforms. But the Forex exchanges are not just the trading platforms.
Usually, what people do before they go on a vacation, they type on Google “Forex exchanges near me.” What they find is the exchange bureau where they exchange the local currency for the currency that they will need while traveling.
For example, if you are in Europe and you want to visit the United States, you will exchange some EUR for USD before visiting the US so you can have some cash with you. That transaction is Forex exchange. You buy one currency for another.
We don’t trade actual assets
Now, the thing is that when we use the exchange bureaus, the difference between the bid and the ask price is huge. Usually, we lose when we exchange one currency for another on the exchange bureaus or even in the bank.
The Forex exchange rates there are higher and, of course, this is what the bureau or the bank benefits. Same with the trading platforms. This is how the brokers benefit from the difference between the bid and ask price. But with the brokers, the Forex exchange rates are very small, usually a couple of points up to a pip.
How the brokers benefit
So it’s a really huge difference when we are trading online and when we exchange currencies on the exchange bureau or in the bank before going on vacation. Again, the Forex exchange market is really huge. A lot of people participate, companies, banks, traders, investors, and all of these transactions make the markets move.
And we as traders take advantage of that and we benefit when we buy assets. So for the very beginner traders, when we do Forex exchange trading, we usually don’t buy physically the assets. We don’t buy physically the currencies like what we do in the exchange bureau or the bank.
The Expert Advisors is the easiest way to participate on the Forex Exchanges
We just trade on its value and this is called CFD trading, which stands for Contract For Difference.
So if I stick to the same example of EURUSD, if you’re visiting the States and you need some USD which you buy and you sell EUR, on the trading platform if you buy EURUSD, let’s say at the price of 1.1050 and then the price goes to 1.1150, there are these 100 pips of distance which you will benefit.
And, of course, it depends what quantity you buy and how much will be your profit. The other way around, if the price goes down and you close the position, you will have a loss. But, one more time, we don’t buy physically the currencies like we buy them when going on a vacation.
And the good thing here with the Forex exchange trading is that we can sell even if we had not bought previously. For example, we can sell EURUSD at 1.1050, if the price drops to 1.0850, we will benefit 200 pips. This is how we can profit in both directions.
Same thing with Expert Advisors. For the beginner traders, these are the trading Robots. They open trades up and down. They buy and sell. And this way, we can benefit everyday trading on the Forex exchange market using the trading platforms, using Expert Advisors.
Learn to do it before risking any money on the Forex exchanges
This is what I show in my trading courses at Forex Academy. So I hope this post was useful for the beginner traders who are just wondering what are the Forex exchanges and how it works. It’s really nothing complicated. If you are more interested, you can have a look at some of my professional courses.
And, one more time, I would suggest you go trading with Expert Advisors or Robots. This way I visit some beautiful places. Recently, I have been traveling a lot. I will keep recording videos on interesting topics. If you have any ideas about new topics, let me know in the comments below and I will make sure to record a video on the same.
Hello, everyone. In this lecture, I will talk about the Forex account management, which is essentially important while you are trading.
It’s a very common question and I receive it daily from the students and the traders – how much they should start with and how much should be the risk in their account. Now, I don’t want to suggest anybody with starting amounts.
This is a personal choice. It depends on how much you can afford and it depends on how much you want to risk. What I like to say is that you should never be risking more than 10% of your saved money. So let’s say you have $10,000 saved money. You should not open a live account with more than $1.000. That would be a smart Forex Account Management.
And I have covered that in my newest course, The Cryptocurrency Investment, where I teach the same. That when you are investing, again, no more than 10%. And if you are trading at the same time, another 10%. So totally you will be risking 20%.
My suggestion is to diversify the risk on many trades – the best solution for Forex Account Management
Don’t ever put in a real account all your savings, things might go wrong. You might lose it all. So you should stay really safe with no more than 10% of the account. And now when I say 10% of your savings, it doesn’t really mean that you will be risking all of that.
This is how much you should open an account with. So, again, if you have $10,000 saved and you open a live account with $1,000, this is just fine. And from this $1,000 account, you should not risk more than 2-5% for manual trading. Which means 20-50 dollars per day for trading.
Not just a single trade, but I’d also suggest you diversify the risk on many trades. So if you’re trading manually and you have a $1,000 live account and you’re risking 5% maximum, this is $50. And if you have 5 different trades, for each one, the maximum risk should be $10. This means total risk is $50 if all 5 trades go wrong, which usually doesn’t happen.
This is the idea of diversification and this is a good Forex account management. When I cover that in my courses, I teach that you should use different strategies in your trading. So if you have 5 trades, they should be based on 5 different strategies. The chance that all of them go wrong is smaller.
Trading with Expert Advisors is not a bad idea
So, one more time, if you have $10,000, you should open a live account with $1,000, 10% of your savings. And from there, if you’re risking 5% per day, this is the very good Forex account management you can keep. This is $50. Diversify that on 5 different trades based on 5 different strategies and you will have a very small risk of $10 per trade or per strategy.
And here is a video which will show you some realistic trading with many Expert Advisors (Trading Robots).
It is very important because the market is different every day, which means that one strategy will be profitable at one moment and tomorrow it might be losing. But when you have 5 different strategies and you are trading at the same time or you’re trading them simultaneously, well, they will compensate each other.
And this is for manual trading. Now, when it comes to algorithmic trading things are different. With EA Studio, especially what I show in my courses, we have a better risk diversification because we can trade with hundreds of Expert Advisors.
If I stick to the same example of $10,000 saved money, you open a live account with $1,000. How much should you be risking with the Expert Advisors? Again, no more than 5%. And it’s up to you if you want to trade 5, 10, or 100 strategies.
The portfolio Expert Advisors gives you the best Forex account management
With EA Studio we have the chance to create so many Expert Advisors that you could be trading 100 strategies in a portfolio Expert Advisor.
You can create many Expert Advisors with EA Studio
For example, if you go with 0.01 lot, you can do that. In a $1,000 account, I would suggest you have no more than 10 Expert Advisors with 0.1 lot.
Or you might have 100 Expert Advisors with 0.01 lot. That would work fine as well. And quite often I receive the question for the Expert Advisors like how many in one account, for how many currencies. I would suggest you stick to no more than 3 currency pairs and that way it will be less difficult for you to manage it.
And if you use the portfolio Expert Advisor it will be easier.
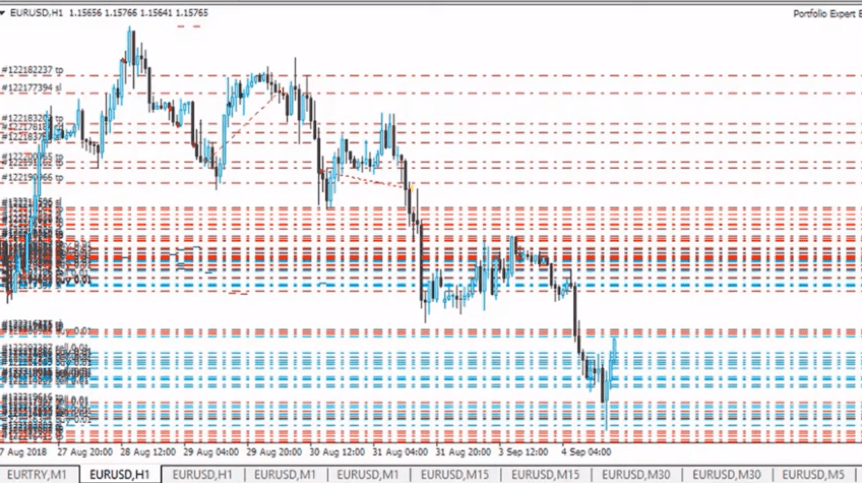
This is why in The Ultimate Forex Trading Package I include 99 Expert Advisors which should be loaded on different charts. But in the portfolio courses, the EURUSD, the 100 EURUSD, the 100 GBPUSD, and the Walk Forward optimization, there I include portfolio Expert Advisors which means that you can add all of them to a single chart and they trade.
I show in the courses how to follow the results.
But what I wanted to say is stick to the same account management. And something very important I would like to say again is when you block $10 from your account, this is the margin, it doesn’t mean you’re risking $10.
Check for the Stop Loss range
The risk is always the Stop Loss. That’s a common mistake by the beginner traders. Usually, what they do is they say, “I will risk today $20.” And they follow the strategy and they don’t calculate the lots, this is what I saw. The proper way is first to see what is the range of the Stop Loss.
For example, in automated trading, I usually use 10 pips to 100 pips. It’s never more than 100 pips so I know where is the risk. But the proper way to do the Forex account management before trading is to calculate how much you will be risking if the price hits your Stop Loss.
When the price hits the Stop Loss, you’re losing. This is the risk. It’s not how much you are blocking from the account. The right way is to calculate the Stop Loss, what is the distance, how much you can afford to trade with, what will be the lot, so you will fit in your account money management. Not the other way around.
Usually people first decide how much they will be risking, and they open the trade, and the Stop Loss turns out to be more than what they expect to lose. So first, calculate the Stop Loss distance, see how much you can trade with, what will be the lot, and fit it in your Forex account management.
Feel free to ask questions
If you have questions, of course, about the Forex account management, the risks, don’t hesitate to drop them in the comments below. I will do my best to answer as soon as possible.
Hello investors. I am writing this article just before the halving of the Bitcoin, we will see what will happen during this halving. And today I have decided to share one more trick about the aggressive counter trend line which you can use before investment in cryptocurrency.
It’s a little bit more advanced technique that I share in my Cryptocurrency Investment Strategy course, but it gives us better opportunities to buy at a cheaper price and to sell at a more expensive price when we are actually selling the Bitcoin.
Now, for the long opportunities when we are buying an asset, the aggressive counter-trend line gives us a better price. And that is very important when we do investment in cryptocurrency. So I will explain to you how that works. I have explained it in some of my courses and I will try to make it as clear as possible.
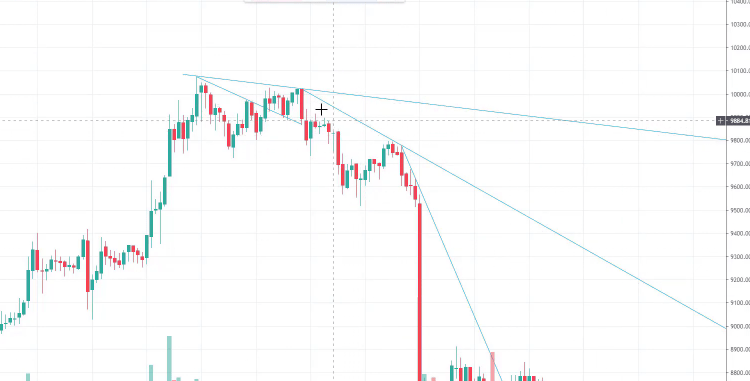
The aggressive counter trend line
We had a huge drop on the 9th of May for some reason. There were a lot of reasons described over the internet, I will not talk about them. It doesn’t really matter, the price dropped and it gives me better opportunities to buy at a cheaper price.
Now, one more counter trend line could be drawn here.
A counter trend line could be drawn here
We have a lower high so we have another counter trend line. Now, what happened, the price fell down and it gives me the chance to draw this aggressive counter trend line.
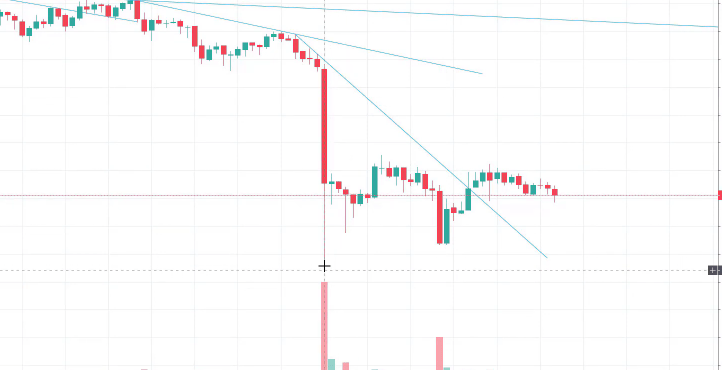
This is how I call it. So I take the last high from where my last counter trend line was drawn and I connect it to the next lower point.
I have the chance to draw another aggressive counter trend line going through the tops of the candlesticks. So the aggressive counter trend line is from the last top, I connect it with the next point.
The lowest point of the drop in Bitcoin
I want the counter trend line or this aggressive counter trend line to be on the top of the price so no price will be breaking it on the point where I’m drawing.
So this is the point where it should be going from. And from there, I take another one which goes through this candlestick and it went through where I actually bought another portion of Tezos because we have a failure of the recent low. This was my next investment in cryptocurrency.
This was the lowest point of this huge drop in the Bitcoin and then the price failed one time.
The lowest point
It was very far at this moment to break the counter trend line so I waited. So we have the failure of the recent low. And the price broke it last night and I took another portion of Tezos and now the price is going just sideways.
This is how I use the aggressive counter trend line and I just want to give you one more example with an aggressive counter trend line so you can understand how exactly I do the investment in cryptocurrency. Let me see some of the previous examples that I demonstrated to you.
The importance of the aggressive counter trend line
And actually there are quite many examples of the aggressive counter trend line but I just want to make it clearer. For example, below is a very good example of a counter trend line because we have a failure of the recent low. And what you can draw is aggressive counter trend line this way.
Drawing an aggressive counter trend line
So we have the counter trend line but from the last top, you can take another line connecting a lower point, a lower top to draw the aggressive counter trend line. And that’s not really a great example, I will try to look for some more.
Basically, the aggressive counter trend line comes useful when we have a huge drop just what we had the last days and we can draw another line which will give us a better entry.
I saw an opportunity while investment in cryptocurrency
So first it will go through the tops and then we can have another one going through the candlesticks.
From this candlestick, we can take another aggressive counter trend line and draw it through either of the tops, depends on where you catch it.
Multiple counter trend lines
I mean if you are at this moment and you have the opportunity to draw such aggressive counter trend lines, you can have a better entry if we have a failure of the recent low. So we have the aggressive counter trend line fails to take the low and we can have the entry right over here.
As the name says, aggressive counter trend line is for the more aggressive investors and traders who are looking to buy the cheaper price. And, one more time, going to the current example, it gave me the opportunity to buy at a much cheaper price.
Bring any question about investment in cryptocurrency you have to my attention
Because if I didn’t have it here and I had this counter trend line and if I wait for the price to reach again these levels, to enter right over here, that is a huge move. And I want this to be profit, not to wait to buy at these levels.
I don’t want to buy at these levels
Otherwise, we will see what happens with the Bitcoin halving.
I am not looking for buying opportunities at the moment because we are still in a downtrend, that’s the most important thing. If I switch to the daily chart, we have still a downtrend. If the price forms a lower high and then a lower low, then we are in a downtrend, and investment in cryptocurrency might take longer.
For any questions about it let me know in the comments below. Make some drawings over the chart, send it to me and I will let you know if that is a good counter trend line or not.
Hello, dear investors, in this article I will show you where I decide to sell or where I decide to take the profit. And this is as important as when to buy and when to get on the market when Bitcoin Invest. It’s also the same thing when we get off when we decide to close the trades.
And, of course, we always aim to do that on a profit not on a loss and this is exactly what I want to teach you in this course. So I will go back just where I started this section and I will look for the lowest low right here, the one shown below.
Lowest low
We had an uptrend here. This is really old historical data from 2013 and 2014. I will take as an example just the recent huge move that we had in 2018 and then I will show you what is present in 2020 and how I applied this method of Bitcoin Invest in taking the profit or selling the cryptocurrencies.
So we had a downtrend in 2014, in 2015 it changed and we had a clear uptrend. For this Bitcoin Invest strategy, I’m using is the Fibonacci retracement. For some people it is an indicator, for others it’s a complete theory.
The fibonacci retracement is what I use in this Bitcoin Invest strategy
It’s a method that is very common but I use it just to show me where is the place and when is the time to sell off and to get out of the market and to take my profit.
So what is the Fibonacci? There are different methods of drawing it. Normally, it should be drawn with the direction of the trend but I draw it just the opposite way and I will show you why.
The fibonacci
So when you grab it from the trading platform or whatever website you’re using for your analysis, you can draw it from one point to another. And what I take is the first move in the uptrend which is the last move of the downtrend.
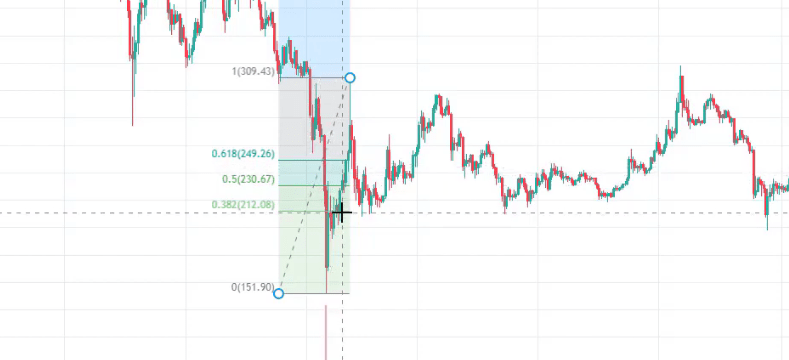
And then you can see that I have this middle zone which has the 50 level, 61.8, and 38.2.
The middle zone
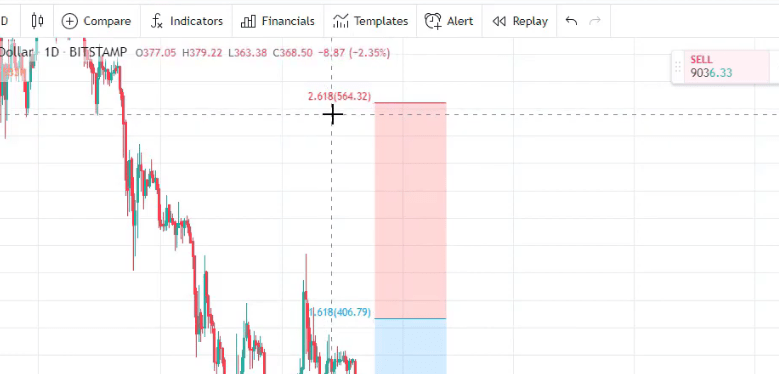
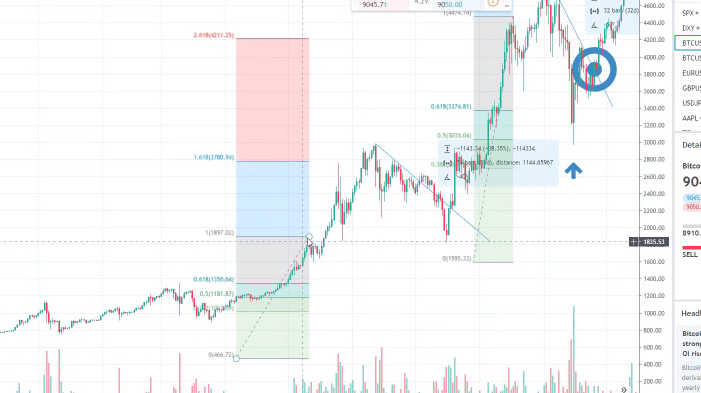
And then I have 2 targets. And this is the thing I’m using, it has a target of 1.61 and 2.61.
The targets
And in brackets, it shows you what is the price.
So I take the first move and as the price continues, I keep drawing the Fibonacci whenever the price reaches the second target. So the next Fibonacci, I can take a new one or just ctrl + C, Ctrl + V the one I have.
I avoid large drawings on the chart
Normally, I don’t draw them so big because it will take a lot of my screen and if I draw different things, it will be too messy. I keep them tiny.
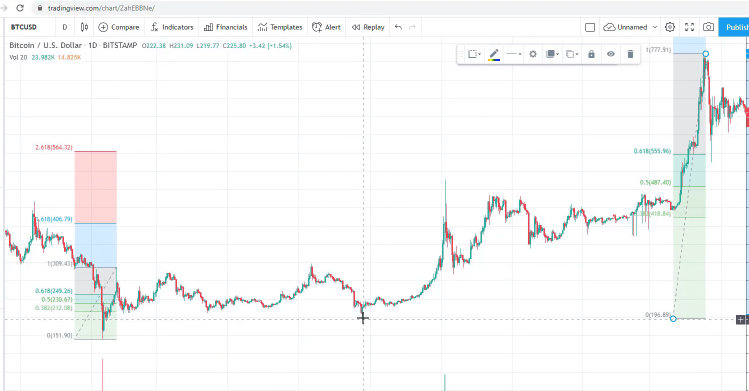
This is just so that it doesn’t take so much of my screen. So, one more time, I take the first move when the price reaches the second target, at this moment I have a huge move. So I take the top of the move and I draw it until the lowest retracement or this is where the price reached lowest from the fibonacci.
The 2nd fibonacci
The price continued higher. We have the first Take Profit which worked perfectly in this case. The price just reached it and dropped down. And then we have the second target.
And where is the end of the move? I think it’s where there is some pullback. So with the next fibonacci I use the other method. Ctrl + C, ctrl + V, and I can drag it a little bit faster from the top until the lowest point as shown below.
You can drag the fibonacci
Zoom your screen to place the Fibonacci precisely for the Bitcoin Invest
Try to make it precisely. I will not do it like very accurately right now because the lecture will get longer if I zoom it every time to put it in the right place. But when you are doing it make sure to zoom and to put it on the right spot.
So, one more time, the price reaches the second target and I take the next high, and then I draw it back to the lowest retracement.
This Bitcoin invest strategy for profits worked perfectly with the first Take Profit or for the first target, and then the second one is nearly at the end of the move. And if you have both, taking the profit at this level would be just fantastic.
And then it might give you new opportunities, there is a nice counter-trendline here, failure of the recent low and then you can re-enter and continue higher. What happened then where the price reached about 4,200 and something? So again I will ctrl + C and Ctrl + V, and I will take it from the next top.
You can copy a previous fibonacci and paste it
It reaches here, the top and the lowest retracement are shown below.
The 3rd fibonacci
The price pulled back so there is the lowest retracement.
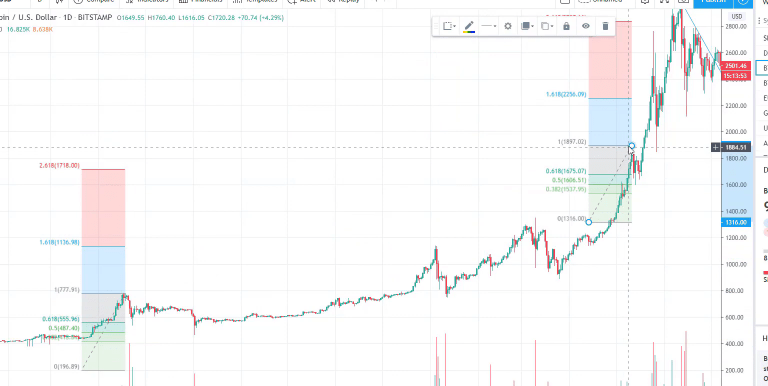
And then there is another retracement that went below that point. And then what happened is we have the new targets and I really hope that you get my point here, how I continue higher. And there is just one more fibonacci that I had in this case.
Let me take another one or as I said, you can copy a previous fibonacci.
The 4th fibonacci
So we have the second Take Profit and we had a top. This is the lowest point. So we had a new top, the price failed, and it was a very negative candlestick.
However, the price continued higher. I guess everyone remembers this time when the people were totally crazy about the Bitcoin. Everybody was buying, even people that never ever participated in the market bought so much Bitcoin. And unfortunately, many people lost after that. They did not use any Bitcoin Invest strategy.
Round numbers matter with the Bitcoin Invest
The first target was reached very successfully but then the second one was not reached. And I remember this time very clearly because I closed some of my trades. I sold some Bitcoin and other cryptocurrencies at the first Take Profit.
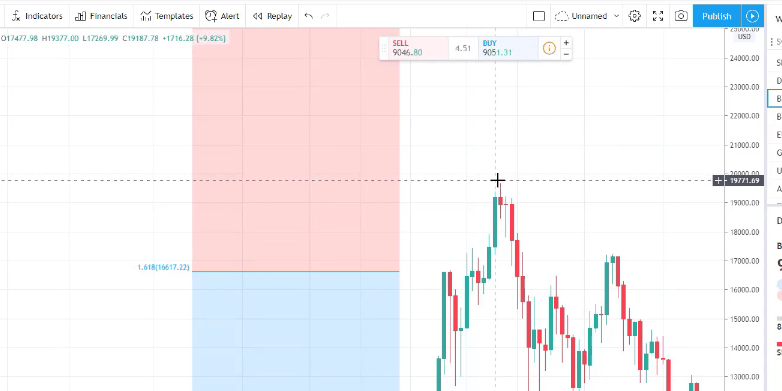
And then the price continued higher but it formed this 1, 2, 3 negative candlesticks and on the 4th one, on the 4th day, which was the 17th of December, I saw that it really becomes negative. And a very important thing happened here at 20,000, this was the round number that the Bitcoin failed to take.
The round number that the Bitcoin failed to take
And since then, it never reached it until this moment. Maybe in the future it will. If you’re watching this course later and it’s above 20,000, well it means that it was broken. And if I go to the 10,000, the first time it broke the 10,000, the 10,000 again is reflected.
It broke but this day failed to close above the 10,000 which was a negative sign but still, it continued higher. And then if I just go back, there are some very important psychological levels like the 3,000. The price failed, and then broke above, then we had at the 5,000.
So keep in mind that whenever there is a round number, it always reflects the price and you need to be really careful. And especially if you see the price failing to take some round number, you should close the trades and you should take your profit.
Don’t risk losing your profit
Take the profit, don’t take the risk to lose your profit. There will be new opportunities. And there were so many new opportunities after that with the Bitcoin. It went down.
And actually, with the downtrend, when the price is very negative as it was in 2018, I use the brokers and the CFD trading where I can actually trade on the opposite direction.
And I do all I’ve shown in the opposite. I draw the fibonacci the opposite way and I draw the counter trendlines the opposite way.
Counter trendline fails to take the high, great opportunities sell. But this I show in my other Bitcoin price action trading course where I’m showing CFD trading and where I show a very similar strategy. But here for the investing course, I wanted to simplify it and to make it easier for everyone.
Now, in the next lecture I want you to do the fibonacci drawing for the period after 2019, starting from here until the top.
Do the fibonacci drawing here
And please share some screenshots so I can see if you have done it properly. Do this assignment, it will be good practice for you. You can post the screenshots in the comments below.
Starting from December 2018 and 2019 until June, the top that we had where the price failed to take the 14,000 which is again a round number. And then we had another negative trend with the Bitcoin, a new positive trend at the end of 2019 and the beginning of 2020.
Coronavirus impact on the Bitcoin Invest
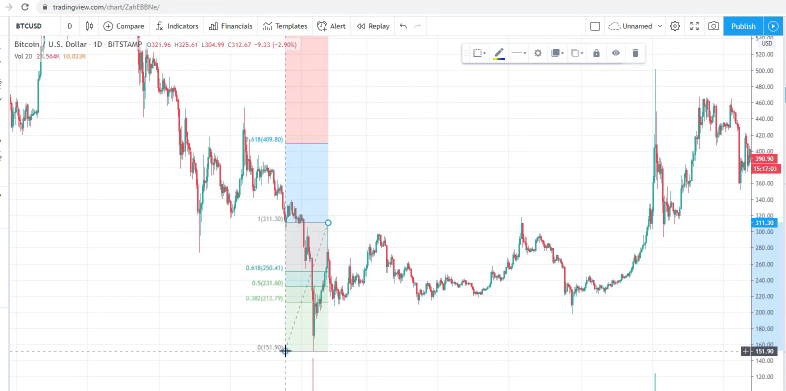
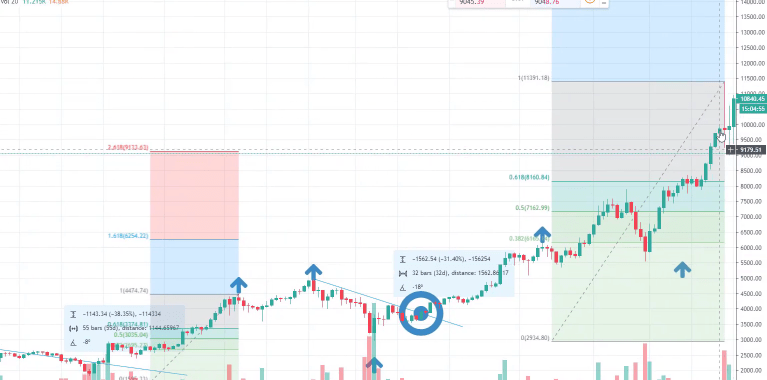
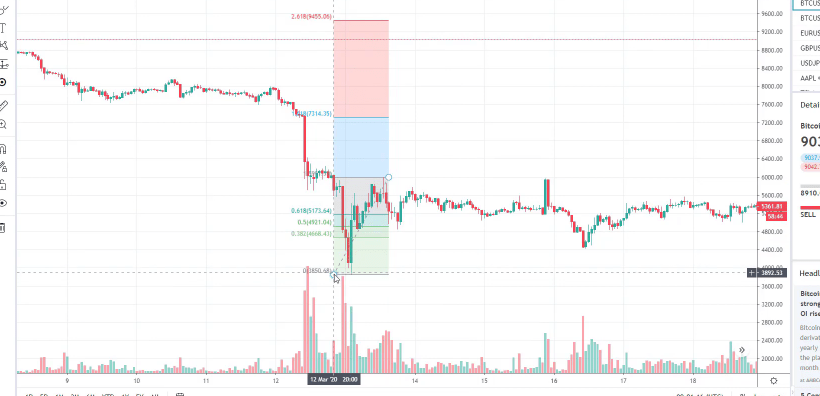
Just play around with the chart, draw counter trendlines, and draw the fibonacci so you will see what were the opportunities with the strategy. And look as well for the failure of the recent low. Now, what I will show you is the recent fibonacci that I had.
This is the crash because of the coronavirus where the stock market crashed, the cryptocurrencies, and a very huge crash for the Bitcoin. In one day, it fell from nearly 8,000 down to 4,800 and something.
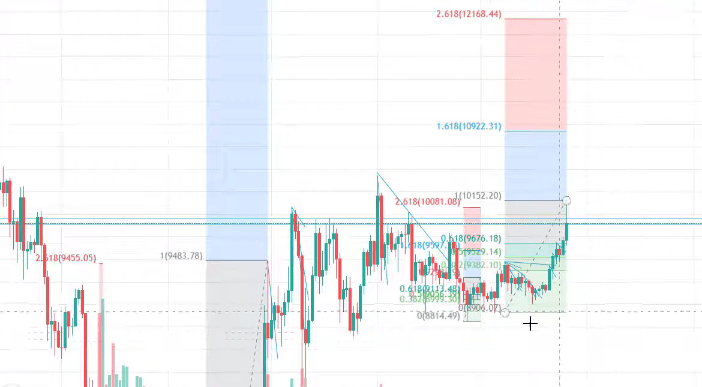
However, after that we had very quickly the uptrend, a series of higher highs and higher lows. And below is my first fibonacci, I will just switch it to hourly chart so you can see it more clearly.
The hourly chart
Where is the first Take Profit? 7,314 and 9,455. So it’s up to you which target you want to use, the first one or the second one.
Work on the assignment for practice purposes
If you want to take your profit faster and you don’t want to hold your positions for a longer time, you can use the first one or you can use the second one. I use them both, sometimes I sell some quantity in here, and sometimes I wait for the next one.
For example, once I waited because it is below 10,000. If the target was just above the 10,000, there will be the 10,000 round number that might stop the price. So I don’t want to take that risk and I will be using the first target.
But in this case, I decided to wait for the second target because it’s below the 10,000 and I will show you that in the next section. Make sure you do the assignment now because it will be useful to you to practice. Share it with me and I will give you always some advice and tips.
Hello, everyone. This is Petko Aleksandrov and today I will be talking about the Forex signals.
I will explain more about them. I will share with you why we are not doing them in the Academy, why I don’t like them, and why I don’t suggest anybody base trading on Forex signals.
The first reason is you are not going to learn anything. When you are using signals, you just receive the signal usually on your phone.
And you execute the trades. For example, they will tell you to buy EURUSD long at a certain price, where to put your Take Profit, where to put your Stop Loss, and that’s it. And if you keep doing that even for years, you’re not going to learn anything.
And we are an Academy. Obviously, we want to teach our students how to become traders and I think we do that really successfully. But if we do signals, that’s really nothing to learn. You will not become a trader from following Forex signals. Secondly, I want you to understand how this industry works.
There is no free Forex signal. There is nothing free in this industry.
If you see free Forex signals, there is something behind it. Either they want to take your e-mail or they want to take your phone. Don’t ever give your phone for not just signals, but anything because they sell this information to the brokers.
Forex signals don’t teach you how to trade
They will not stop calling you, asking you to open the real account. Basically, this is how it works. So there is nothing free. And for the paid Forex signals, I can tell you that their business is just to collect these monthly subscriptions.
So, for example, if you are paying €100 for a monthly subscription for signals, they collect people from different channels and they sell them these Forex signals. So their business is not to teach you how to trade or how to make it profitable.
They just want to collect the monthly subscriptions and they will send you some signals. They don’t care if these signals are good or not. Well, if they succeed to have good signals, probably they will keep you as a client for a couple of months.
But what usually happens is people pay for one month and they give up because there are no profits coming from these Forex signals. And behind the signals stays Expert Advisor.
It’s very easy to automate it nowadays to have an Expert Advisor on the platform and to use it for signals. Basically, it will automatically send the signals to the people.
How do signals work?
So there are no traders behind that signal provider and they use Expert Advisors. Usually, they just buy some Expert Advisor that opens buy and long positions on different assets and they send these signals. Obviously, it might happen that you will make some profits for some days and the others you will lose.
But at the end of the day, you have paid for that. This is what they care about. And quite often we receive e-mails like, “What would be the best Forex signal?” The answer is I don’t know. I’ve never heard about which is the best or any good Forex signals.
I will ask you something. Let say you meet a profitable trader and you ask him, “How did you do that?How are you making profits?” And he answers, “Forex signals, I follow signals.” I’ve never met such a guy for the over 10 years I’ve been doing that.
I’ve never met someone who makes profits constantly following Forex signals.
And I bet you haven’t met one as well just because, one more time, the Forex signals are usually just businesses that aim to benefit from monthly subscriptions. They don’t aim at making people profitable.
Why I prefer trading with Expert Advisors
That’s something very important which gives you the idea that that’s not really the thing you want to do. And as I said, usually, the people and the companies that are doing Forex signals use Expert Advisors to give the signals.
But why would you follow signals if you can trade with Expert Advisors by yourself? Because obviously when you are doing signals, you are always late. It comes to your mobile or in your e-mail, whatever they use. And it will take you seconds or even minutes to enter the trade.
And if they are using Expert Advisor you will be late. This is why I prefer to have Expert Advisors in the Academy and to include them in my courses. Because when you have the Expert Advisors, you are executing the trades at that moment. You are not late and you control it because it is your platform.
It’s not like you are depending on somebody else, you depend on yourself. It’s your responsibility. It’s your control. You have the Expert Advisors and they trade all the time at the right time. When the signal comes from the strategy that is behind the Expert Advisor, you execute it immediately with the Expert Advisor. So you’re not late.
When you subscribe for Forex Signals you will always receive notifications which might be irritating
And the other thing I really don’t like about Forex signals is that they will be bothering you all the time. All the time you will get a beep from your phone. So whether you are having dinner with your family, beep, Forex signal.
Or imagine you are doing that while driving. It might be even more dangerous to follow Forex signals. So having daily signals, you will end up frustrated from the results and from the engagement that you need to be on the phone all the time.
You will realize at one moment that you didn’t learn anything and that you didn’t make profits. And I’m sure that many of you had that bad experience with Forex signals, looking for Forex signal providers and ending up with either losses or just spent a couple of hundreds of dollars on these Forex signal providers without any decent result or constant results.
So I would suggest you really stop looking for Forex signals because it’s not the thing that will bring you profits. It’s not the thing that will make you a profitable trader. As I said, I haven’t met any until the moment. If you are a profitable trader from Forex signals, please share in the comments below.
But I don’t think that would be the reality.
Thanks for reading guys. This was about the Forex signals. Be careful when you are choosing to use signals for your trading because it’s very tricky. There is some agenda behind it. Either they want to take your phone or they want to take your e-mail, and to sell you different stuff.
Bollinger Bands strategy that every trader can use
Hello everyone, today I will talk about a simple strategy that I recently created with Expert Advisor Studio for the Bitcoin. This is a Bollinger Bands strategy, a very simple one.
Just one entry condition and one exit condition with the Williams Percent Range, we have a Stop Loss and a Take Profit. You can see we have a stable balance chart and the statistics for this Bollinger Bands strategy are quite satisfying.
The strategy statistics
Statistic for the Bollinger Bands Strategy:
731 count of trades
return to drawdown ratio 3.92
maximum drawdown of $40
Now, this strategy was created for my Bitcoin trading course where I include 99 Expert Advisors, and today I will describe this strategy for everyone who wants to trade it manually or everyone who wants to trade the strategy automatically with Expert Advisor.
As strategy properties, we have entry lot set to 0.01 which is the lowest risk so I will increase it to 1 lot or this is one complete Bitcoin. This way you will see what results you can achieve with this strategy if you are trading a complete Bitcoin.
Strategy properties
What are the Over-optimized strategies
Our balance chart shows very well that the backtest of this Bollinger Bands strategy shows profit of over $16,000 because the account started at $10,000.
The balance chart
As well, as a Stop Loss and as a Take Profit we have $263.81 and $286.66.
What I prefer to do is to round the numbers and I will do this for the Stop Loss and for the Take Profit. There is no huge difference in the balance chart which shows that this Bollinger Bands strategy is not over-optimized.
For the beginner traders, over-optimized strategies are those that have perfect parameters for the Stop Loss, the Take Profit, the entry rules and the exit rules, so it will show a great balance chart.
We avoid trading over-optimized strategies because usually what happens with these strategies is after we place them for testing or real trading, they start to lose.
Now, the Bollinger Bands use this period of 39 and deviation of 2.03, I will increase it to 40 so it will be a round number and I will decrease the deviation to 2, round number and I will see what are the results.
Entry rule indicator
Again, not a huge difference on the balance chart but I used round numbers.
Having round numbers in this Bollinger Bands strategy will make it easier to remember for everyone who uses this strategy for manual trading. For those of you who want to use this strategy as an Expert Advisor, it will work faster because simply, the calculations will be easier and faster.
Difference between the long trade and the short trade in the Bollinger bands strategy
The period of the Williams Percent Range is 47, I will round it to 50.
Exit rule indicator
And again, the balance chart remains stable showing upwards. Now, the rules for this Bollinger Bands strategies are that for the Bollinger Bands, we want to see the bar open below the upper band after opening above it.
And I will demonstrate this over the chart. For the long trade, we want to see a bar that opens below the upper band after opening above it and below we have a great example.
Example of a long trade
The price is going upwards and the Bollinger Band usually opens its bands when there is volatility.
The price went over the upper band and when it went inside on the first bar opening we have the entry condition. After that, the price continued higher and we have the Take Profit hit.
For the short trade we have the very opposite thing.
Example of a short trade
When the price is below the lower band and it gets into the bands on the first bar that opens above the band, we have the sell trade. In this case, this trade went on a loss but not such a big loss.
The indicator chart ilustrates the BB strategy
The Stop Loss was not hit. We have the exit condition which is with the Williams Percent Range.
To make it clear, for this Bollinger Bands strategy, the exit condition is when the Williams Percent Range crosses the level line upwards, this is for the long trade. And for the short trade, we have the Williams Percent Range crosses the level line downwards.
Now, with EA Studio strategy builder we have a great indicator chart where we can see really clearly where the trades were opened and closed. And this way the traders understand how the indicators work and what they can improve in their strategies.
We don’t see such a backtest on the Meta Trader and it is much more visual to see where exactly the trades were opened and closed not only with this Bollinger Bands strategy but with every other strategy that we use with Expert Advisor Studio.
This is a great, simple strategy for the Bitcoin which I am trading on M30 chart and the great thing with Expert Advisor Studio is that we can export the strategy as Expert Advisor for Meta Trader 4 and for Meta Trader 5.
You don’t need to code the Bollinger Bands strategy
One click, I have the ready code of the Expert Advisor and I don’t need to code the strategy by myself or to hire developers to write the code for me.
The code of the strategy
As well, this Bollinger Band strategy is very optimized according to the coding and there are no mistakes. If I click on Compile, there are 0 errors, 0 warnings, and it works brilliantly.
Very quickly, the Expert Advisor is ready for trading on Meta Trader. And for me, it is much easier to trade these strategies automatically with Expert Advisors on Meta Trader because I don’t want to sit in front of the computer following all the entry and exit conditions.
Of course, I can do it but not more than 3 to 4 strategies at the same time and we cannot trade as human beings all the time 24 hours, we will miss a lot of trades. And this is how many traders say some strategies are profitable, some strategies are not.
But if they are trading the strategies just 8 hours per day, they are missing the rest 16 hours for the strategy.
You can trade a strategy for 24 hours using Expert Advisors
Using Expert Advisors, we can trade such strategies just like this Bollinger Band strategy for 24 hours from Monday until Friday and even Saturday and Sunday when the cryptocurrency market is open. Many brokers offer trading during the weekend.
The best thing is to test this strategy with your broker. What you can do is to build a strategy in EA Studio by adding the entry and the exit conditions. Just select the Bollinger Bands from the list, select the rules.
One more time, for this Bollinger Bands strategy.
Entry condition: the bar opens below the upper band after opening above it, a period of 40, deviation of 2.
exit condition: the Williams Percent Range crosses the level line upwards, a period of 50, level -90
Stop Loss, $263, Take Profit, $286.
It’s a very simple strategy to create and automate with Expert Advisor Studio so it is up to you if you want to trade this strategy manually or you prefer to trade with Robot or Expert Advisor. And in the end, I will show you the statistics of this strategy.
If I go to Report and I click on Statistic information, there are detailed statistics from the backtest output. We have $12.24 profit per day, 2.6 return to drawdown ratio, and as Profit factor, we have 1.16.
Stats info
The Profit factor is very important for every trading strategy
Considering that the Profit factor is calculated from the gross profits divided by the gross losses, any trading strategy that has Profit factor above 1 works great. In addition, as statistic, we have the count of entries by weekdays, so you can see it’s a balanced strategy.
This strategy has most profit on Mondays and we have the profit and loss in currency by entry hour, profit and loss in currency by exit hour.
Additional stats info
What does this mean? When the BB strategy is trading and I’m looking for the strategies that are balanced, not related to any trading hours. And we can see relatively similar profits during the days.
You can notice in which hours the Bollinger Bands strategy has losses and you can pause the strategy during these hours with some strategies. Personally, I prefer to trade all these strategies all the time, and this way I don’t put any manual work.
Important thing is that when we do Expert Advisors and algorithmic trading, we don’t put any emotions into it because we leave it to the Expert Advisor to execute such strategies as this Bollinger Band strategy.
We don’t close the trades manually, we don’t open the trades manually, we don’t pause the Expert Advisors, and this way you can achieve more stable results. Feelings and emotions are the reason why 95% of the traders, or even more, are losing money daily on the market, on the Forex market, on the cryptocurrency market, and on the stock market.
If you want to create that strategy, it’s very easy. Just open EA Studio, if you haven’t used it there is a free trial which you can use for 15 days.
There is a free course that I recorded recently which you can watch to learn how to use the software better,
then go to Strategy and build in the indicators that are within this Bollinger Bands strategy.
You don’t need to have any trading or programming experience to do that. As well, you can import the historical data from your broker and if you don’t know how to do it, I have a video on YouTube which will help you do that.
If you have any questions, don’t hesitate to drop them in our trading forum. We have many experienced traders there who will share their experience and you are very welcome as well to share your experience with them.