Hello, everyone, I continue on the 11th of November 2020 with an example of cryptocurrency portfolio tracking from my account. Below you can see what is my current setup after the last video where I showed you 3 entries.
The 3 entries
And then what I had are another 3 entries.
The other 3 entries
Now we’ll see if the price will push through the 16 000 so it did a push by the byers failed and then the price pulled back.
Following The Aggressive Counter Trendlines
And this gave me the opportunity to draw these more aggressive Counter Trendlines that we had and every time I had my set up to buy. So if I zoom out, you will see below where the Bitcoin is after that impulsive move. And I consider that as a bullish formation. It’s a kind of a flag. Here are the poll and the flag.
The poll and the flag
And that’s usually considered to be a continuation pattern.
If the market is bullish and we have such a flag, the expectation is that the price will go higher. And as I’ve mentioned, I guess in the previous video or on some of my videos that I recorded recently because I did a lot of videos about Bitcoin, I did some live videos for Facebook, YouTube, and I think I mentioned in the previous video that what we noticed in October, November 2020 is that actually more money flow into Bitcoin and not so much into the other Cryptocurrencies because of the US elections one and because of the second wave of the coronavirus lockdown.
My Cryptocurrency Portfolio Tracking
The markets were quite unstable. The investors looked for more secured assets. I said that for the Forex market, this is the YEN currency and for the Cryptocurrencies, this is obviously the Bitcoin. So a lot of movement on the Bitcoin and not so much on the other Cryptos. But still, there’s gave me a good opportunity to buy some cheap Cryptocurrencies and with the last video, I shared with you that I have bought the DNT.
What I bought as well was the Civic, it did another great move. And if I open my sheet, you will see that I have sold those with 150% profit for the DNT and for the Civic I took 92% of a profit.
My sales sheet
And I just marked them with the strikethrough above them because they are not anymore in my cryptocurrency portfolio tracking. So what happened? I bought one more time the DNT at 0.068.
And then I bought the Civic at 0.967. Where have I sold it? I’ve sold the Civic at 0.19 and I have sold DNT at 0.114 that brought me a pure profit of 1781.95 for the DNT and for the Civic profit of 553 EUR. And by these profits, I achieved 160% profit for the whole portfolio that I have for the whole account. So let me tell you how exactly I have bought these and where I sold them, why I sold them, and why I didn’t keep them.
As I have mentioned in the previous video, I might keep them longer, but I will show you what I noticed and how I decided to approach it through that. So here is my cryptocurrency portfolio tracking at the moment.
My portfolio
You can see these profits over because of the DNT and the Civic.
And then there is this drop. But this is because I have sent my Chainlink to a wallet. I did not want to keep it all in the Coinbase account.
So this is why there is this drop. So imagine this is the cryptocurrency portfolio tracking. Let me just go to weekly, then we have the portfolio. From this moment is just sideways after I have sold the Civic and I have sold the DNT. So let me go through these assets very quickly and I will show you why I sold them. You saw why I bought them.
I wish to buy at a cheaper price
I noticed them in the top gainers and why did I sell them? Let’s go to the DNT. Actually, I sold it at almost the best possible price. Here it is. So you see, this was the first push.
The DNT
I bought it somewhere here in the cheap one time. Then another time that it pulled back a bit and then it pushed again after I sold this failure right over here of the high.
You can notice how the price went here
It makes a series of higher highs and higher lows. It’s an uptrend. What happens here? Downtrend on the monthly chart. It’s very visual. It’s different from this formation and it’s different here. If you compare the two of them, it’s quite different and I will remove the mouse, focus on this part and focus on this part. It’s different, right?
It’s a visual downtrend because the price failed at that moment to take the high. Once I saw the lower low, this low is lower than that one. And then when the price failed to take this high, then I said, I’m selling it. And I sold it at 0.1150 I think. Let me check again. 0.1140 exactly at that moment, just after the price failed to take this high, I said, the volatility is gone. I don’t want to stay anymore. Let me look for opportunities to buy cheaper.
I took an amazing profit. It’s not on the top. We cannot sell on the top, guys, because obviously, we don’t know at that moment if this will be the top. It’s still bullish. I want to stay in, but at the moment I see a downtrend forming on the monthly or the weekly. It’s a little bit harder on the weekly because we have many highs and many lows.
The downtrend in cryptocurrency portfolio tracking
But on the monthly, I just get out and take my profit. Same thing with the Civic. Let me show it to you. So I took the Civic a little bit later. It was quite volatile and I did all of this honestly at about 1:00, 2:00 p.m., just after the New York Stock Exchange closes. I notice huge volatility with these top gainers at the moment. And obviously, I didn’t want to record any videos and I took as well the Civic.
So let me show it to you on quite a good trade here as well.
The Civic
So another impulsive break. And again, when the downtrend was formed on the Monthly, I sold it. Same thing with the DNT. I noticed this move in the top gainers. It was most of the time, basically, the DNT. was on the top, then civic below, and they switched a few times. The focus was on these two.
And then when the price formed here, this downtrend, actually, I think I sold it at about not that here, but a little bit lower. I think it was at 19. I didn’t really take the best price because it happened early in the morning. That fall here, this one happened early in the morning and honestly, I was tired at this moment. I stayed a few nights until 2, 3 so I can’t really wake up at 6:00 as I usually do.
So I’ve missed my cryptocurrency portfolio tracking a little bit
Then I saw that the price failed again to take the high. So let me see it on weekly. It will be more visual. You see this fail and then the price formed a lower low than that one. And that’s what I consider as a downtrend, as you know, and I sold that.
The downtrend
Still a great profit with the Civic. So these 3 trades pushed my portfolio balance above 17 000 Bulgarian Lev, or this is about 8 500 EUR.
There’s uncertainty in the market at the moment
And since the beginning, I can tell you that I have invested. And if you are following the lectures very strictly and accurately, I have invested exactly 3 000. Actually, it’s in my sheet on the first page. The initial investment, 3 341 EUR. And you notice that I didn’t put them at once in my account. I was just buying 1 Crypto after another, after another after another, demonstrating the system to you, guys.
And after the recent trades, I did over 150% profit, or actually, it was 160 at the moment when I sent the Chainlink to my wallet. Right over here.
When I sent the Chainlink to my wallet
But now is just a little bit sideways, I think even the profit a little bit. So from this point, after that, there is a profit going up and I will see how it’s going. So this is where I am at the moment, I usually avoid to hope what will happen, but it looks like a bullish formation.
That’s not a reversal formation
I think the Bitcoin will push higher above 16 000. Don’t take it as a suggestion to buy or anything. I’m never giving advice, guys. I’m saying how I see the market and I’m telling it that this pattern here, the flag that we have is a bullish formation. It’s not a reversal formation. It happens, but rarely. More often, after such formation, there’s a movement upwards and not just the technical analysis I’m showing you right now, but as I’ve said, the market is quite uncertain at the moment.
And I think the investors are looking more into Bitcoin to secure their money into, you know, the most popular Cryptocurrency out there. Still, I’m not buying Bitcoins because the smaller Cryptos do better. The proof with the last sheet, 150%, 92%. And this happened just in 2-3 days. And what I’ve bought just with the last 3 entries Link, Ethereum, and Tezos with the last 3 entries. This is what I’m looking at at the moment.
The 2 options I have in my cryptocurrency portfolio tracking
The next target with the Bitcoin is at 18 790, which I cannot say whether it is reachable or not. Well, the 16 000 looked impossible back in time when we were down here at 14 000 when I had this new Fibonacci.
The new Fibonacci
But then look what happened. It’s possible to happen. I’m not saying it will happen. I’m not saying it will not happen. I don’t care if the price goes down, I will buy some more Cryptos, and now I can afford that.
Actually, something I almost forgot, when my cryptocurrency portfolio tracking reached 6 000 if you remember what I did, I said, now I will be entering 10 times with 600 EUR each piece. Now, since my cryptocurrency portfolio tracking is above 8 000, I have 2 options. One is I can increase the entry to 800 or I can allow myself more entries. And for the moment I will stick to option number 2. In my EUR wallet, I have 2 300 left.
The new profits in my cryptocurrency portfolio tracking
Basically, these are the new profits that I did and even I already have 10 entries. I have room for another 3, almost 4. I mean, 4 times to buy with 600 EUR each. So it’s up to you how you want to proceed. Actually, there are 3 options. You can withdraw your profit if you need it. I don’t need it at the moment. So I’d prefer to keep it in my EUR wallet because as I’ve said, this way we will pay a smaller fee every time we buy, not using my Visa card.
So that is what I would prefer to do at the moment. And I’m just giving you the different options. So, one, you can withdraw your profits, two, you can increase your entry. But if you want to stick to 10 and you already have 10 and you have profits, then the better thing is number 2, just increase the number of entries if they are, of course, entries from the Bitcoin. And usually, there are all the time instead of rising the 1 entry. I really hope that’s very clear.
Feel free to ask if you have any questions
And last one I’ve been doing that. If you remember when I started the course, actually, that’s the first cycle right here. 2nd of May. So it’s May, June, July, August, September, October. It is over 6 months. Now, usually, personally, how I do it, guys, I will share something more with you is every month I would add another piece to my cryptocurrency portfolio tracking. So if I have the chance to save money, let’s say that way I would put another piece into my portfolio.
And during these months I didn’t do it. I didn’t add anything more from my Visa card, so I have room to go. You know what I mean. If I have 10 entries and I have nothing in the EUR wallet, I can increase to 11, 12, 13 if I can afford to. I hope that’s clear. If you can afford to add another one, you can always add that. Of course, that’s a personal choice, simply how I do it. I afford to add another piece, not for this amount, not for this account.
I’m talking about, in general, how I invest in Cryptocurrencies. I really hope that’s clear. If it’s not, don’t hesitate to ask me, but I recorded already so many examples that I’m pretty sure it’s clear the system, how I’m doing it and anything new I do, I share with you just like the top gainers, which I showed in the previous lecture, and just keep an eye on them. And if you’ll notice some especially cheap Crypto with an explosive move I always want to be there.
Take advantage when the price goes down and buy
I’m glad that I succeeded to record such examples and to show you what profits we can do for a few days.
I hope this will give you a better idea about my current setup and we will see if my expectation will be right or not. But as I always like to say, be happy if the price falls down because we will buy those Cryptos on a cheaper price.
Hello, investors, in this article,I will show you how I decide when to buy cryptocurrency. Moreover, I will show you some more examples of investment opportunities that I have on the market at the current moment.
What happened since the last lecture? The target was reached, the 12 168, and I have sold all the Cryptos that I had on a profit. And then the market pulled back, which was very expected and it gave me a new opportunity, ОК, a new buying opportunity after a nice aggressive Counter Trendline.
So first of all, this is the new Fibonacci that I have from the levels of 12 486 down to 9 802.
It is a huge Fibonacci. But let me show you why I have this Fib. The previous one was at the top of 10 152. And then I start the Fibonacci from the lowest point, which, if I zoom, you will see, is at this level at $9 802. So here it is. And I have the new top, which is after the break. So it’s from this level 12 486 down to 9 802.
The new top
It’s a huge Fibonacci and the targets are pretty high, very high. 14 146, 16 830 is the second one. So I guess this time I will be looking to sell at the 14 146. Or in other words, if the price reaches this level, I will just check what I have in the portfolio. If I have good profits with some of the Cryptos, I would sell them at that first target and I expect further retracement form the Bitcoin.
I wanted to increase the entry
It can reach these levels of the Fibonacci easily, according to me, 11 460, which is the 61.8 level, and the 11 150. And if it drops below 10 000, then I guess it will be really bearish market for Bitcoin and we can expect further drop and we might have new lower lows and lower highs which will form the downtrend, and at this moment I will pause the investing. And when the new uptrend is formed, then I will be looking to buy cryptocurrency and draw new Fibonacci.
This is what I already showed in the Cryptocurrency Investment Strategy Without Losses course. But for the moment we are still in an uptrend. And I had these Counter Trendlines. So one Counter Trendline coming up from the top and then a second one aggressive Counter Trendline from these candlesticks through these lower highs.
The Counter Trendlines
And yesterday, the price broke it, we have a failure of the recent low. So until this moment, there were lower highs and lower lows.
And then there was this higher low which failed to take this low and the price broke it. Not very aggressively, but there was a break then retested and continues higher. So I took 500 EUR of Chainlink. And something I forgot last night when I was buying Chainlink is that I wanted to increase the entry. Because what I shared with you in this course is that I divide all the investments into 10 pieces.
Please don’t take my advice for a recommendation
And so far I was buying cryptocurrency with 500 EUR, but now my wallet has over 6 000 EUR. Actually, I took one piece with 500 EUR for the Chainlink, so it was 6 500. Anyway, it’s above 6 000. I can increase the single investment to 600 EUR. But I just missed doing it last night because I took the Chainlink from my phone and I will tell you a little bit later how you can do it from the phone easier, you don’t really need to be in front of the computer.
So one more time until the moment I was buying 500 EUR each time I invest. But now, because my EUR wallet got bigger because of the profits that I did, I can increase it to 600 EUR for one investment. Or if you are planning to invest, let’s say, totally 2 000 EUR. Then you divide it by 10, you will have each time 200 EUR. Now, after you have profits, if your EUR wallets get to 3 000 and you complete a cycle, you can increase it to 300 EUR for one investment. It’s up to you. You can withdraw the 1 000 that you did profit and you can continue 10 times with 200 EUR.
These are not recommendations, guys, but just tips.
And if you are planning to trade 2 000 EUR, you really don’t need to put all 2 000 in your wallet for the first time and then start buying cryptocurrency. As I showed you, the first time when I bought the first Cryptocurrency in this course, I have bought them from my Visa, they were not in my EUR wallet, so I didn’t put straightaway 4 000 to 5 000 EUR in my wallet.
How I decided when to buy cryptocurrency
I bought them piece by piece and that what I sold everything, everything goes into the EUR wallet.
My EUR wallet
But you really don’t need to put all the money you are planning to invest in your wallet and then start buying the Cryptos. You can go one by one. But now after I have the 6 000, I can increase the single investment to 600 EUR instead of 500 EUR. And last night I bought Chainlink for 500 EUR.
So simply what I will do right now, because even the Chainlink got a little bit cheaper since last night. If I click on overview, you will see that there was more decline from the Chainlink.
The decline from the Chainlink
So I will just buy crypto from the EUR Wallet for another 100 EUR and I will consider this to be my first entry, the total will be 600 EUR. I preview the order and I buy cryptocurrency.
I select Preview Buy then Buy Now
It will take just a couple of seconds and I will have the cryptocurrency in my portfolio. So I consider this to be the first investment in crypto from the next cycle.
Following the Counter Trendline When Buying Crypto
And something that I want to add, and I think I forgot to share with you during the course, is that you can have the Coinbase app on your phone and as well you can have the TradingView on your phone.
And actually, the chart there is very nice, they have improved it a lot. You can draw the Counter Trendline and you can see where the price of Bitcoin is at that moment.
But usually, I don’t do any drawings on the phone. I just follow the market. And if I’m outside and I see that there is a break of the Counter Trendline, I can easily buy cryptocurrency from the Coinbase app. This is what I did last night. But what’s interesting is that in TradingView on the top-right corner we have this clock, which is an alert.
The clock symbolizes alerts
How the alert notified me when to buy cryptocurrency
So you see what alert I had last night and that it was triggered. If I click on it, you will see that I had the alert if the Bitcoin is crossing up, you have different conditions. The value of 11 830, will notify me on the app. It will show a pop-up. It will send me an email.
Simply, I was outside, I saw the notification I opened up TradingView. I saw that the Bitcoin was breaking here and I took the Chainlink from my phone. And just this morning I figured out that I can increase it to 600 EUR per one investment because I have 6 000 EUR now in my EUR wallet.
My Future Cryptocurrency Investment Plan
I don’t really need to withdraw any cash at the moment, so I will just keep it. And my future investments will be at 6 000 EUR. And I keep it for the purpose of this course, with this amount. As I explained in the beginning, I don’t want to invest too much money in cryptocurrencybecause I really don’t want to stimulate anybody trading with a lot of money. You should be trading with the amount you feel comfortable with.
Even if you trade with just 200 EUR, that is fine. You’re still divided by 10 and each time you will invest 20 EUR. No problem, do that as long as you are strict with the strategy, you are fine. It really doesn’t matter how much money you are trading. Obviously I am doing this for a long time and in my other accounts I’m trading with bigger volume. But for the purpose of this course, I have decided to use this amount of money and one more time, don’t take it as a recommendation, I want to teach you the strategy, the system, the money management, which is very important.
So I will keep recording more examples which will be useful to you to compare your chart with mine. Where are my Fibs? Where are my Counter Trendlines and Aggressive Counter Trendlines? And I will be happy to hear your feedback, share your results with me and I will help you. And I will give you tips always to help you improve your trading.
Thank you, guys, for reading, and I will see you in the next lecture. If you have any questions, don’t hesitate to write a comment below, and if you haven’t subscribed to our YouTube channel it’s a great time to do it now.
In this MetaTrader 4 tutorial, we will show you more about the MetaTrader platform, especially if you are a beginner trader. Moreover, we will give you some tips that you need to know before you trade with Expert Advisors on MT4.
Later in this lecture, you will be able to download a MetaTrader 4 tutorial in PDF and learn how to use the platform with examples.
Now, let’s jump into this MetaTrader 4 tutorial for beginners
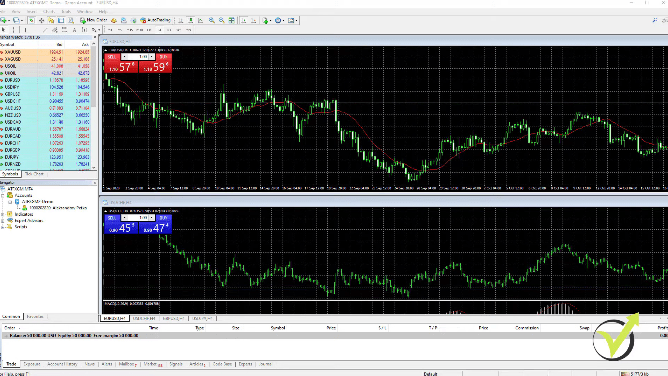
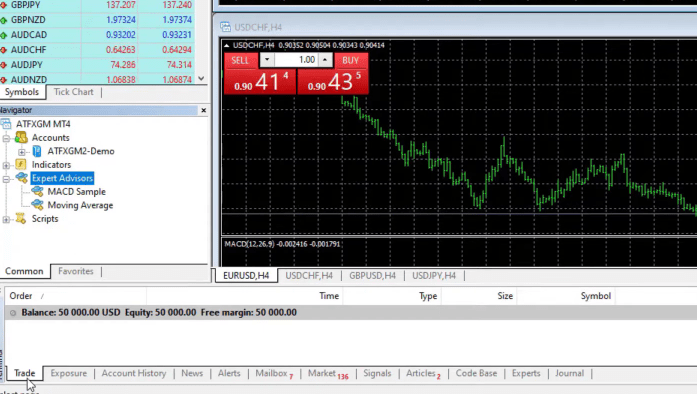
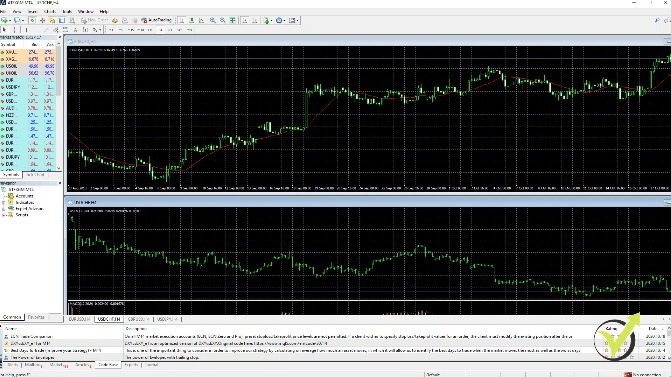
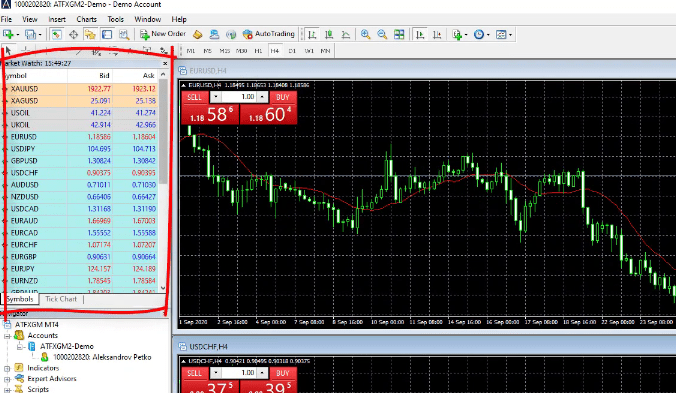
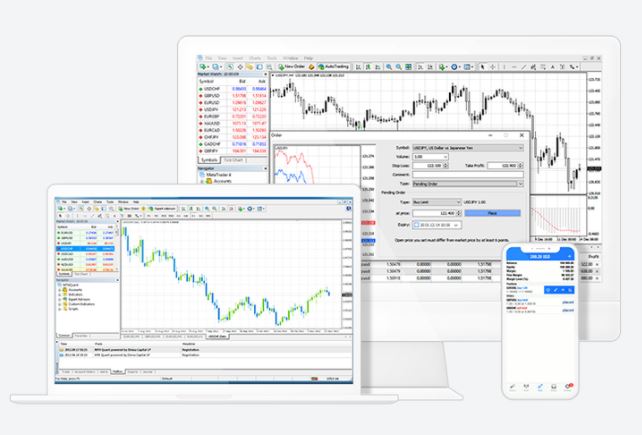
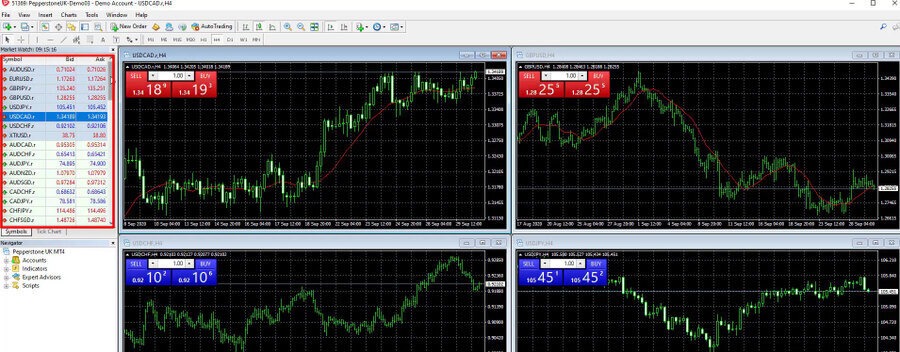
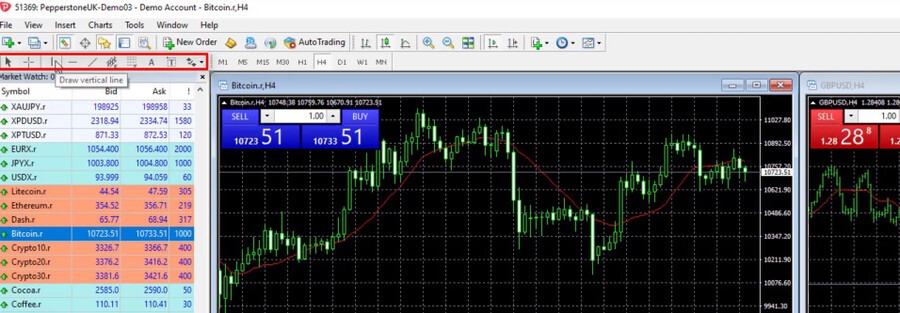
This is how the MetaTrader platform looks like after you install it.
The MetaTrader platform
I have selected MetaTrader 4 for most of my courses because it is the most common platform for trading. It allows algorithmic trading, which is very important, and it is free. The brokers pay the MetaQuotes Company and the brokers provide the platform to us for free.
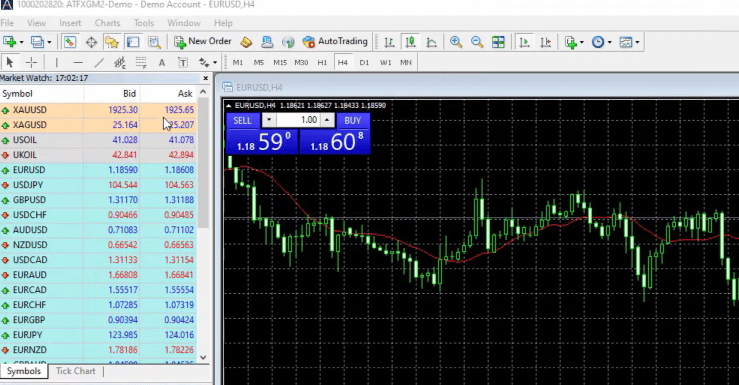
We don’t pay any monthly fees, charges, and so on. What we pay the brokers is the spread. This is the difference between the Bid and the Ask price.
The Bid and Ask price
For beginner traders, when we buy an asset, we buy it at the Ask price or this is the more expensive price. And when we sell the asset, we sell it at the Bid price, which is the cheaper price.
For example, if I buy one trading lot at the moment at the price of 1.1860 and the price rises to 1.1960, this will be 100 pips of a profit. If I close the position at that moment, I will be closing it on the Bid price. Therefore, the broker will benefit from the difference between the Buy and the Sell prices. This is very normal and it is important to know when you are trading with Expert Advisors.
The Swap
The other cost that we pay the brokers is the swap. The swap comes if we hold our position overnight. If I buy EURUSD today, for example, I hold the position overnight, and I close the trade tomorrow, I will be charged a swap. This is the fee that the broker takes if it transfers the trade to the next day.
It is the same thing if you sell, but some brokers will give you actually a positive swap. In other words, if they hold your position overnight, you may benefit from that.
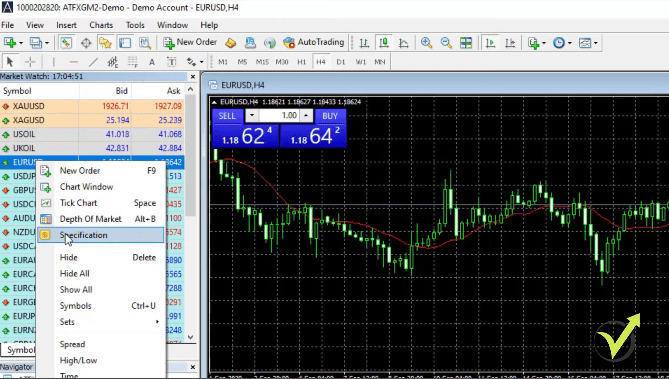
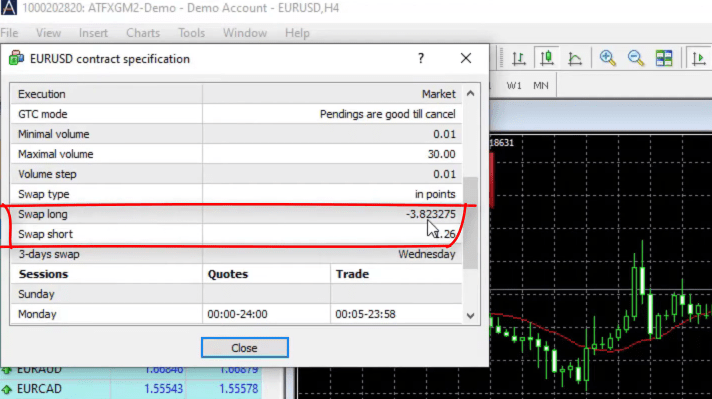
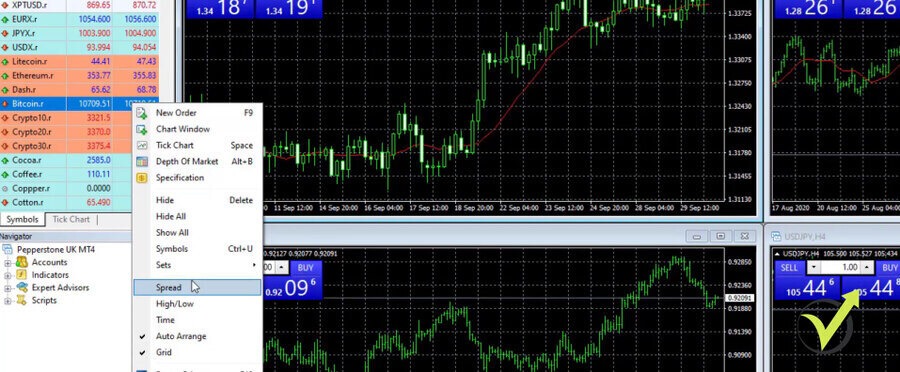
Let’s see, how much is the swap, for example, for EURUSD. If I right-click over the Market Watch, over the EURUSD and I click on Specification,
Right-click over the asset and click on Specification
you will see below that I have some details about the asset.
The asset contract specification
I have a Swap long negative and I have a Swap short positive. This means that if I keep my short trade overnight, I will have some positive swap out of that.
At the end of this MetaTrader 4 tutorial for beginners, you can download our MetaTrader 4 PDF Tutorial with some basic terminology about Forex trading which will help you learn all of these terms faster.
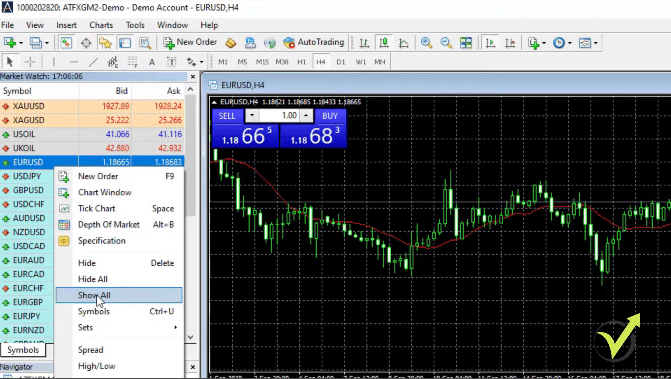
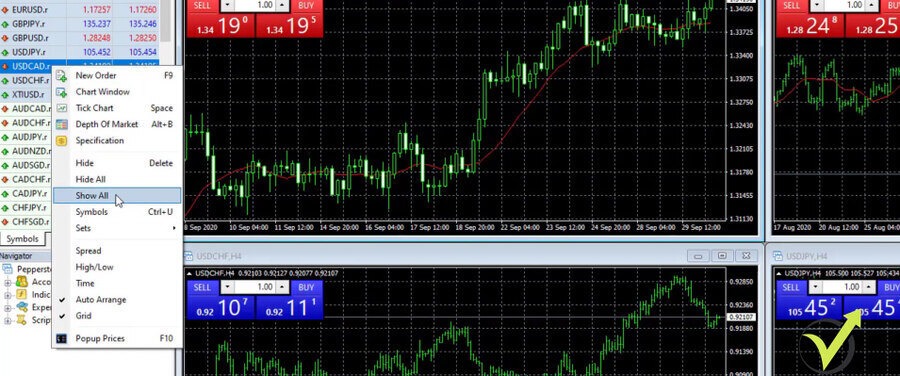
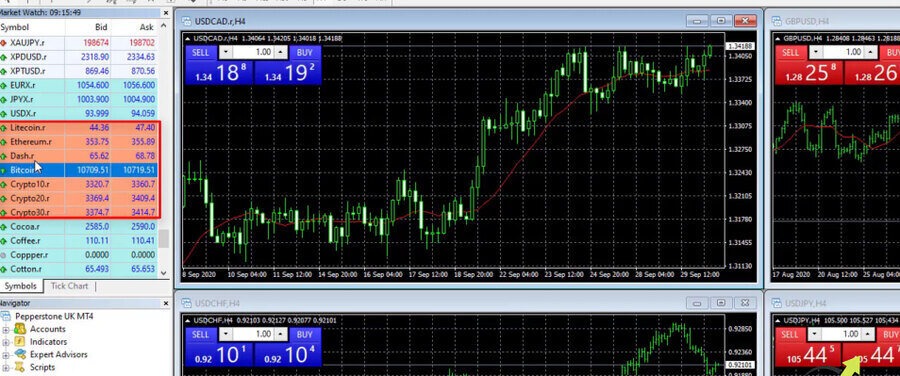
In the Market Watch, we see all of the assets that the broker offers you. However, if you don’t see too many, right-click anywhere on the Market Watch and check Show All.
Right-click over the Market Watch and select Show All
This will display more assets that are provided by the broker. Of course, it depends on the broker that you are using and the type of account you’re using.
MT4 Live Tutorial
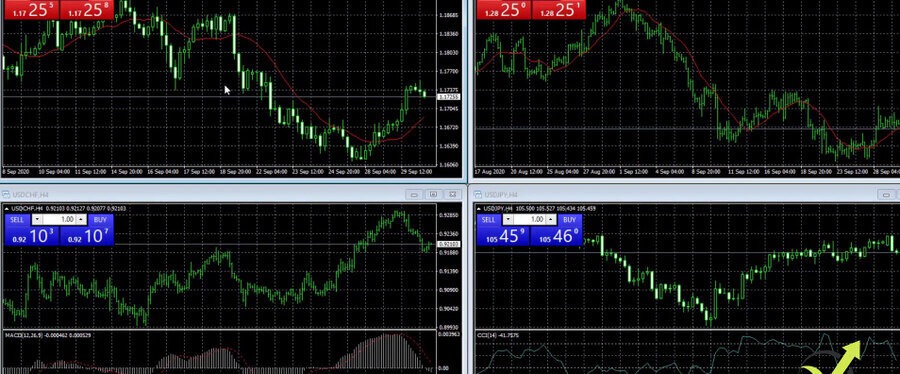
So on the left side, we said that we have the Market Watch with the Bid and the Ask price.
The Market Watch
This is from where we can select the assets we want to trade. If you don’t see all the assets, you can right-click and check Show All.
Click on Show All
This will display some more assets depending on the broker you’re using.
And if you want to open a new chart, you just click on the symbol and you go to Chart Window.
Select Chart Window
So right here I have already opened 2 charts for Bitcoin and I have some more for Forex which was opened by default when I installed the MetaTrader.
I have 2 Bitcoin charts open
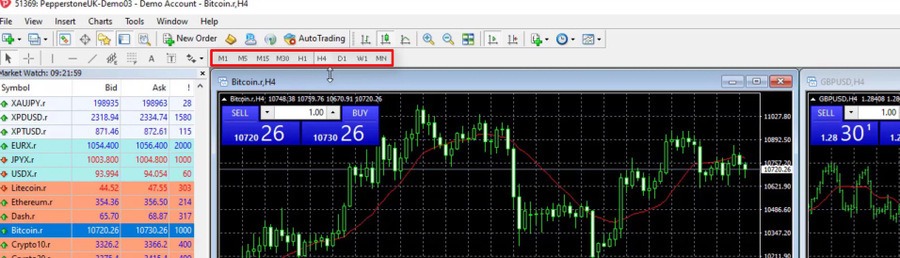
So let me remove those. And I have 1 chart for Bitcoin on hourly time frame and the other one I can change, for example, to M15 timeframe.
Types of Charts
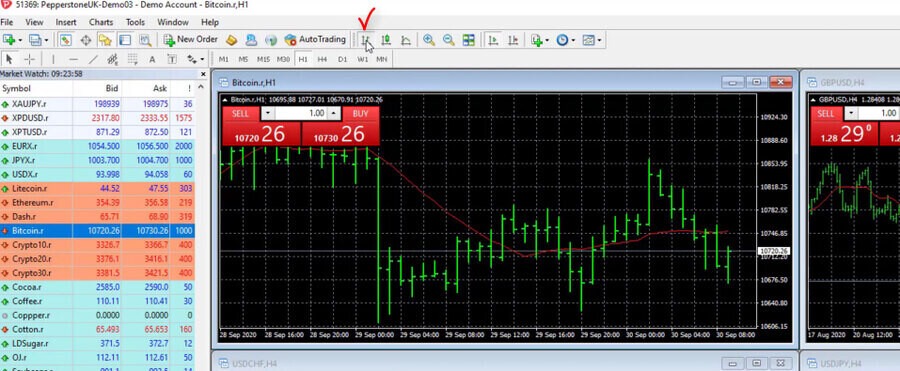
We have actually 3 types of charts. We have bars, we have candlesticks, and we have line chart.
Types of charts
The most popular is candlesticks.
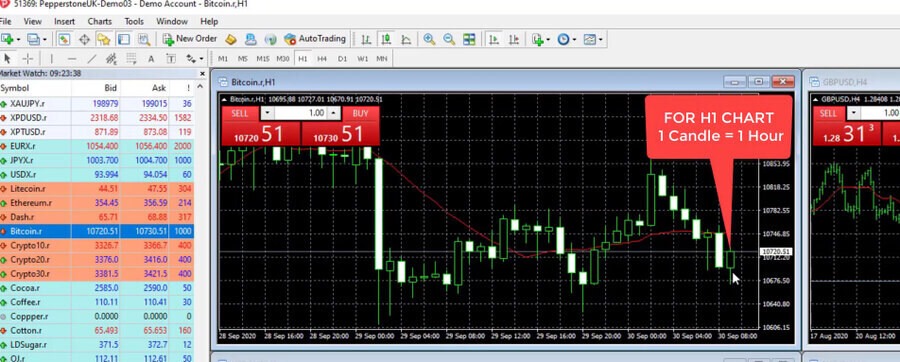
So when we are on M15, this means that 1 candlestick or 1 bar represents 15 minutes of a time. The chart is a representation of the price which we have on the right side and the time which we have below the chart. Where these 2 meet, we have the candlesticks.
And if we are on hourly chart, then 1 candlestick or 1 bar represents 1 hour time frame. And for each candlestick, for each bar, we have the opening of the bar, we have the closing of the bar, the highest point and the lowest point.
Positive bars and negative bars
So in this case, the negative bar is represented with white color and the positive is with black color.
Representation of positive and negative bars
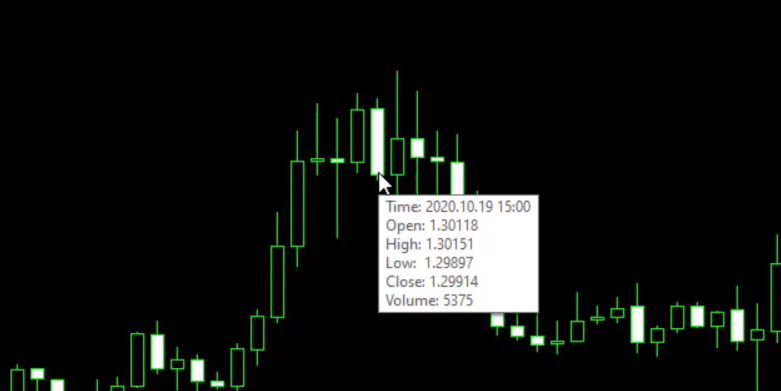
So if I put the mouse on the closing of the bar, you can see exactly what are the values for the open, high, low, and close.
The values
And what happens after the bar closes, a new bar opens. So we have the closing of that bar and then the new bar opens. The price goes up and down. It closes at one level.
And because the closing was higher than the opening, we have a positive bar that is fulfilled with black and all of these colors you can change from Properties.
Click on Properties
And if you go to colors, you can change what you want to see on your chart.
Select Colors
The price always matter
Now, I’m not touching that because when trading with Expert Advisors, it really doesn’t matter what you see on the chart. It doesn’t matter if you are on a candlestick chart, on the bar chart, what are the colors?
We don’t put any Indicators. Nothing over the MetaTrader 4 chart. I just wanted to give you a brief idea of what we see on the chart as price, because at the end of the day, the price always matters. And that’s the most important thing that is on the chart.
But for trading and strategies and Expert Advisors, we use different Indicators. So if I go to insert, Indicators and I click randomly on any of those let’s say I’ll select the trend Indicator called Bollinger Bands, which is a very popular Indicator in algorithmic trading.
I click on Bollinger Bands
You will see 3 lines that are around the price. But I’m not going into Indicators.
The Bollinger Bands on the chart
Creating strategies
I’m not going to explain any complicated stuff because you really don’t need to know it. And I will go to Indicators List,
I click on Indicators List
and I will remove it.
I remove the indicator
One more time, when trading with Expert Advisors or with Robots, you don’t need to place anything over the chart.
The Indicators, the trading rules, they will be inside the Robots. And I will show you later on in the course what are the rules, how I create the strategies, how I test them even before putting on a Demo Account.
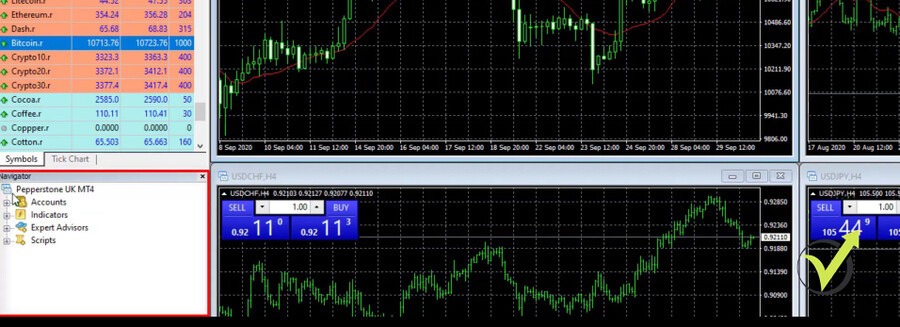
Then on the left, below the Market Watch, we have the Navigator.
The Navigator
This is where we have the accounts. As I said, you can have many accounts with a broker, but if you want to test Expert Advisors on different accounts, you need to install different platforms as well.
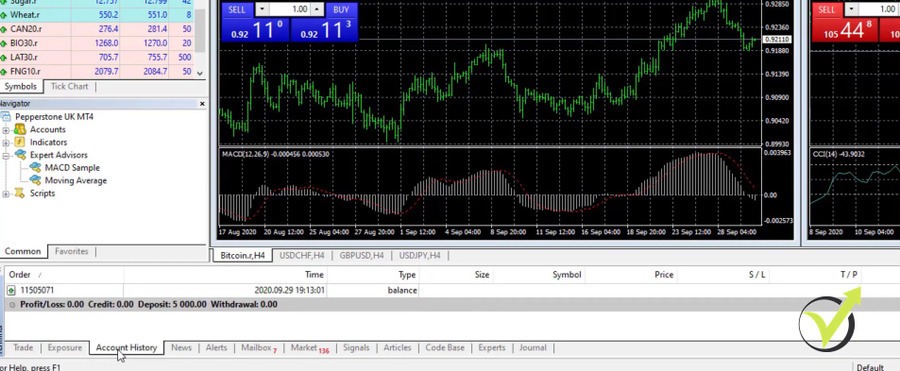
Expert Advisors
Below, we have the Indicators very similar if you want to insert them from Indicators or you will insert them from the Navigator, just double click on it and it will be over the chart. For example, the Accumulation Indicator is displayed below the price, not over the chart.
The Accumulation Indicator
So let me remove it for the purpose of this MetaTrader 4 tutorial. And then we have some scripts that are useful for algorithmic trading and different purposes. But the most important is Expert Advisors. And I have 1 Expert Advisor for Bitcoin.
And in the next lectures, I will show you how I’m creating Robots, Expert Advisors, how I’m testing them and how I am installing them on the MetaTrader platform. Below the Navigator, we have the Terminal where we see our balance or our account, the equity, and the margin?
The Terminal
Leverage
So basically, the margin is how much free money we have in the account, how much we have blocked from the account, and how much free margin we have in the account. So when we start opening positions, some of this amount will be blocked.
And this depends on the leverage you’re using. For example, in Europe, we have the ESMA regulation since 2018 and we cannot have leverage more than 2 to 1 for the Cryptocurrencies, which means that if I want to buy a whole Bitcoin, I will need at least to have somewhere about $10 000. Depends on what the price of Bitcoin is at the moment.
But the leverage for the beginners with simple words is the amount of money that the broker borrowed the trader to use for trading. So if I have $5 000 in my account and I use leverage 2 to 1, then I will be able to Buy maximum with $10 000. If I use leverage 100 to 1, then I will be able to Buy 100 times more from what I have in the account. And of course the leverage is very useful.
Trade small
But when you are using it carefully, we don’t Buy with all of the money of the account because if you use high leverage and you open position with all of the money, then it is very likely that you will blow your account. Of course, you can make very quick profits, but that probably will be more of lucky trading. And at the same time, as I said, it is very likely that you will just lose everything in the account.
So take it easy with the leverage. It depends on where you live and what type of broker you use, but it is always very important to trade small piece from your amount so you are not risking the whole capital in a few trades. And this is how usually beginner traders lose their money in the 1st month of their trading.
Risk Diversification
The broker we’re using for this MT 4 tutorial, for example, offers more assets on its real account, which you will see later in the course. In this course, I will focus on the GBPUSD, which I believe you will be able to find with all of the brokers.
Actually, the GBPUSD is the third most traded currency pair, the first being EURUSD. The second is USDJPY, and the third spot is GBPUSD.
However, in most of our courses, we include different strategies for different assets. In other words, if you have already many of our courses, you will have Expert Advisors for EURUSD, USDJPY, EURJPY, and EURGBP.
You will have a great diversification of your risk by trading different assets.
For this course, I will include different strategies for the GBP so you will not rely on one single strategy or one single Expert Advisor. And still, this way, you will have an excellent risk diversification which you will see a little bit later in the course.
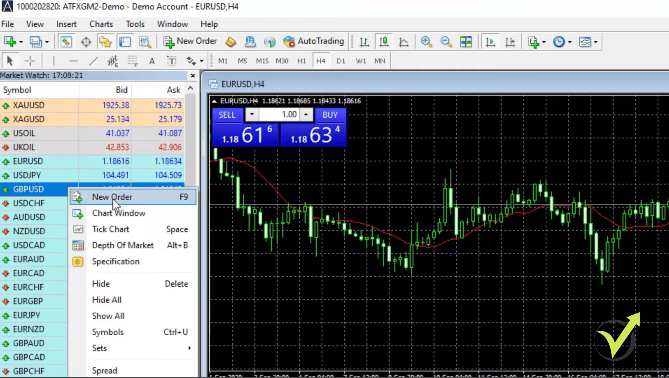
If you want to trade any of the assets, all you need to do is to right-click over it in the Market Watch and go to New Order.
Right-click over the asset and click New Order
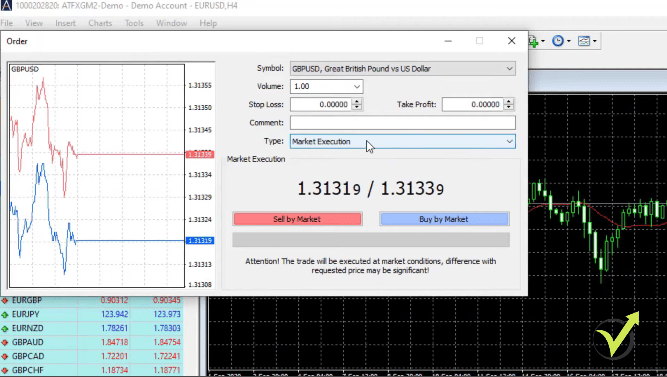
This is where you can execute an order, you can set the volume, how much you want to trade, the Stop Loss and the Take Profit.
The order
MetaTrader 4 Tutorial: The Navigator
If you want to execute the market price at the moment you can just sell or buy. Or you can use a pending order. In other words, you can select what type of pending order you want to do and select the price at which you want to buy or to sell.
I’m not doing manual trading and I won’t be executing trades manually. You will see how I do it all with Expert Advisors.
In the Navigator, you will see that we have the Accounts. In addition,this is where you will see your account that you opened with the broker, if you have a Demo or if you have a live account.
Then we have different indicators that you can use for your strategies.
The Navigator
After that, we have the Expert Advisors, which I will show you how to put on your MetaTrader just in the next lectures. Below we have some scripts that are useful for different purposes when you’re using MetaTrader but I am not going into details about that in this tutorial.
The Demo account
Below the Navigator, we have the trading terminal where you will see the open trades and the closed trades. Moreover, we will have the account history where we will see all trades that open and closed.
I have opened a Demo account of 50000 USD, this is virtual money. So if you open a Demo Account and you lose, regardless of whether you are doing manual trading or with Expert Advisors, don’t worry – this is virtual money. In other words, you won’t owe anything to the broker. You can always restart your account and practice. This is the best thing.
To sum up, when you have a Demo account that you are actually trading, you have access to the market and you can practice without losing anything.
Don’t hurry to risk real money until you are confident with the system and until you feel satisfied with the strategies, with the Robots that you’re using. Not just from this course, but any other strategies that you learn.
Make sure to practice and make sure to master it before risking real money on the market.
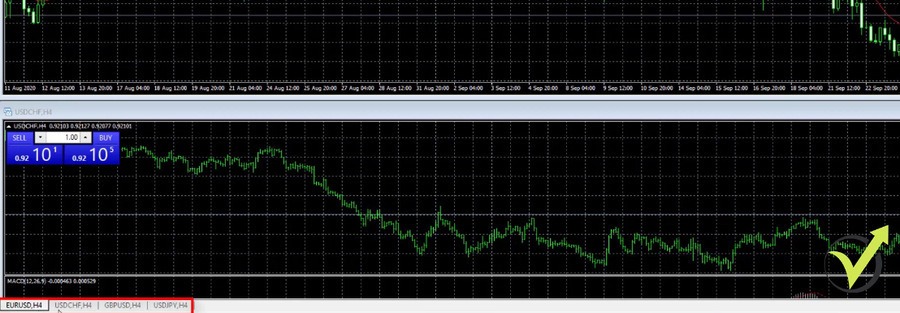
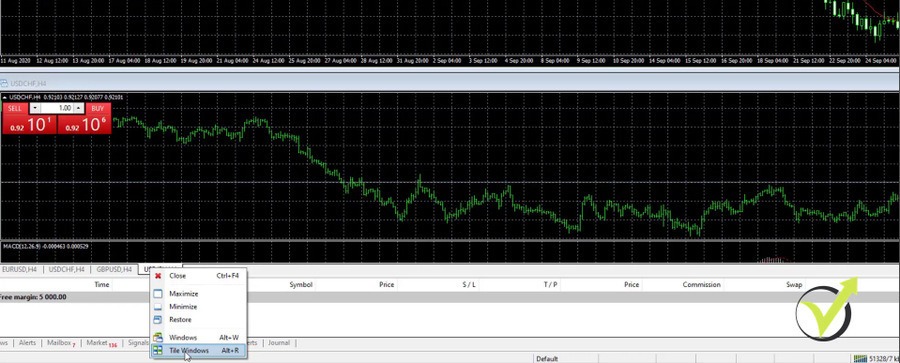
In the middle of the screen, you see the charts and you can modify those. I can right-click and select Tile Windows. This will split the window into 4 charts, and I can close them if I want and leave just one. As I’ve said in this course, I will be trading the GBPUSD.
Customize the Candlesticks in MetaTrader 4
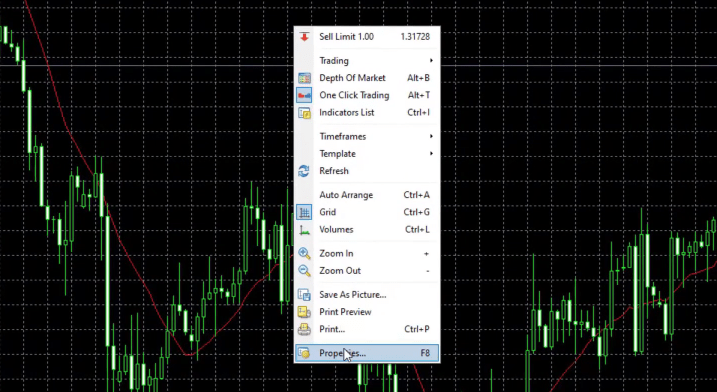
For the Expert Advisors, it really doesn’t matter if you have indicators over the chart or not. Therefore, what I like to do for the purpose of this MetaTrader 4 tutorial, is just to remove the indicators from the chart, and as well I remove the grid behind. So I can right-click over the chart, go to Properties,
Right-click over the chart and select Properties
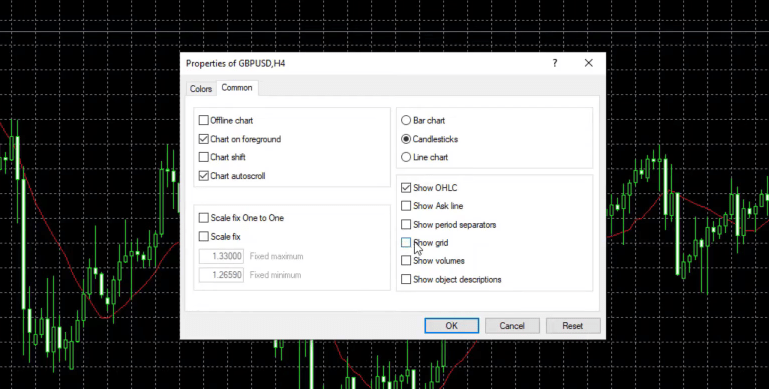
and from Common I can uncheck Show grid as well.
Common settings
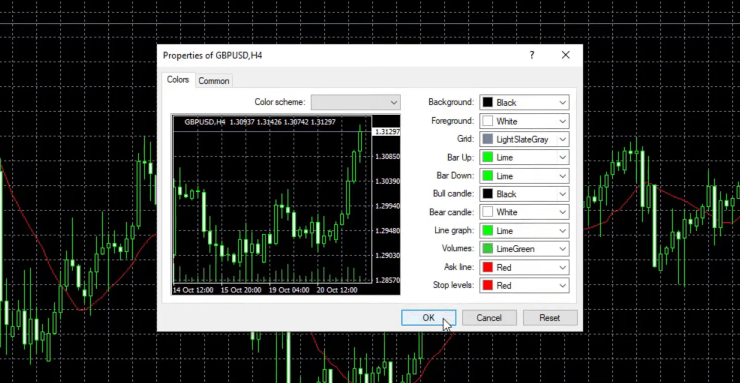
I can change the colors of the candlesticks or I can leave them the way they are.
Color settings
It doesn’t really matter for algorithmic trading.
One more time in this MetaTrader 4 tutorial for beginners, I will go to Indicator’s List because I didn’t remove the Moving Average.
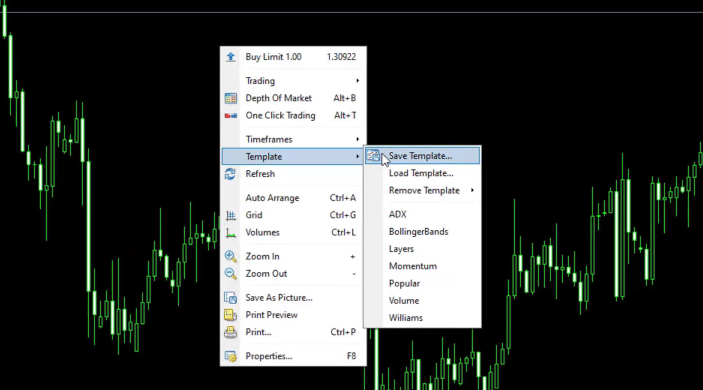
The last thing, I will uncheck One-Click trading because I don’t need it. This is the default chart and I can actually save it as a template. I will right-click over the chart, go to Templates, Save Template,
Right-click over the chart, go to Templates, select Save Template
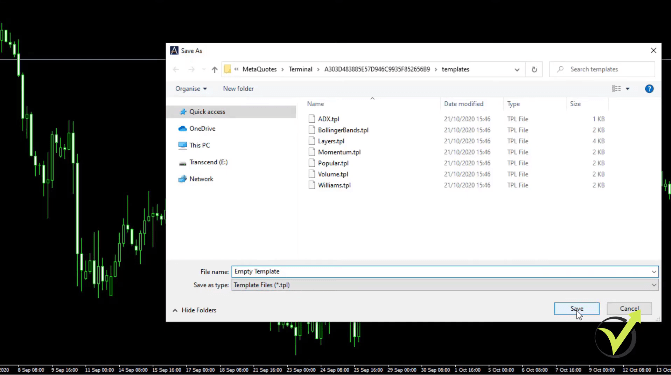
and I will save it as Empty template.
I save it as Empty template
This way, I know that whenever I want to have an empty template, I can easily do that.
The 4 Candlestick Values
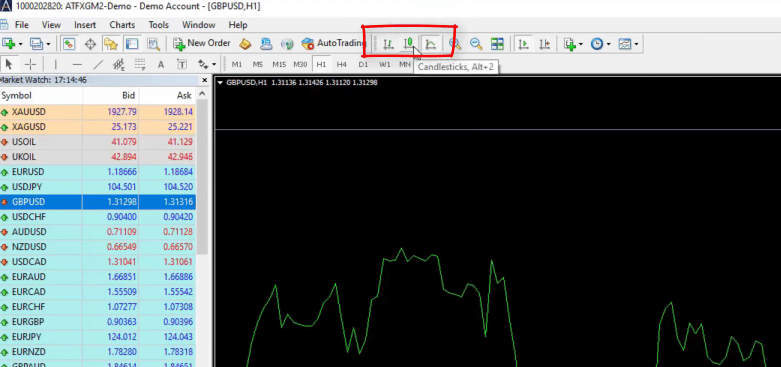
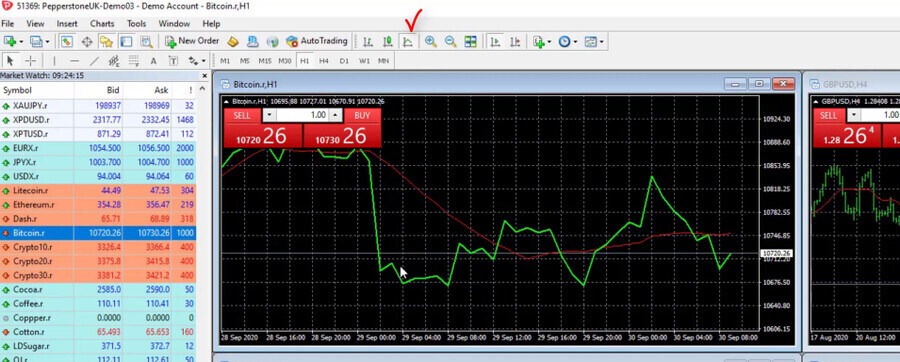
You can modify your MetaTrader trading platform any way that you want. For instance, you can switch to a bar chart or to a line chart, which is the very same thing.
You can switch to bar chart or line chart
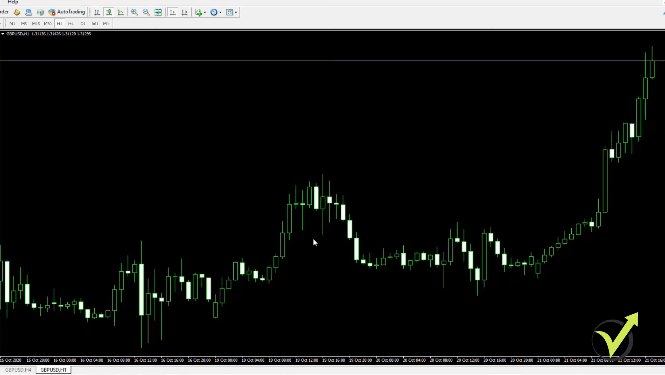
But with candlesticks, we have a more visual representation of the price by having the candlesticks colored according to whether they were bullish or whether they were bearish.
The candlesticks
In other words, if they were positive or if they were negative. And if I put my mouse on the closing of any of the candlesticks, you will see that I have 4 values: High, Low, Close, and Volume.
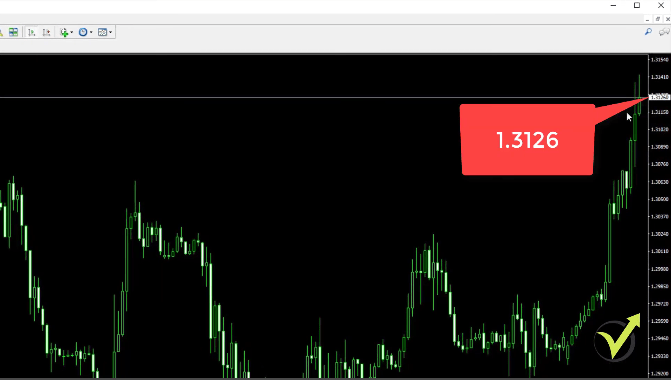
And the current price for GBPUSD is 1.3126 and all the rest that you see before that is called historical data.
Current GBPUSD price
In another lecture, I will show you how we use this historical data to create strategies and Expert Advisors and to see how they performed until the moment. And along with the lecture, I will show you more about the MetaTrader platform, so you will feel comfortable with it.
This is about the MetaTrader platform tutorial for beginners. If you have any questions, let me know. By the end of the MetaTrader 4 course, you will know exactly what you need to do in order to test Expert Advisors and to see some profits into your account.
But if you just play around with the trading platform, you will see that it is very easy to use, and especially for algorithmic trading is just a few clicks to put the Expert Advisor on the MT4 chart and to make it start trading for you. Thanks for reading this MetaTrader tutorial for beginners. See you in the next lecture.
Leave your email below to receive the free MetaTrader 4 PDF tutorial guide.
The foreign exchange (forex) market remains one of the largest and most liquid markets globally. Success often depends on choosing the right currency pairs. But with so many options, which pairs should you focus on? Traders and investors continuously seek out the most traded currency pairs for their liquidity, tight spreads, and the ability to execute trades efficiently.
As we move through the final quarter of 2024, certain pairs dominate the global forex market, offering traders consistent opportunities. These pairs are traded by institutional and retail traders alike, thanks to their liquidity and price movements driven by macroeconomic trends. Below, we’ll explore likely the top 5 most traded forex currency pairs in 2024, why they continue to dominate the market, and show you how to trade them using algorithmic trading strategies.
Top 5 Most Traded Forex Currency Pairs: Quick List
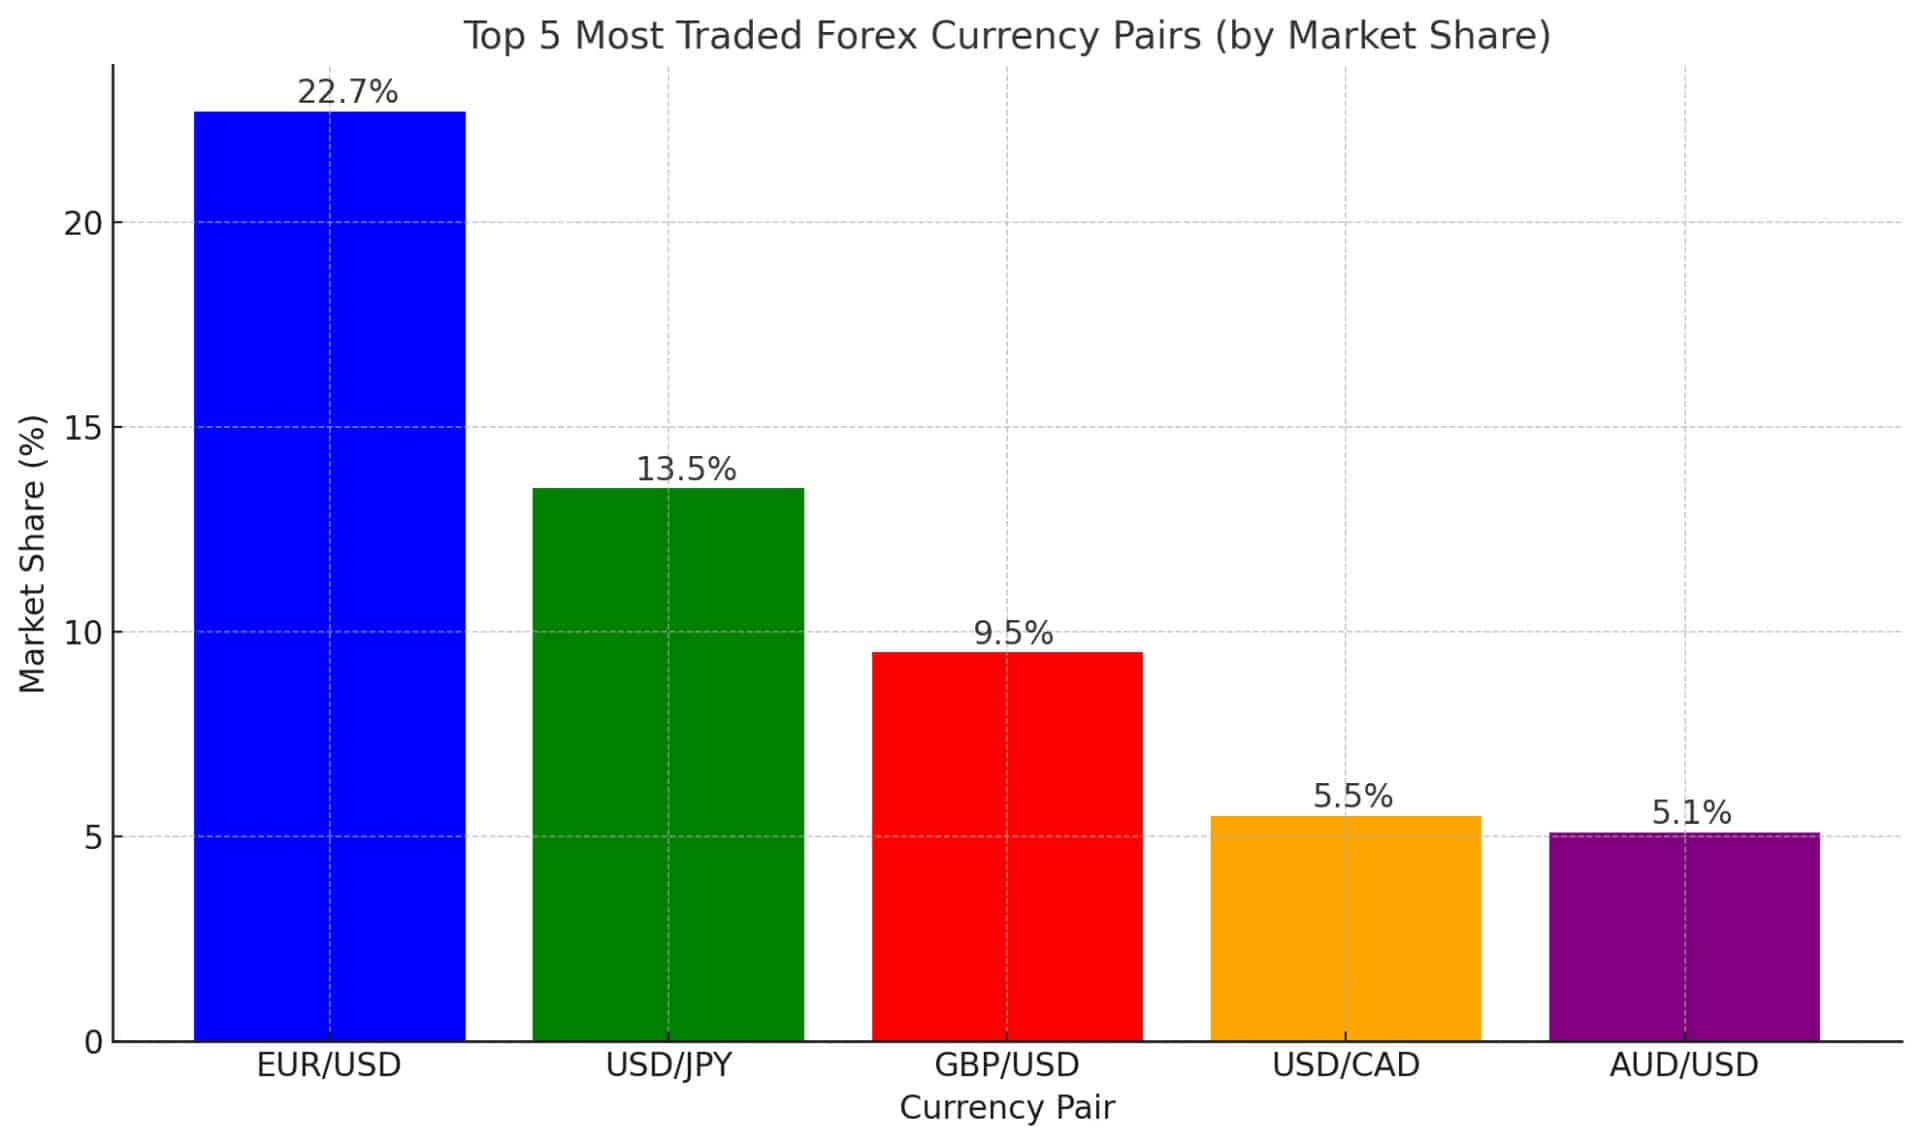
EUR/USD (22.7%) – The most liquid and widely traded currency pair globally.
USD/JPY (13.5%) – Heavily influenced by interest rates and the Japanese economy.
GBP/USD (9.5%) – A popular choice driven by UK and US economic dynamics.
USD/CAD (5.5%) – A key pair tied to oil prices and US-Canada trade relations.
AUD/USD (5.1%) – Linked to global commodity prices and China’s economy.
These pairs account for the majority of forex trading volume in 2024, driven by their liquidity, tight spreads, and frequent price movements.
Most Traded Forex Pairs by Volume
According to the Bank for International Settlements (BIS)’s 2022 Triennial Survey, daily forex trading volume reached $7.5 trillion in 2022, with a significant portion concentrated in a few key currency pairs. The EUR/USD remains the dominant pair, responsible for nearly 23% of daily trading volume, followed by the USD/JPY at 13.5% and the GBP/USD at 9.5%. These three pairs alone account for nearly half of the entire forex market, making them the preferred choices for both institutional and retail traders.
The popularity of these pairs is attributed to their liquidity, tight spreads, and constant volatility, which creates frequent trading opportunities. For traders looking to maximize their returns in 2024, these currency pairs offer the most potential.
While more recent data for 2024 is yet to be published, the market structure has remained largely consistent, and there is little reason to believe these figures have changed significantly in 2024.
Detailed Overview of the Top 5 Most Traded Currency Pairs
Let’s now take a closer look at each of the top 5 currency pairs, exploring what makes them so widely traded, and how you can take advantage of their unique characteristics in your trading strategy.
EUR/USD – The Global Leader
The EUR/USD is surely going to be the most traded forex currency pair in 2024 as well. It maintains its position as a favorite among traders worldwide. There are several reasons for its dominance:
Liquidity: The EUR/USD offers unparalleled liquidity, allowing traders to enter and exit positions with ease. This is particularly attractive for high-frequency traders and those using algorithmic trading.
Tight Spreads: Because of the pair’s popularity, spreads are extremely tight, minimizing the cost of trading.
Economic Drivers: The EUR/USD is highly sensitive to events such as European Central Bank (ECB) monetary policy decisions, US Federal Reserve interest rate changes, and geopolitical events within the Eurozone.
Trading the EUR/USD with Algorithms:
For algorithmic traders, the EUR/USD is ideal due to its high liquidity and responsiveness to technical analysis. Traders can use Expert Advisors (EAs) to automate strategies based on key indicators like moving averages, Bollinger Bands, and the Relative Strength Index (RSI). As the pair is less prone to erratic moves compared to some emerging market currencies, algorithms can achieve consistent returns with relatively low risk.
USD/JPY – The Interest Rate Play
The USD/JPY remains a top-traded currency pair in 2024, heavily influenced by the monetary policies of the Bank of Japan (BoJ) and the Federal Reserve. There are several reasons that draw traders interest to this pair:
Interest Rate Differentials: One of the main drivers of USD/JPY is the difference in interest rates between the US and Japan. The carry trade strategy, where traders borrow in low-interest currencies like the JPY and invest in higher-yielding currencies like the USD, continues to be a popular strategy.
Safe-Haven Appeal: The Japanese yen is often seen as a safe-haven currency, particularly in times of global economic uncertainty. As a result, the USD/JPY can experience sharp movements during market volatility.
Trading the USD/JPY with Algorithms:
Algorithmic traders can capitalize on the predictable interest rate-driven trends of the USD/JPY. Expert Advisors can be programmed to enter trades based on the spread between US and Japanese government bonds or in reaction to key economic data releases, such as US non-farm payroll reports or BoJ meetings. A common algorithmic strategy is the mean reversion, where traders exploit short-term price deviations before they revert to their average.
GBP/USD – The “Cable” Pair
The GBP/USD, commonly known as “Cable,” is another highly traded pair, offering plenty of opportunities for traders in 2024. Here’s why:
Volatility: The GBP/USD is known for its volatility, driven by economic data from both the Bank of England (BoE) and the Federal Reserve, as well as political factors like Brexit. This volatility makes it an attractive pair for traders seeking short-term opportunities.
Economic Indicators: Key data points like UK inflation, employment figures, and interest rate decisions heavily influence the GBP/USD.
Trading the GBP/USD with Algorithms:
Algorithmic traders often use breakout strategies on the GBP/USD due to its volatile nature. By setting triggers around key support and resistance levels, Expert Advisors can automatically enter and exit trades during periods of sharp price movements. Timeframes such as H1 (one-hour charts) work well for algorithmic strategies on the GBP/USD, as the pair frequently sees price swings within a single trading session.
USD/CAD – The Oil Connection
The USD/CAD is another major currency pair, with its movements closely tied to the price of oil, one of Canada’s largest exports. Key factors influencing this pair include:
Oil Prices: Since oil is a major driver of Canada’s economy, fluctuations in oil prices significantly impact the USD/CAD. For example, a rise in oil prices often strengthens the Canadian dollar, while a decline weakens it.
Economic Relations: The strong trade ties between the US and Canada, including agreements like USMCA, also affect this pair.
Trading the USD/CAD with Algorithms:
Algorithmic trading strategies for USD/CAD often involve tracking oil price movements or economic data releases, such as US crude oil inventories. Commodity-linked strategies can be implemented through Expert Advisors. This will allow traders to take positions when oil prices move in correlation with the Canadian dollar.
AUD/USD – The Commodity Currency
The AUD/USD is a top 5 currency pair due to Australia’s strong ties to global commodity markets, especially those in China. Key drivers include:
Commodity Prices: Australia is a leading exporter of commodities like iron ore and coal. As such, movements in global commodity prices, especially driven by demand from China, have a direct impact on the AUD/USD.
Economic Indicators: Australia’s economic health, particularly its trade balance, inflation, and interest rates, plays a major role in this pair’s price action.
Trading the AUD/USD with Algorithms:
Algorithmic traders can benefit from the cyclical nature of commodities and China’s economic performance. Strategies that track commodity price indices or China’s GDP growth can provide valuable signals for trading the AUD/USD. Trend-following algorithms are particularly effective on this pair, as the AUD/USD often follows long, sustained trends tied to macroeconomic developments.
How to Trade Forex Most Popular Pairs with Algorithmic Trading
The forex market can be overwhelming, especially when trading these top currency pairs. However, algorithmic trading simplifies the process, allowing traders to automate strategies, reduce emotional bias, and capitalize on market opportunities around the clock.
Using Expert Advisors:
Algorithmic trading involves using Expert Advisors (EAs) to automate your trades. These software programs are designed to follow specific rules based on technical analysis indicators like moving averages, RSI, or Bollinger Bands. The beauty of algorithmic trading is that it removes the need for manual intervention, letting traders manage multiple pairs simultaneously.
For example, using the EUR/USD, you can set an EA to trade based on key support and resistance levels, executing buy or sell orders automatically. Similarly, for pairs like the USD/JPY or GBP/USD, algorithms can trigger trades based on interest rate announcements or geopolitical events.
Now that you know the top 5 most traded currency pairs in forex and how to approach them with algorithmic strategies, it’s time to take the next step. Why not automate your trading using the Top 10 Robots App? This app provides access to the best-performing Expert Advisors, allowing you to trade the majority of the most traded currency pairs in forex effortlessly.
Conclusion: Trading Success with the Right Currency Pairs
The key to forex trading success lies in choosing the right currency pairs and trading them effectively. In 2024, the EUR/USD, USD/JPY, GBP/USD, AUD/USD, and USD/CAD likely will remain the top 5 pairs, offering liquidity, volatility, and trading opportunities. By combining your knowledge of these pairs with algorithmic trading strategies, you can maximize your potential profits.
If you would like to read about Top 10 Most Volatile Forex Pairs + The Reasons Why, follow this link.
In this lecture, I will show you how to backtest EA online on MetaTrader 4 or in other words, how to see the performance of the Expert Advisor. As I explained many times in previous lectures, the Expert Advisor is a trading strategy that is automated.
So in this account, I have now 13 Expert Advisors. I’ve been trading with 12 of them. And I have added one more, which I have displayed over the chart, placing the indicators. But as I have concluded, it is really hard to follow the Indicators manually. We need to spend a lot of time in front of the screen. So the best solution is to trade with Expert Advisor.
Now, when you get an Expert Advisor, no matter where you get it, whether you buy it from the market, whether you create it by yourself using strategy builders, or you code it, or you take it from our course, you have backtest EA. This way you will be able to see how this strategy performed with your broker.
Backtest EA on Different Brokers
Now, we test the Expert Advisors on a few brokers. Obviously, we can’t test them with all of the brokers. There are thousands of brokers around and that is why the best thing you can do when you have an Expert Advisor is to perform backtest EA on your broker.
And if you do actually a backtest on a few brokers, you will see how different the results are.
In our courses we have demonstrated many times that if we trade with the same Expert Advisors on different brokers, we get totally different results.
It is because the spread is different on the brokers, the commission, the swap, the prices. Usually, the brokers have different liquidity providers, which simply means that they receive different prices and usually it’s a very small difference.
But when trading with Expert Advisors, we are very accurate in executing the trades and we can see that difference.
Now, how to backtest EA on MetaTrader?
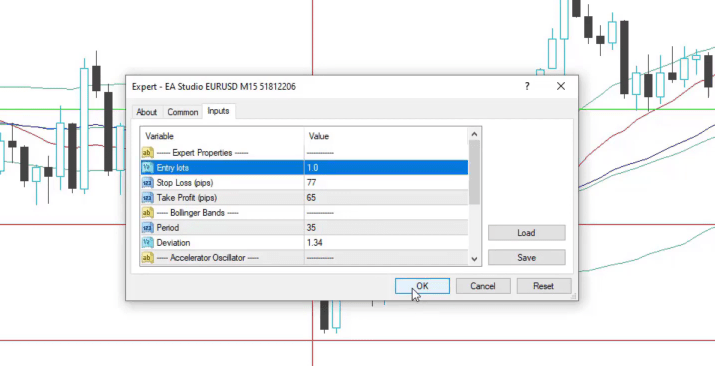
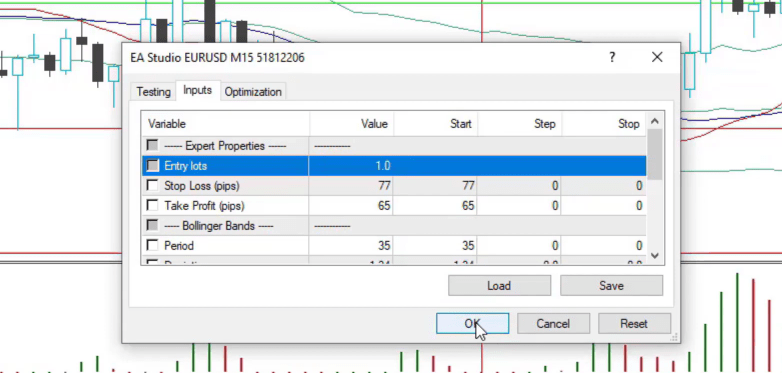
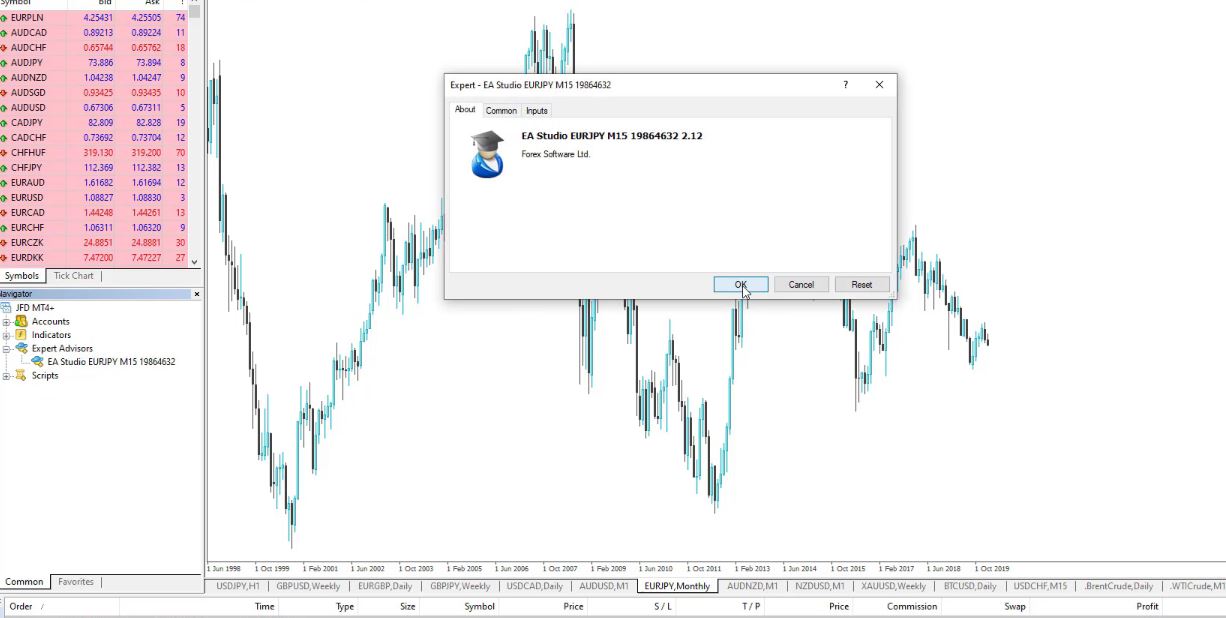
First, I will need to attach the Expert Advisor over the chart so I can double-click on it, or I can drag and drop it over the chart and I will see the small input menu.
The input menu
And I don’t want to trade with the Expert Advisor right now. I just want to show you how to backtest EA online on MT4. But anyway, I will attach it over the chart.
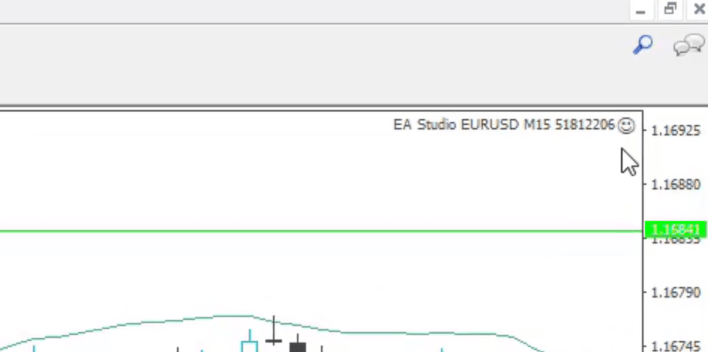
Let’s say I will be trading with 1 complete lot and I click on OK. We see a smiley face, which means the Expert Advisor is attached over the chart.
The smiley face
EA Backtesting with MetaTrader Strategy Tester
You see where your trades opened and closed.
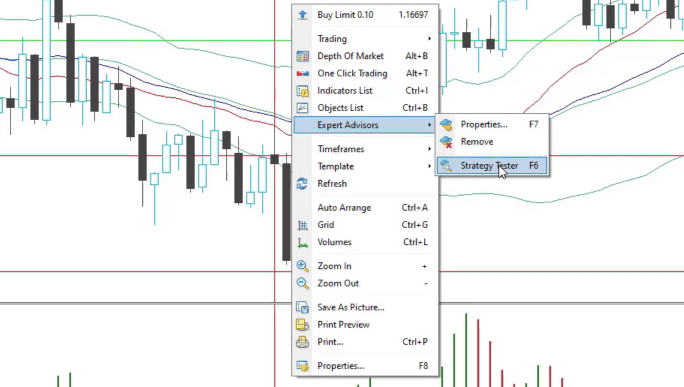
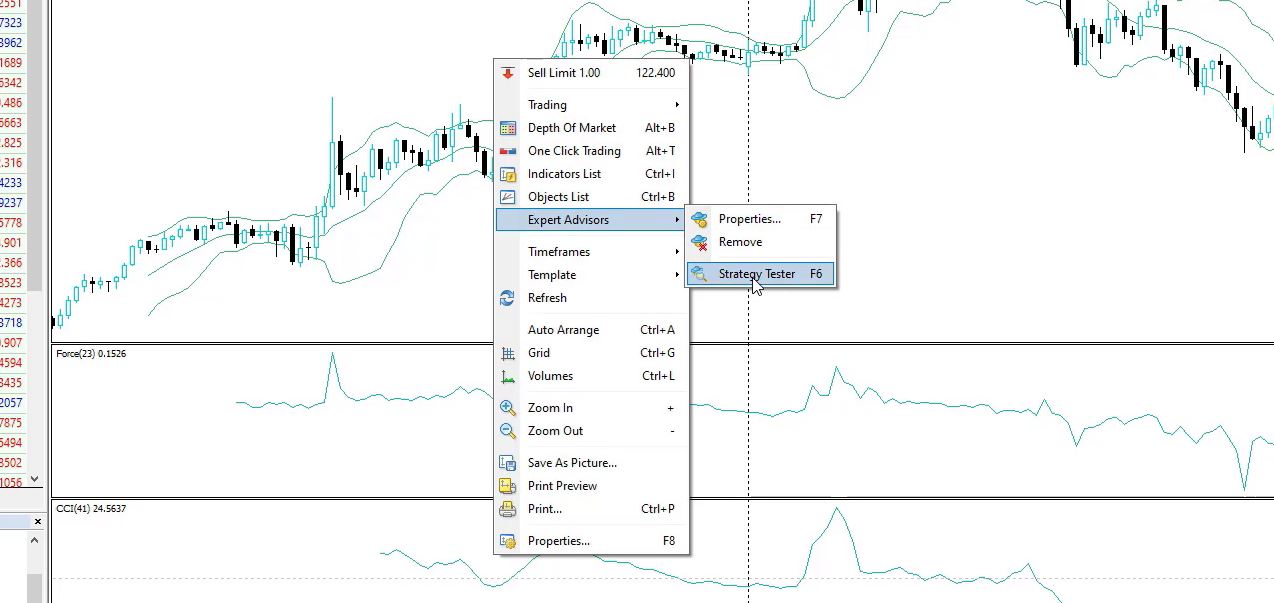
Now, what I need to do is right-click over the chart and go to Expert Advisors and select Strategy Tester.
Go to Expert Advisors, then Strategy Tester
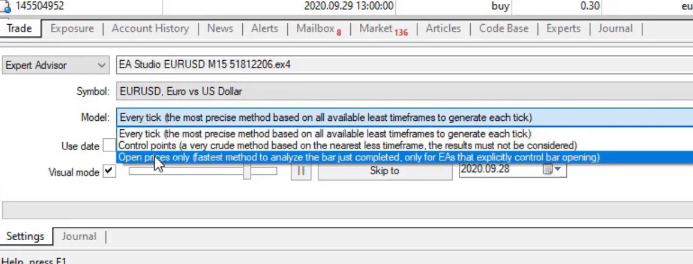
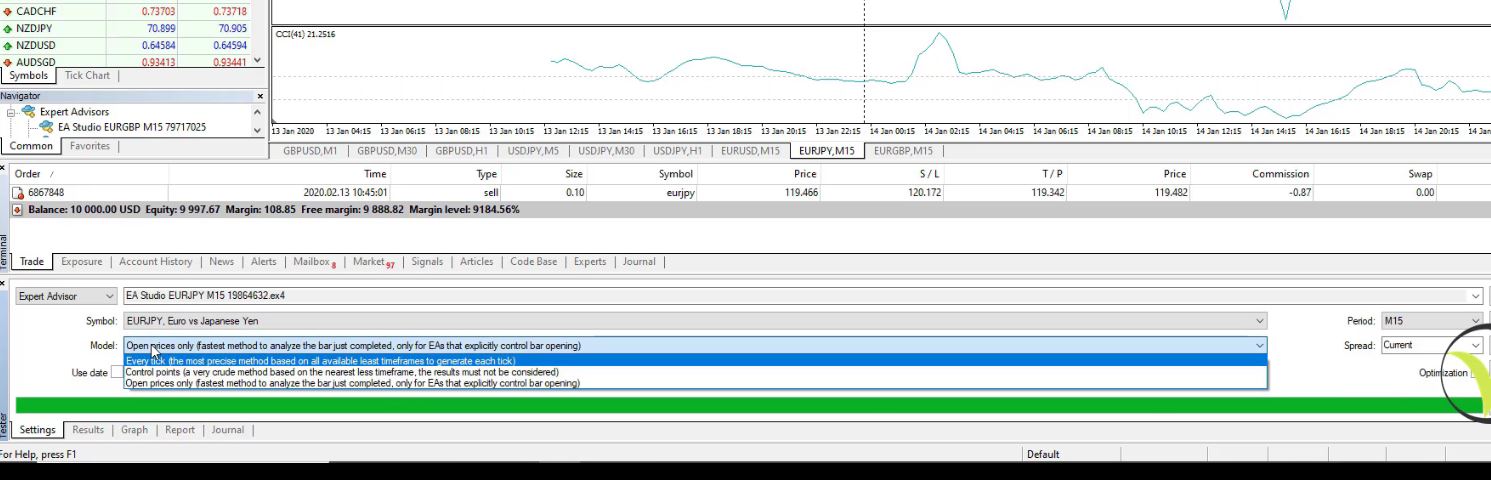
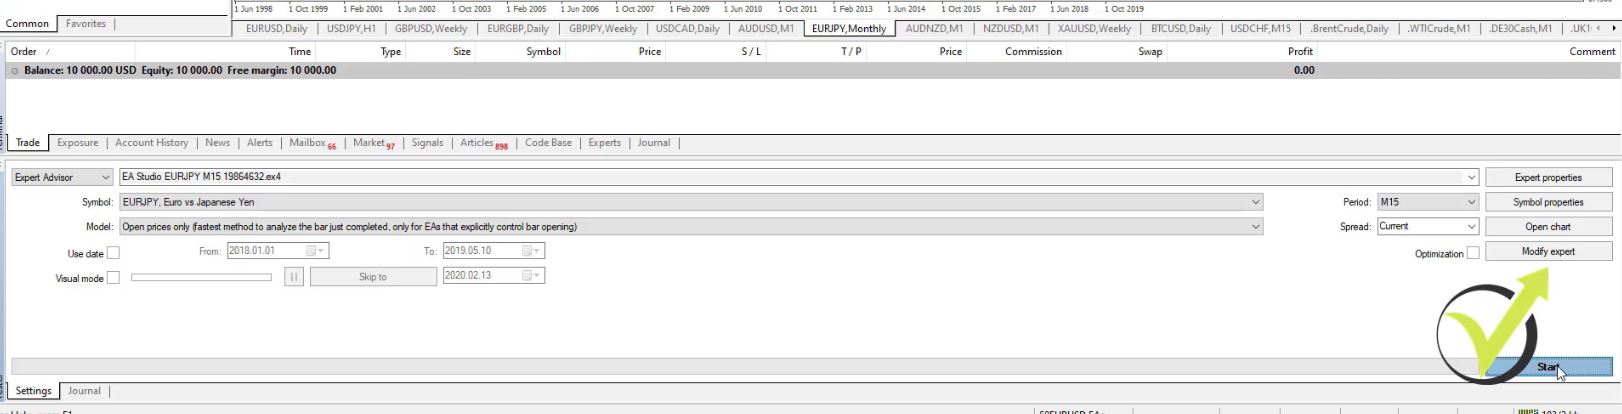
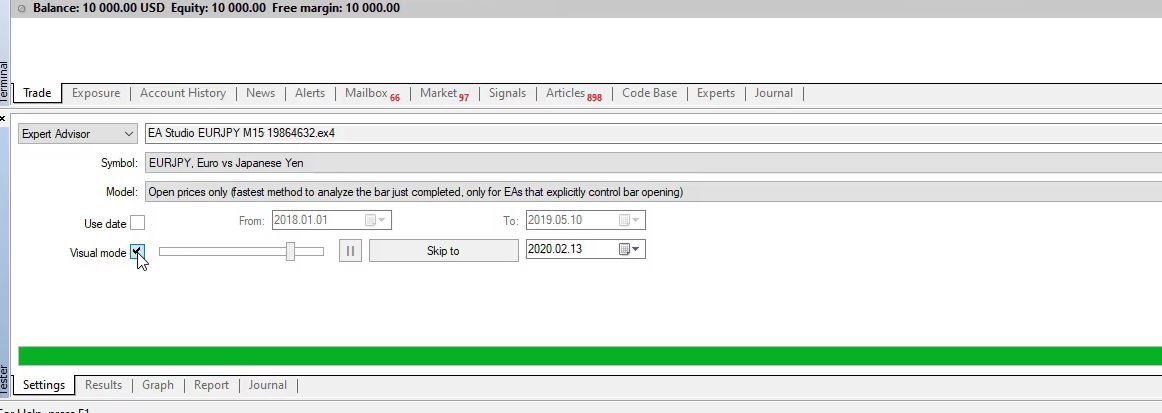
A new window will pop up below the terminal. And there we have the setup for EA backtesting on MT4. Now, what’s very important with the Expert Advisors that are created with EA Studio is to use as Model, “Open prices only”, and usually all the rest is set automatically.
Use Open prices only as Model
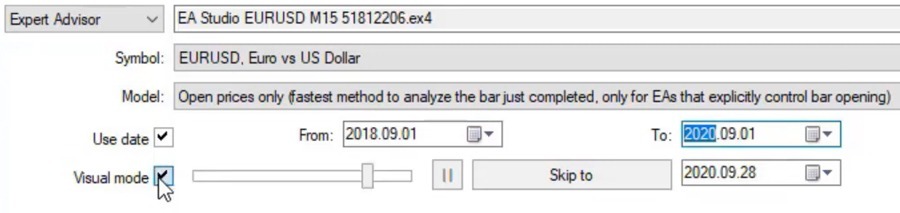
You can see I have the symbol EURUSD and I have a period of M15. It’s up to you if you want to backtest EA online on the current spread or you would like to put a little bit higher as 10, which I usually do, and then we can select the date. Let’s backtest this Expert Advisor for the last 2 years.
So we are in September 2020. I will just go back a little bit to September 2018 so I can backtest EA for 2 years. And then instead of today, I will select the 1st of September 2020. So we have exactly 2 years to backtest EA online. Now, below we have the Visual mode.
Strategy Tester Visual mode
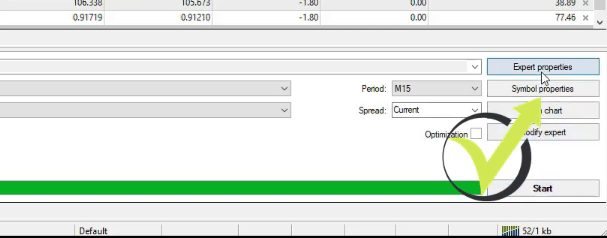
So if you keep it checked, you will see the actual online EA backtest on the MT4 chart. Let’s see how that looks. I really like it, by the way, because it gives you a visual presentation of where the trades were opened and closed. Before I click the start button, you can see there are Expert properties, from where you can change the parameters for the backtest.
Expert properties
We will use 1 complete lot to backtest EA
As we said, let’s make backtest EA online with 1 complete lot.
We will use 1 complete lot to backtest EA
I click on OK, and I click on Start and the chart starts to move. This is since the 1st of September 2018 and the online EA backtest in MetaTrader starts after the first 100 bars, so we will see the first trades opening in a while, or if you want to see it faster, you have the Visual mode from where you can increase a little bit the speed.
What I was saying is that some strategies are more active and they open trades all the time. But that’s not always the best case because we pay more spread to the broker.
Some traders prefer to trade with active strategies. Others prefer to trade with strategies, where the trades happen rarely or we have more confirmations. This strategy is just a normal one, which has 2 entry conditions, as I showed, and 1 exit condition, Stop Loss and Take Profit. I will increase it to the maximum.
It goes fast and the EA backtest is complete. In the end, it shows the indicators that the online EA backtest uses. This is exactly the Bollinger Bands, the Escalator Oscillator. And as well we have the 2 Moving Averages, which in this case are displayed with the same color.
The EA backtest
Over-optimized strategies
Now, below we have a few tabs. One is the Results where we can see all the trades that happened from September 2018 until September 2020. The final balance is at 15 203, which means it’s about 50% of a profit, or that would be $5203.99.
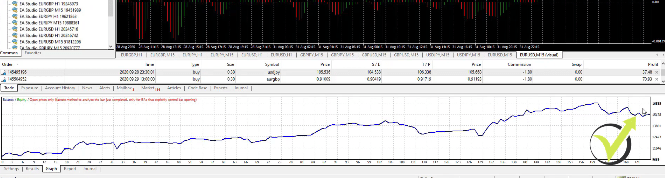
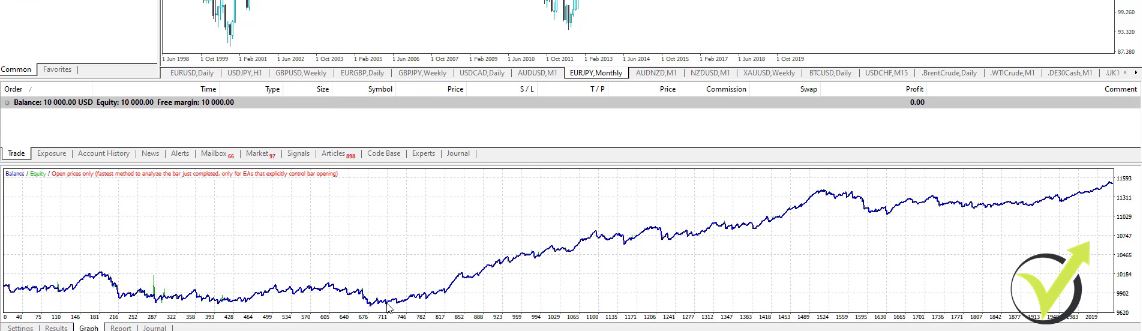
And if I go to the Graph, you’ll see the equity line of that strategy.
Equity line of that strategy
It started at 10 000 and had a couple of drawdowns and stagnations. It reached to 16 555 and it ended at about 15 200. So that’s quite a normal strategy, again I say, an Expert Advisor with profitable periods and losing periods.
And every single strategy has losing phases, losing periods, or consecutive losses.
In other words, we can say that during this time, for example, the strategy was just losing. The market conditions were not appropriate for the strategy. So it did more losses instead of profits. But overall, the strategy is profitable. In the long term, that is a profitable strategy.
And really try not to look for the strategies that have a perfect EA backtest online. These are usually the strategies that the people sell on the market and they are just over-optimized, or in other words, their parameters were fit perfectly for the EA backtest to show you great results. And usually, this kind of Expert Advisors blow the accounts of the traders.
Backtest EA Online – MetaTrader Example
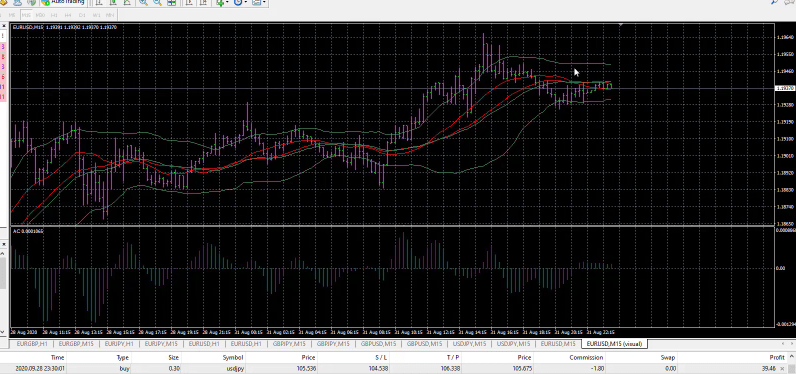
Now, I will show you how to backtest EA online on the MetaTrader 4 platform. And below you can see that I have the first trade opened on EURJPY just very shortly after I placed the Expert Advisors on Meta Trader.
First trade opened on EURJPY
So here you can see the bar opened above the upper band and this time the Force Index was lower than the 0 line and it opened the short trade.
If you’re a beginner trader, it’s important to know that the Expert Advisors do it automatically.
If you are using MetaTrader 5, you can refer to our MT5 backtesting tutorial and learn the basics of backtesting.
While I was recording the previous lecture for the EA Studio and FSB, showing you how these strategies were created, the Expert Advisor opened the trade. And this is really the big benefit of using Expert Advisors. You can do anything else.
The Expert Advisors follow the market, they follow the strategies, and the indicators and the rules, and they execute the trades.
They place automatically the Stop Loss and the Take Profit. I don’t need to do anything manually once the Expert Advisors are placed on the platform. So how can you backtest the Expert Advisors?
One is with the software I showed you, the EA Studio, and the FSB Pro, you can see a very detailed test. But let me explain to you in a few words what is the online EA backtest.
Historical data is important when we do backtest EA online on MetaTrader
So how to perform the EA backtesting? We use the historical data which I mentioned in the previous lectures. These are all the bars that we have before that, all the candlesticks, all of that information.
And to be precise, the information is the value we have for each candlestick, the open, the high, the low, and the close, these 4 values, form the historical data. And all of that information is stored over the chart.
If I press the Home key on my keyboard, I will go back to the beginning. And as I said, when you open a new account with the new broker you will not have a lot of bars.
This is why we have now the Forex Historical Data App which I showed you on our website and you can download many bars from there. Anyway, if not, you will be able just to backtest the EA over a limited amount of historical data on MT4.
What I mean is, if I press the Home key on my keyboard, I go back to the 13th of January. This is just about 1 month and there is no more data. And how do I do the EA backtest on MT4? Right-click over the chart, I go to Expert Advisors, Strategy Tester.
Right-click over the chart, go to Expert Advisors, then Strategy Tester
Normally, it will set the symbol automatically the timeframe, just as a model, make sure to use Open prices only,
Use Open prices only as a model
because we said that these strategies work on the opening of the bar.
A few trades are not enough to depend on a strategy
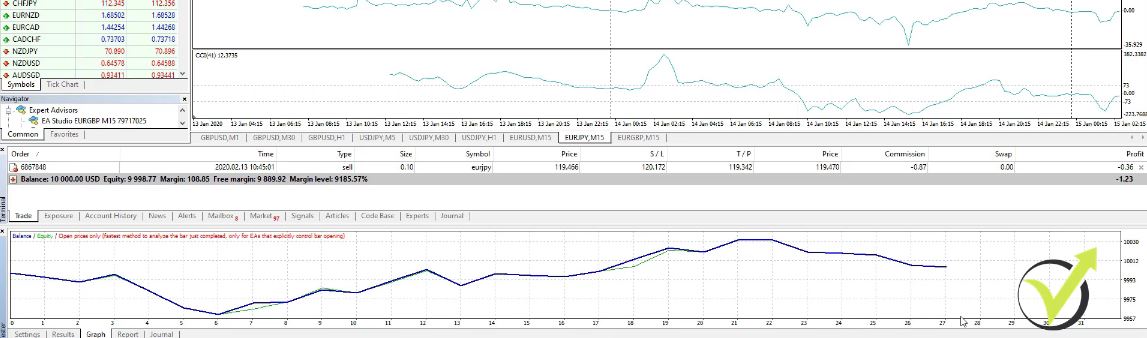
And when I click on Start, there is the graph of the results.
The graph
But this is a very small graph because it made just 27 trades. There is no historical data back in time to see how this strategy performed. And as well, when you’re doing the online EA backtest, you can set the date but if you don’t check it, you will be using the complete period.
Now, here, I don’t have historical data. One of the options to collect historical data is to press the Home key on your keyboard as I said. Let me open 1 symbol that I didn’t do it.
For example, EURJPY, Chart Window. I press the Home key and it loads the data. And if I want to do this for all timeframes, I will need to switch and hold it until it stops moving.
However, still, this has small data as I showed you with the MT4 EA backtest, not enough. So how to make an EA backtest on with more trades?
One thing is you can use our app to download historical data. The second thing is you can collect data. When you leave your Meta Trader opened, with time it will collect the data for you. But this takes normally a couple of months or even years.
Step by step guide to a backtest EA online on MT4
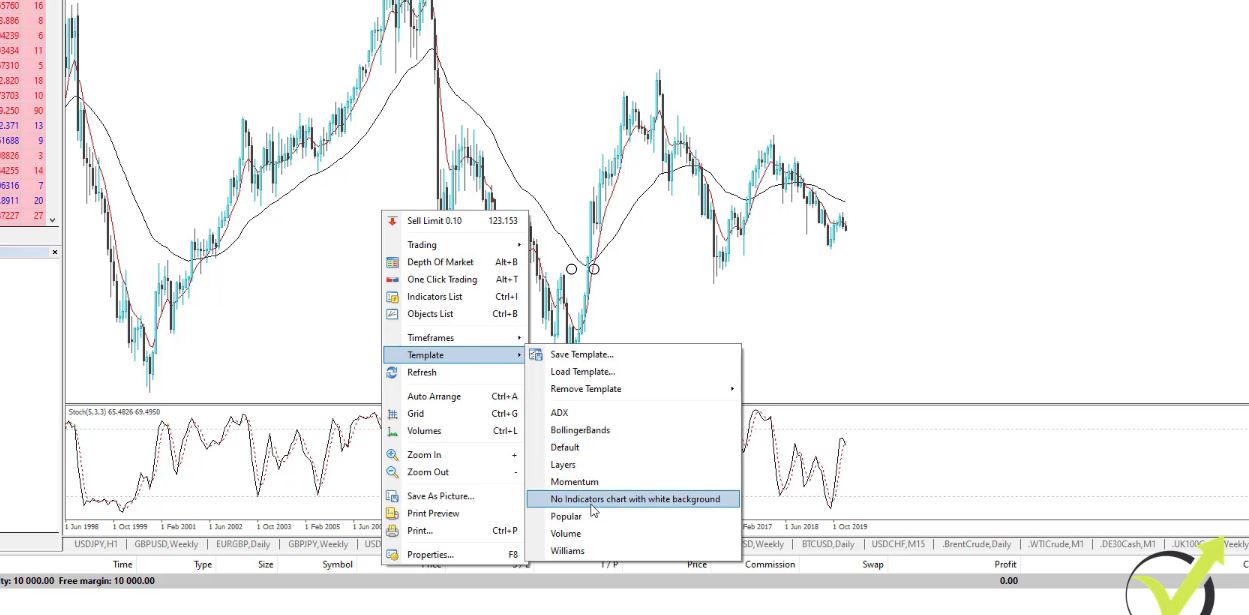
Now, let me show you a backtest on another platform where I have more data because I’ve been running this platform for quite a long time. So it was the EURJPY. Right over here I have some indicators. I will use a Template, No indicators, so it will be a white background.
I will remove the indicators
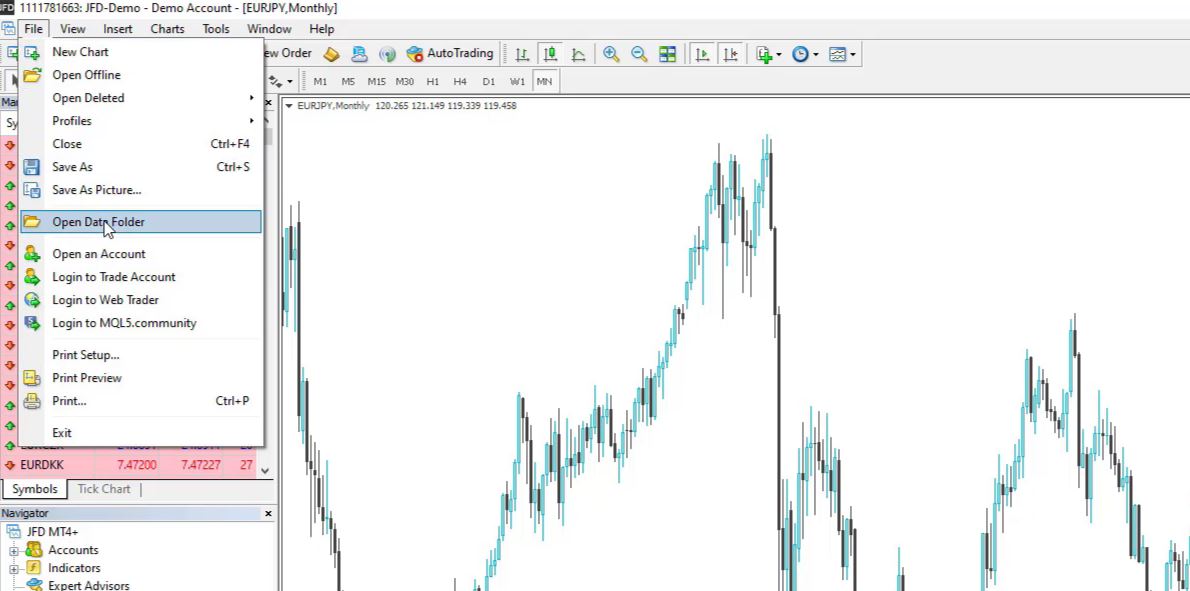
Now, what I will do? I will show you step by step how to make the EA backtest. I need to place the Expert Advisor first. So File, Open Data Folder,
Go to File, then Open Data Folder
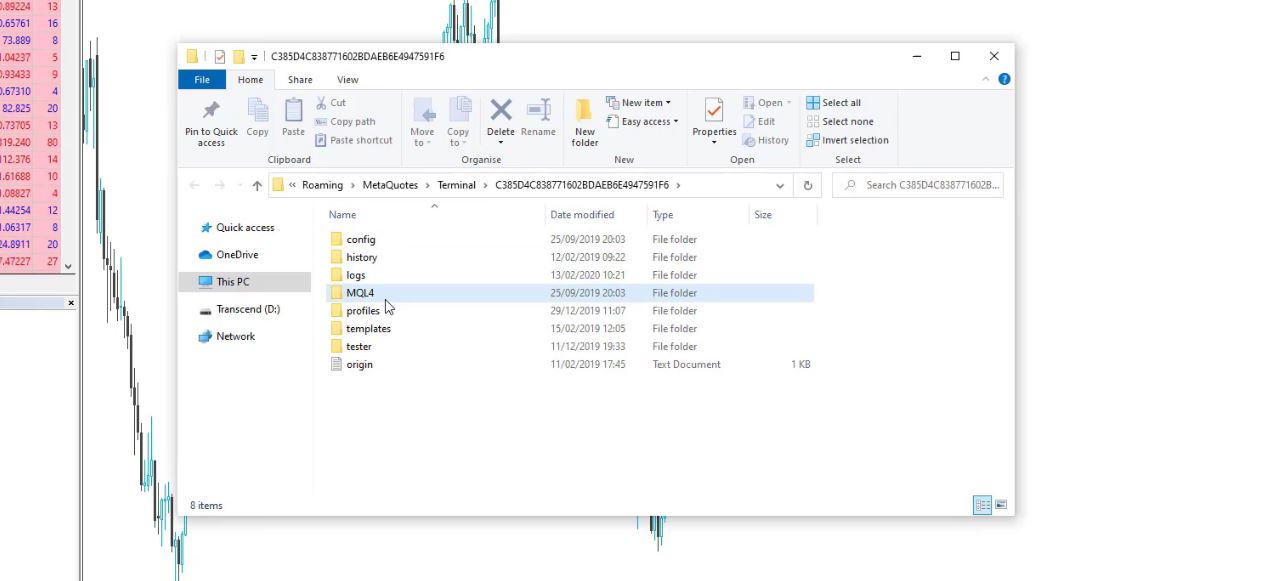
and I go to MQL4,
Go to MQL4
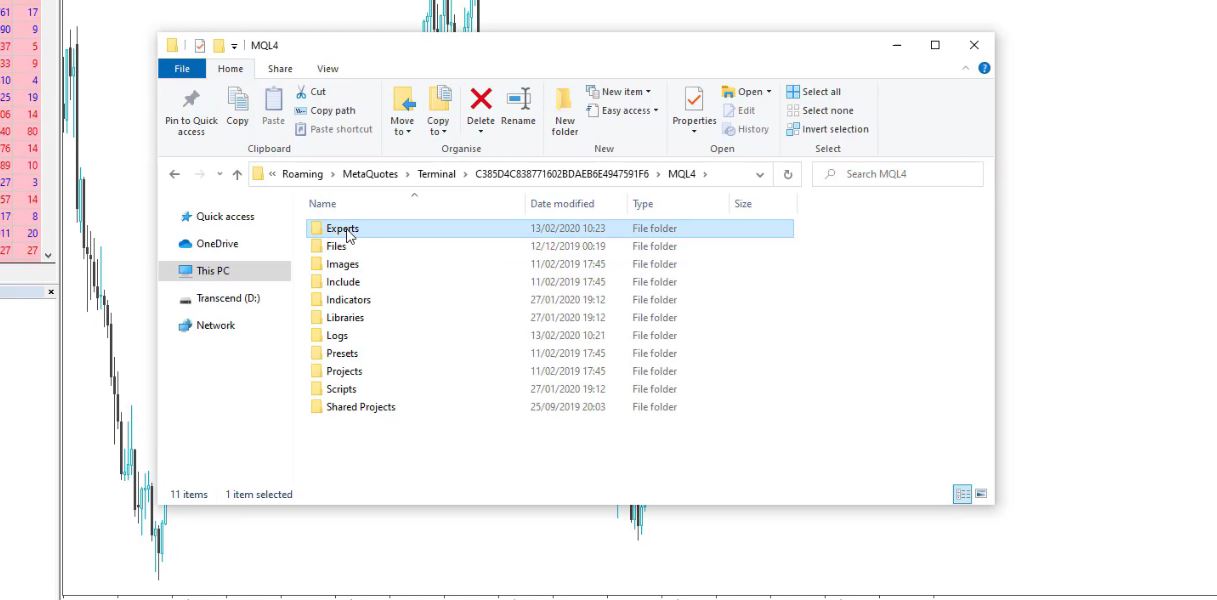
Experts.
Select Experts
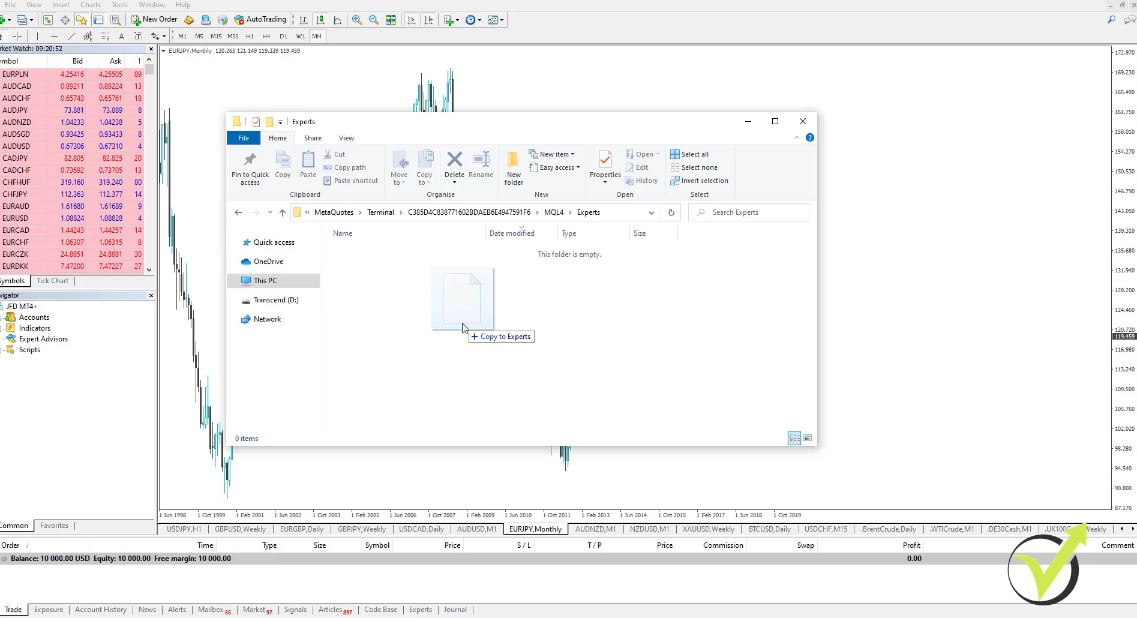
I will place here the Expert Advisor for EURJPY.
I will place the EURJPY Expert Advisor
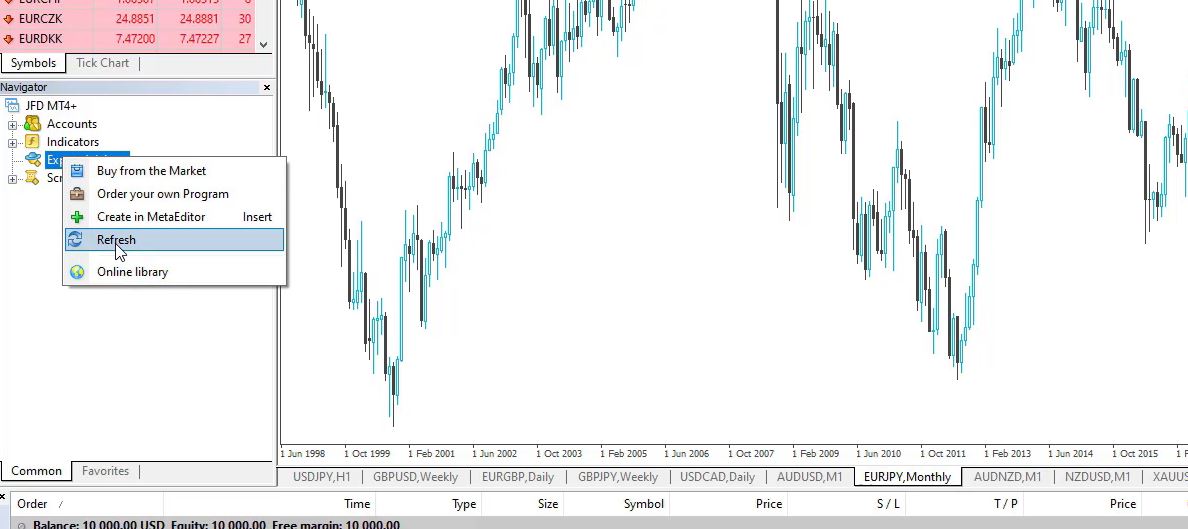
Close the folder then go to Expert Advisors and click on Refresh to compile this Expert Advisor,
Go to Expert Advisors then click on Refresh
I put it over the chart, click on OK.
Drag it over the chart and click on OK
Now, I don’t need to enable the AutoTrading because I don’t want to trade with this Expert Advisor.
I just want to show you how to backtest EA on MT4. Expert Advisors, Strategy Tester, and then I will select EURJPY. It is on the M15 chart, Open prices only, I will be using the complete data I have. I click on Start,
Click on Start
and you will see how the graph.
The graph
I have more than 2,000 trades. So that’s a realistic backtest because I have many trades, not just 10 or 20.
How to make EA backtest in MT4 visual mode?
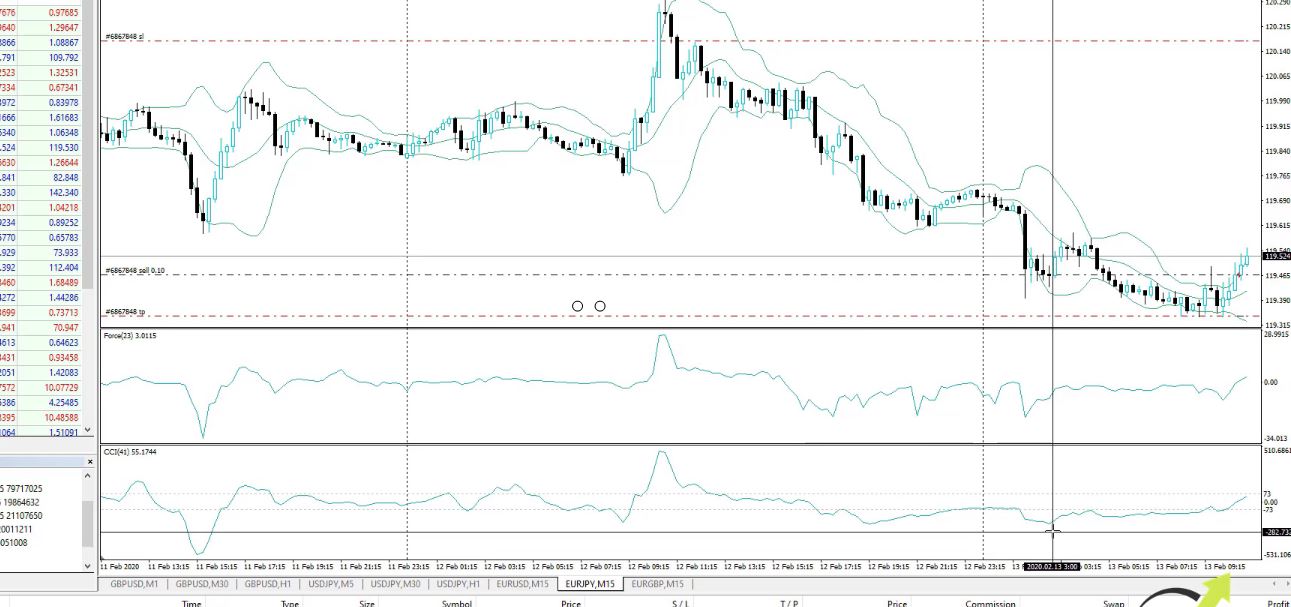
And in results, I can see exactly all the trades that happened, where the trade was opened, where it was closed. Actually, over 2,000 orders but this is for open and close. So it’s about over 1,022 or something like that. So this is how we do the EA backtest in the MetaTrader and there is a visual mode which is very interesting as well.
Visual mode
You can click on it and it will show you how that behaved. How the strategy did.
It shows where the trades were opened, where they were closed. And something very interesting, you can notice how it works when the Take Profit is small, the trades open and they hit the Take Profit quite often.
When it’s open and the Take Profit is very close, it hits the Take Profit or it uses the exit condition to exit the trade. So this is how we do the EA backtest on the MT4 platform.
As I said, the historical data is very important. If I go to the EURJPY on M15 and I press the Home key, I have data since 2014 October. Very different.
So the historical data is important when it comes to how to make a backtest but as well for creating these strategies because the generator on the software, on EA Studio, on FSB Pro.
The programs use this historical data to build these strategies, and to generate these strategies, and to find the best combinations between indicators, Stop Loss, Take Profit, and all the rest which makes the strategies profitable.
You can backtest Expert Advisors online with EA Studio which is much faster
There is much similar software for EA backtesting, for generating strategies, and I’m following, of course, all of them. But for the current moment, EA Studio and FSB Pro are the top products on the market and this is why we have integrated them on our website so it’s easier for our students and our traders to use them.
You can take advantage of the 15 days trial to create your own strategies, to backtest some of the strategies, and just to get some skills in algorithmic trading which I believe are very useful.
Why do we trade many Expert Advisors?
So, one more time to summarize it, every strategy has losing periods and profitable periods, and this is why we trade many Expert Advisors simultaneously. So when one of them is in a losing phase, the others will compensate for it.
This article is based on a free lecture from the MetaTrader 4 Forex Trading course + Weekly Robots course. In the next lecture, I will talk more about trading many Expert Advisors. What are the benefits? And you will see the difference when we are trading with 1 Expert Advisor or when we are trading with many Expert Advisors, you will see how different the backtest is.
So don’t hesitate to make a backtest online for any of the Expert Advisors or to compare a few brokers and see which one will give you a better EA backtest. Because this way, you will know which broker gives more profits.
Thank you for reading the lecture. If you have found it beneficial, leave a comment below and if you want to get more of our free videos, make sure to subscribe to our YouTube channel.
Getting started Forex trading for beginners: learn what is most important to know before you risk real money.
Hello, everyone. In this blog post, I will introduce the very beginner traders to the first steps that you need to take before you start trading on the Forex market. And as you know already, the Forex market could be risky so it is very important to start Forex trading properly.
I will separate the getting started Forex Trading in a few steps so it will be easier. The first step that you need to take is to find a regulated broker that you will be using for your trading. The Forex brokers are huge companies that offer trading platforms. They give us access to the market.
We can open a Demo account, which is virtual, so we can practice trading or test Expert Advisors. Or we can open a Live trading account, which means a real trading account, which we need to fund with money, so we can start trading.
You can look for a Forex broker over the Internet. You will find hundreds or even thousands of websites. But be very careful because obviously there are many scam brokers around that offer, not just bad trading conditions, but most likely you will never see your money again if you fund an account with a scam broker.
Getting started Forex trading with a regulated broker is a must!
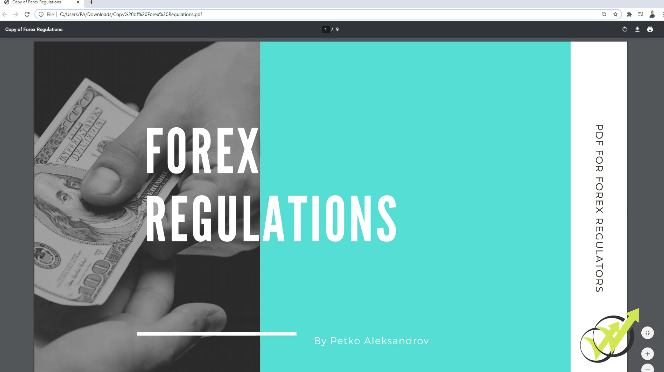
So to make it easier for my students, I will give you more information about the Forex regulations.
The attached Forex regulations PDF
So each broker must have a regulation. Anyway, there is a huge risk that this is a scam broker.
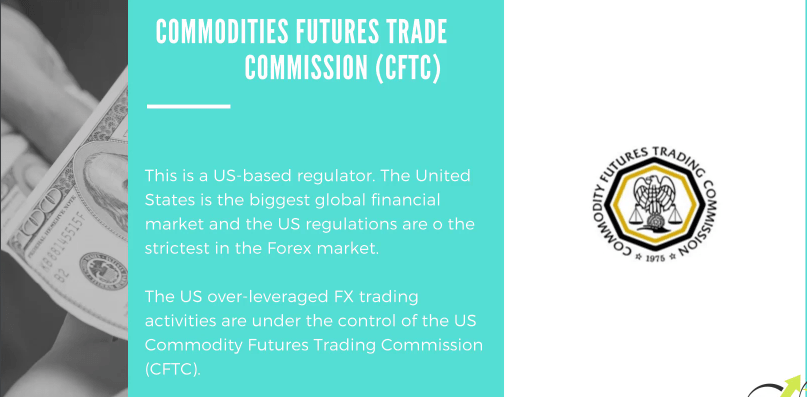
So when you are looking for a broker to look for the brokers that have regulations. We have the Commodities Futures Trade Commission in the US.
The Commodities Futures Trade Commission
We have the NFA again in the United States.
The National Futures Association
FCA is a very strong regulator in the UK.
The Financial Conduct Authority
We have MIFID as well.
The MIFID
So there are many regulators around. But to make it simple, just look for the brokers that are regulated with some of these regulations that I have described.
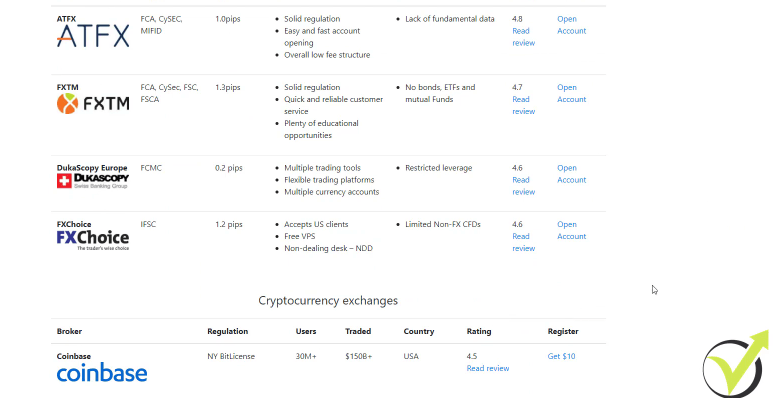
And I usually avoid recommending brokers. That’s a personal choice. It’s up to you. But to make it easier for our students and for the people who have a hard time finding a broker, we have created the brokers page on our website where you will learn more about the regulations, how important the low costs are, the reviews.
Our Brokers page
We test the brokers before listing them on our website
So always look for honest reviews from different traders, forums, blogs, so you can have a better understanding and idea about the broker that you are planning to use. And below, we have listed some brokers that we have been using so far.
The brokers we use
I asked my team to write honest and long reviews for each of the brokers with some PROs and CONs. So we just make it easier for our traders and students to select the broker that fits them the best. And, of course, we are improving this page all the time.
So by the time you are reading this post, if it is after a few months or after a year or two, it might look different with other brokers or more brokers. But, of course, before listing any of the brokers hon the page, we do our best to test them.
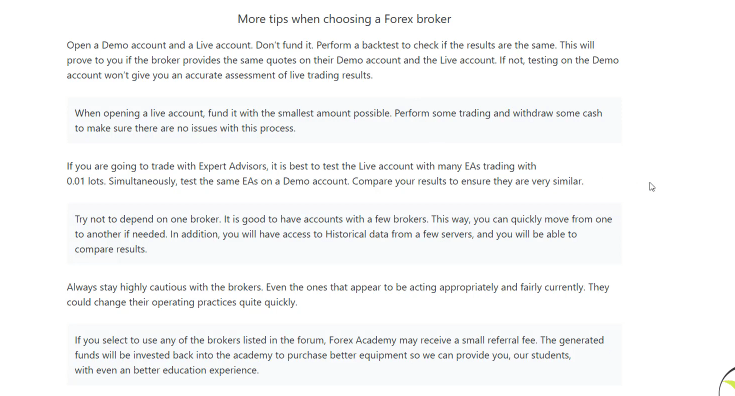
So we make sure that our students are using regulated and suitable brokers for algorithmic trading. Below, you can find some more tips when choosing a broker that will be helpful to you if you are doing it for the first time.
More tips
And keep in mind that I use many brokers but if you are just starting Forex trading then one broker would be just fine.
Getting started Forex trading with a Demo account
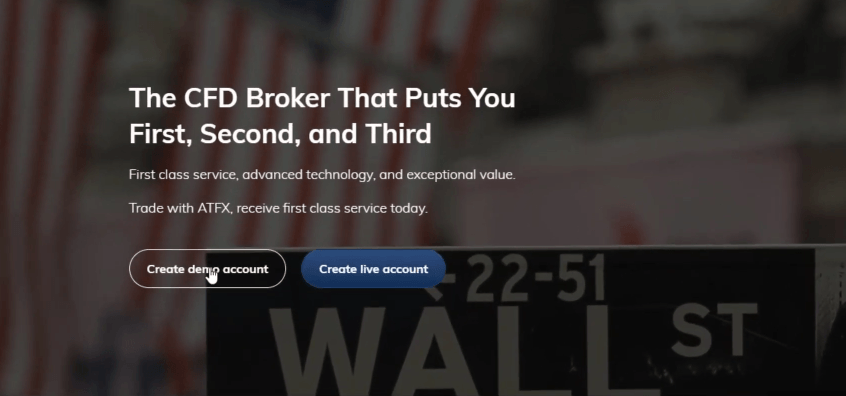
But, one more time, don’t take it as a recommendation. It’s up to you which trading broker you will be using. Now, let me show you quickly how you can open a Demo account with a broker, which is very similar to most of the brokers.
I will click on create a Demo account,
Click on Create Demo account
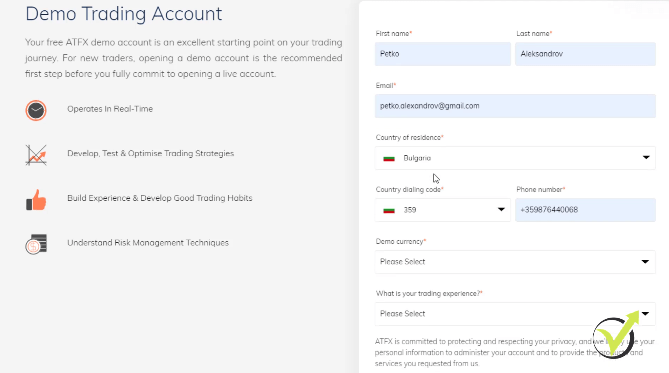
and you see that I have the blank where I will need to enter some personal details.
Fill the blanks
My name, e-mail, country, phone number. I guess here I will need to remove the code because it’s already selected after my country was selected, then I would like to have my account currency in Dollars.
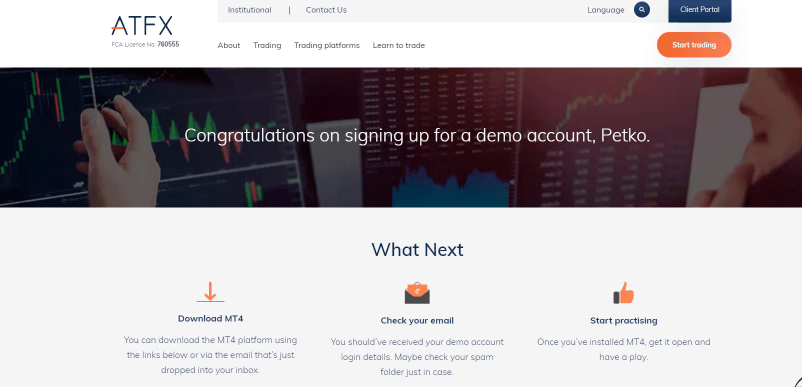
And what is your trading experience? Then you need to submit and confirm that you agree with their terms and conditions and then you just create your account. Pretty much that’s it. And after that, I have the confirmation that the account was created and it says that I need to check my e-mail.
The confirmation
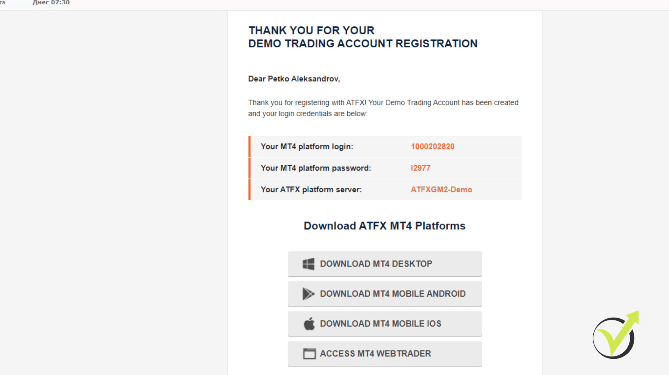
Below you will see how the getting started Forex trading Demo account e-mail looks like.
The confirmation e-mail
And it’s very similar to most of the Forex brokers. So I have the login information and then I have the password and then I have the server of the broker and below I have the links from where I can download the trading platform.
Is it possible to have two Demo accounts at the same time?
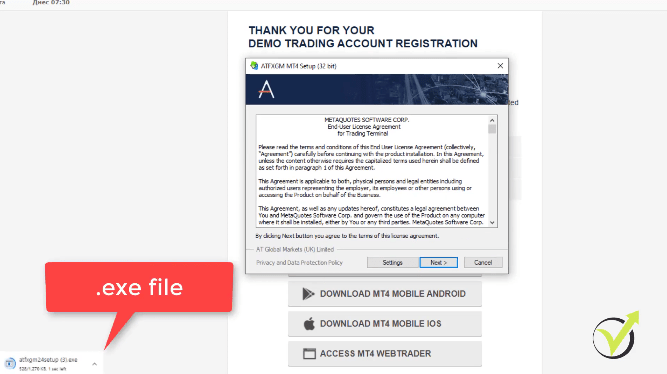
So I will click on Download MT4 for desktop. And if I click on the EXE.file, you will see that a small menu pops up and the installation is very quick.
A small menu pops up when I click the EXE. file
And I will click on Settings to give you a few tips if you are installing a few Meta Trader platforms.
So to make it clear from the beginning, if you want to test many Expert Advisors on a Demo account and to put the top Expert Advisors or the best-performing ones on your live account, you will need to have 2 different Meta Trader platforms installed.
You cannot switch from Demo to Live account on one and the same platform because if you are on Demo and you switch to your live account, you will disable your Demo account and vice-versa. If you are on your live account and you switch to Demo, you will disable the Expert Advisors on your live account.
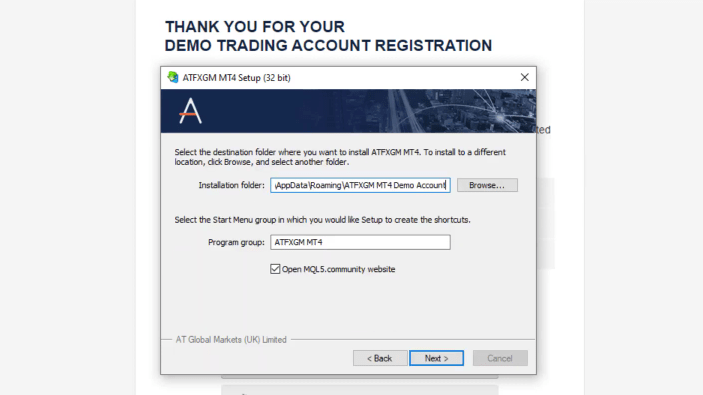
This is a common mistake that beginner traders do. So I wanted to make it clear from the beginning while I’m installing the trading platform and if I click on Settings, I have the option to choose the installation folder.
Make sure to install two different MetaTrader platforms.
For example, I can write down ATFX GM MT4 Demo account. And if you want to install another platform for your live account or for a second Demo account from the same broker, just use the same EXE.file and change the installation folder.
Because if you use the same installation folder, you will just overwrite the platform.
The setup settings
And then you click on next and it takes just a couple of seconds to see the new platform installed on my computer. And here it is. I click on Finish and you will see the new platform opening in a second.
It usually brings you automatically to the MQL5 website, which is the official website for Meta Trader. Meta Trader platform was developed by the MetaQuote company and the brokers pay the MetaQuote company for providing the Meta Trader platform to us the traders because we are clients to the brokers.
And by the way, if you are trying to download Meta Trader 4 from the official website, it will download Meta Trader 5 for you. There are 2 versions – Meta Trader 4 and Meta Trader 5. The company is trying to push all the traders towards Meta Trader 5, but Meta Trader 4 is still the more preferable platform and most of the traders are still using it.
The MetaTrader platform is perfect to get started with Forex Trading.
I still use Meta Trader 4, so here it is a brand new platform installed and all I need to do now is to log into the account that I have just opened.
The Meta Trader platform
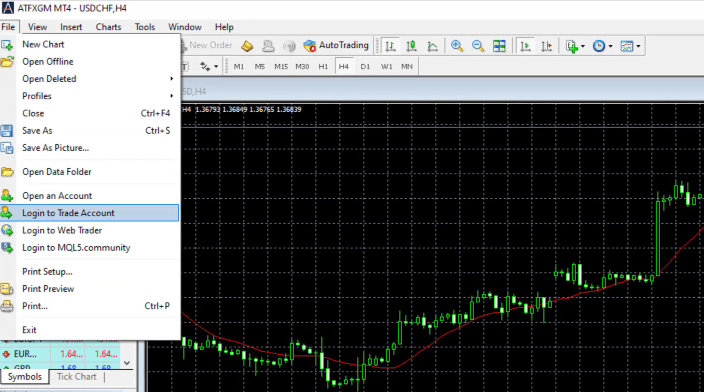
So I will need to go to File, and click on Login to trade account.
I go to File and select Login to Trade Account
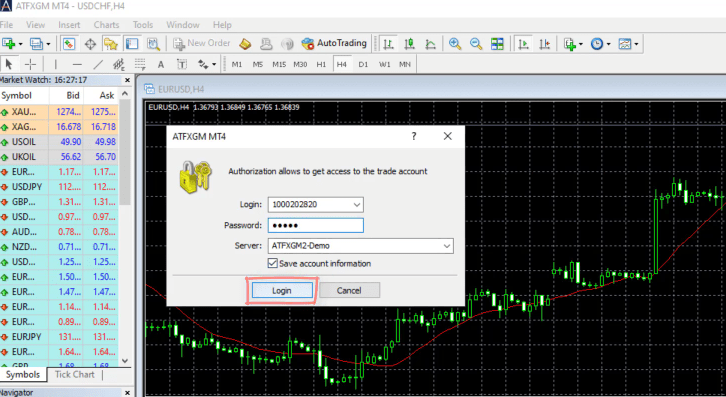
So right here I will just paste the login details and the passwords and the server.
I paste the login details and the passwords and the server
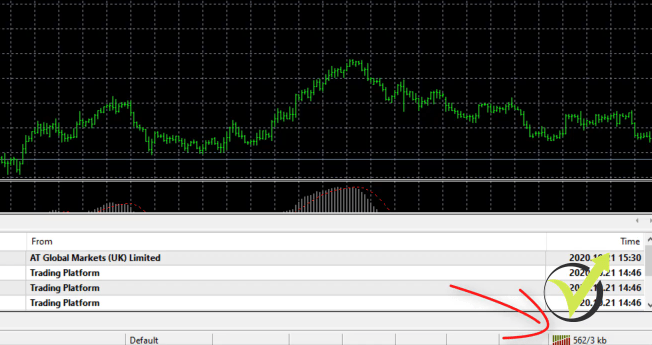
It is automatically fulfilled and I click on login and in the bottom right-hand corner you will see that I am already connected to the server of the broker.
I’m connected to the server of the broker
OK, and on the left side you will see that all the quotes or this is the market watch where we see the assets, the prices start to move.
The Market Watch
They change from red to blue, which means that I am simply connected to the server of the broker. This is how easy it is to open an account with a trading broker, a very similar process with most of the brokers. Now you are ready to get started Forex trading in a virtual environment which is the right way to go.
If you want to learn more about MetaTrader have a look at that video:
Volume trading strategy that works great for the Bitcoin
In this lecture, I will show you a Volume Trading strategy for Bitcoin, which I use on an hourly timeframe, and I call it the VAM. I have 3 Indicators as entry rules, I have 1 Indicator as an exit rule, and I have a Stop Loss and a Take Profit.
So I will start with the 1st one. I will open a new chat window.
I right-click and select Chart Window
I will right-click and go to Template, and I will select a Black background.
I right-click and go to Template, and I select my Black background template
Then I will change it to the hourly chart. The 1st Indicator that I will insert on the chart is the Volumes indicator.
I go to the Volumes group, and the last one is just Volumes. Click on it.
How to insert Volumes
And as levels, I will add a level of 5300 and I click on OK.
Volumes levels
You will see the Volumes indicator below the trading chart, and you can see the level of 5300.
Volumes
So the entry condition to buy is when we see the Volumes crossing the level line upwards.
For example, you see below that it is crossing it.
The cross
After that, again, it crosses it upwards and this is our entry-level or simply when the Volume increases. But we have an exact rule using the 5300 level and we have 2 Indicators as confirmation.
The confirmation for the Volume Trading strategy
The 1st one is a Moving Average. I go to Trend, and I go to Moving Average.
How to insert a Moving Average
I will set a period of 31 and I click on OK.
Moving Average parameters
Here it is.
The Moving Average
We want to see the Moving Average rising to have the confirmation. So when the Moving Average is falling like the case seen below,
Falling Moving Average
if we have the break as seen, we have the Volumes crossing the level line, but already the Moving Average is falling down.
So we don’t have confirmation to buy. For this Volume Trading strategy the 3rd Indicator is the Awesome Oscillator, which needs to be rising again. Indicators, and I go to Awesome Oscillator.
How to insert Awesome Oscillator
I click on OK.
I click on OK
It doesn’t have any levels or parameters. It’s formed by red and green bars that are going above and below the 0 line. Alright, so the confirmation here is that we need to see the Awesome Oscillator rises.
So, one more time, we Buy when the Volumes crosses the level line upwards. But at the same time, we need to see the Moving Average rises and we need to see the Awesome Oscillator rises.
It doesn’t matter if it is below or above the 0 line. For example, at the current moment, we don’t have it crossing the level line and it just stopped. We don’t have the entry. I will go back through the chart, and now we are on H1.
Every strategy has losing trades at some point. So this Volume Trading strategy for Bitcoin.
Make sure you follow the first 2 strategies on M15, and the 3rd one is on the H1 chart. I will try to see some examples with confirmations and as well I will try to see some examples of losing trades because, with every strategy, we have losing trades as well, Keep that in mind. This is very normal.
But obviously, I include in my courses the strategies that have more profitable trades than losing trades or overall, they have profitable equity lines for the moment. And I think we would have the confirmation.
When the Volumes crosses the level line, we have the confirmation. The 1st crosses, and then we have another one. But at this time, the Oscillator is already falling. I will zoom it in so we can see a little bit better.
The 1st time we have the cross is at this bar shown below, the Volumes crosses the level line upward.
The cross
On the opening of the next bar, we are taking the trade because the Awesome Oscillator rises as well as the Moving Average. Again, we take the trade when the new bar opens.
Stop Loss and Take Profit in this Volume Trading strategy
When this bar is closed and the new one opens, we see that we have a cross and on the opening of the next one, we take the trades. What you need to keep in mind here is that when the new bar comes, the Volumes start from the ground.
So if I go to the current moment, you will see that the bar opened about 8 minutes ago and it starts to increase the Volumes. When the new bar opens, it starts from 0. And then according to the Volumes that we have, it will increase. Below is the entry.
The entry
This is the cross. And on the opening of the next one, we take the trade. We don’t know if on this current trade there will be Volumes higher than the level line. The signal is with the previous candlestick. This is very important to note.
At the same time, we have the Moving Average rising and we have the Awesome Oscillator rising. So we have 2 confirmations to buy. For this Volume Trading strategy, we have a Stop Loss of 215 USD and a Take Profit of 240 USD. Let me put the lines exactly.
The entry
The entry is 10 362 and Take Profit of 240, which will make it 10 602.
Take Profit
Then we have a Stop Loss. I will make the Stop Loss red and I will drag it 215 USD lower. We have the entry at 10 362 minus 215. This is 10 147 if I’m not wrong.
Stop Loss
I’m trying to put it exactly, but it’s hard because I am on the hourly chart, so it’s 10 147. I’m not calculating the cents, just the USD. But as I’ve said, if you are doing actual trading, you need to calculate it, obviously.
So this is the entry. This is an aggressive move and the price hits the Take Profit of 215 USD very quickly. And we are out after 3-4 hours with a great profit. So this strategy indicates the volatility or the volume, and it uses the Volumes indicator and it uses confirmation of Moving Average and the Awesome Oscillator.
It’s a really great strategy. Now, we have an exit condition as well. This is with the Envelopes. I will put the Envelopes. With the other strategy, we had the Envelopes as an entry, but here there is an exit and I will keep them both aqua color.
The exit rule
But here I have a period of 24 and a deviation of 0.8 and I click on OK.
Envelopes parameters
You will see the Envelopes going upwards together with the price in this case.
The Envelopes
And the exit rule here is that we need to see the bar opens below the upper band after opening above it. It’s pretty much the same thing.
We want to see the price outside the band. And when it gets inside, we see a bar opening. This is our exit. We enter, the price goes outside the Envelopes, and on the 1st bar that opens inside the Envelopes, we take the profit or we close the position, even if it is a loss.
But with this example, we had the Take Profit hit first. It’s very important to note that we are selling with the opposite confirmation from the Awesome Oscillator and from the Moving Average, but the Volume stays the same. When we Sell, I will remove all of the lines from this example.
When we sell, we use the Volumes, again, crosses the level line upwards because we are looking for the volatility no matter whether we are buying or selling. But for the selling, we need to see that Awesome Oscillator falls and as well the Moving Average falls. I think below we have a great example of a sell trade.
A sell trade
You will get used to the Volume Trading strategy in due time
Let me put the mouse on that right here. OK, I’m used to the strategy, so I see it very quickly, but I’m sure after some time you will get used to it. And here is the first cross. OK, you can see the Volumes. The value is 5503 on the closing of that bar. On the opening of the next one, we should take the trade.
And in this case, we are Selling because the Moving Average starts to fall. If I put the mouse on the Moving Average, you can see that on this bar, the value of the Moving Average is 10 924.80. And on this bar, it is already 10 922.97. OK, it’s a smaller value. Same thing with the Awesome Oscillator.
Tthe value is 23 979 and here it is 9207. OK, it’s falling and this is a Sell trade. You can see very obviously we would make a great profit 1st with the Take Profit and 2nd with the exit condition from the Envelope. So the 1st bar that opens inside I think is this one.
We could be taking our profit if we use the exit condition. But first, I’m pretty sure that the Take Profit would be 240 USD lower. So the entry is at 10 995 minuses 240, that would be 10 655.
I have tested the strategies over a long period of time
But these strategies that I’m showing you, I have tested for quite a long time and they have so far more profits than losses and I always improve them if it is needed accordingly to the market conditions.
Proper money management is required
OK, so if it happens that you have losing trades and it will happen no matter you trade manually the strategies or automatically with the Expert Advisors, don’t panic. This is normal. The strategies have their losing periods. But as I’ve said so far, they have more profits than losses.
And this is why it is very important to have good money management and to risk a small amount of your account. But this is something that I will be talking about at the end of the course. All right, guys, so this is the VAM strategy.
The VAM strategy
This is how I call this Volume Trading strategy for Bitcoin because I use Volumes, Moving Average, and also Awesome Oscillator. So it is VAM. This is how I have named it because of the 3 entry Indicators that I’ve been using and I have Envelopes as an exit Indicator. All right. You will find this PDF attached to this lecture and as well for the others.
And one more time, when you are taking this course, the values could be different because the market changes. So the strategies change and I do my best to improve them all the time.
Thank you for reading. And I will see you in the next one where I will be showing you another strategy for the Bitcoin for H1 chart.
In this Pepperstone review, we will look at the main features of the Pepperstone broker and the Pepperstone MT4 platform. We will review the types of accounts offered, Pepperstone account funding, and withdrawal. We will also take a closer look at the regulations under which the Pepperstone broker falls.
Pepperstone broker was founded in 2010 by traders for traders with a focus on global outreach. In the 10 years that they have been operating, Pepperstone broker has grown to be one of the largest MetaTrader brokers in the world.
Pepperstone broker website
They have over 57 000 clients, and their daily average transaction size is 12.55 billion dollars. Bellow, you will find all the information you need to decide if Pepperstone broker is the right broker for you.
General Information About Pepperstone Broker
We cover a lot of information in this Pepperstone review. Below you will find a concise summary of all the general information you may want to consider. You will also find the name of the section where can read more information about the said topic.
Pepperstone Regulation and Security: Pepperstone broker is regulated by two tier-1 regulators and two tier-2 regulators. This makes them an extremely secure and trustworthy Forex broker.
Pepperstone Fees: Pepperstone’s fees depend on whether you open a Standard or a Razor account. With a Razor account, you can be eligible for their Active Trader Program, which can further lower your trading cost.
Pepperstone Trading Possibilities: Pepperstone trading platform offers over 150 different trading instruments, including 61 Forex currency pairs.
Pepperstone Account Types: There are two main Pepperstone account types; they offer all the same features but differ in relation to fees.
Trading Platform: Pepperstones Broker allows traders to trade with both MetaTrader 4 and MetaTrader 5 in addition to cTrader. We will dive deeply into the Pepperstone MT4 platform.
Features: There are three main features that Pepperstone broker offers: Smart Trader Tools, cTrader automate, and social trading partnerships.
Research and Education: Through both in-house sources and partnerships. Pepperstone broker offers relatively extensive research and basic education for new traders.
Customer Support: Pepperstone has 24/5 customer service, through email, live chat, phone, or webform.
Promotions: You can become a premium trader if your trade volume is high enough. This gives you access to even more features and benefits.
Getting Started with PepperstoneBroker: They have four-step account creation and verification process that will also take you through funding your account.
Deposit and PepperstoneWithdrawal: Their deposit and withdrawal process is streamlined. Pepperstone broker offers a wide range of options for you to choose from when it comes to methods of withdrawal.
Before making your decision you can compare the trading conditions with other regulated brokers on our Trusted Brokers Page.
Pepperstone Regulation and Security
One of the most important factors for most traders is security and regulation. Part of Forex trading is investing your money. You need to trust that the company you invest in will keep your money and information safe. And that it will give you your profits in a secure and timely fashion.
One of the best ways to guarantee that your trading broker is a secure one is by looking into the regulator groups that they are a part of. Now, just because a group is not a part of a regulatory group does not mean that it is not safe, but the regulators do offer extra security.
Pepeprstone Group LTD (the parent company of Pepperstone Broker) is based out of Australia. Therefore it falls under regulation by the Australian Securities and Investments Commission of the ASIC. This is a tier-one regulation – the highest level of regulation that there is.
In addition to the ASIC, the Pepperstone Broker is also regulated by the tier-1 group, the Financial Conduct Authority. It also falls under regulation by two other tier-2 regulators. Being a part of these different groups means that they have to adhere to certain standards. This includes strict AML (anti-money laundering) requirements, KYC (know-your-client) procedures, and completing intensive audits. Due to all this, Pepperstone broker is considered to be a low-risk broker.
Pepperstone Review – Fees
Pepperstone fees vary depending on the account type
Brokers are in the business of making money, so there is always some form of fees. The type of fees you end up paying depends a lot on what sort of account you open up. There is more information on the different types of accounts in the Account Options sections. No matter which account you end up with, the Pepperstone fees are competitive.
Razor Account
The Razor accounts use a commission-based pricing structure along with prevailing spreads. In the Razor Account, the average EURUSD spreads are 0.16 pips. Even with the 0.70 pips commission, the Pepperstone all-in cost of 0.86 pips on both MetaTrader 5 and cTrader is comparable to the industry average.
Standard Account
Standard accounts are commission-free, but their spreads are higher and therefore not as competitive as the Razor account. With the standard accounts, average spreads (EUR/USD) are 1.16 pips, which is higher than the Razor account all-in cost.
Active Traders
Pepperstone has what is known as its active trader program, which rebates portions of the spreads. Based on your monthly trading volume and the tier you are a part of, you may be eligible for rebates.
United Kingdom: If you are in the UK, you must trade at least 15M dollars per month or 150 standard lots to be a premium client. If you meet those requirements, you may be able to receive tier-1 rebates (10% per lot). On the other hand, if you do more than 500 lots monthly, tier-3 rebates can be negotiated.
Australia: If you live in Australia, you must trade a minimum of 200 lots to qualify for the lowest tier or rebates. Tier-1 qualifies you for rebates of 1 dollar per lot, effectively reducing a spread to 0.65 pips from 0.75 pips. Furthermore, if you trade more than 200 lots monthly, you may be eligible for tier-2 rebates of 15% or more. This can reduce a spread to at least 0.638 pips.
If you want to compare the Fees with another regulated broker, and you do not want to pay commission, you can check out the Recommended Brokers we have on the website.
Pepperstone Trading Possibilities
During this Pepperstone review, we found that the broker has an extremely wide range of trading possibilities. They offer over 150 different instruments in Forex, equality and index CFDs, cryptocurrencies, and commodities.
The primary focus of Pepperstone broker is Forex trading, with 61 currency pairs in that field alone.
This means that if you focus on Forex trading, you should be able to easily diversify your portfolio and find all the opportunities you are looking for.
Major Currency Pairs
If you are interested in CFDs in addition to Forex trading, there are fifteen different commodity CFDs (soft and hard) that will allow you to branch out. But if you are really wanting to explore this field, you may find yourself limited with Pepperstone broker. Especially if you are interested in metals beyond gold, silver, platinum, and palladium.
Even their additional 64 equity CFDs and 15 index CFDs may feel limiting to advanced traders but perfect for traders simply looking to expand a little.
Finally, you can trade all of the five major cryptocurrencies through the Pepperstone platform. This is typically what most people look for unless they have strong experience or they are devoted cryptocurrency traders and enthusiasts.
Pepperstone Account Options
This Peppestone review will cover the two main account options at Pepperstone broker – the Standard account and the Razor account. It is important to recognize that the fundamental features of these two accounts are the same. So you are not really choosing between features. Rather, when you are making your decision between accounts, you need to focus more on the fee structures.
The Standard accounts have more prominent spreads, but they remain commission-free. On the other hand, Razor accounts offer you narrower spreads (by a significant margin); however, they do require a commission (seven currency units of the account currency per lot).
Both the accounts are competitively cost-effective. The Razor account, despite having the commission, is definitely the most competitive out of the two account options at Pepperstone broker. Additionally, there is no minimum deposit.
As far as the leverage, that depends on where you are trading. If you are a part of the Australian branch, the maximum leverage available to you is 500 to 1. On the other hand, if you are a part of the United Kingdom branch, the maximum leverage available to you is 30 to 1.
Pepperstone Trading Platforms Review
Pepperstone broker offers three of the most popular trading platforms that there are. First, Pepperstone offers MetaTrader 4, the most popular trading platform at the moment. Some traders are moving on to the newer platform known as MetaTrader 5, which Pepperstone also offers.
MetaTrader trading platform
Finally, Pepperstone broker offers cTrader, which is the ECN trading platform. You will be able to access all three of these platforms through a desktop, a WebTrader, or a mobile application, which does set it apart from some of its competitors if you want access to your trading from your mobile device.
There is some important information considering which Pepperstone brokertrading platform you want to use. First of all, it is worth noting that while all three trading platforms do support automated trading, Pepperstone MetaTrader 4 is far better than the other two options in that category.
Pepperstone MT4 also stands out with back-testing and other useful add-ons that. It is also worth noting that the Pepperstone cTrader platform does outshine both the Pepperstone MetaTrader 4 and Pepperstone MetaTrader 5 platforms if you are looking at the fundamental models, but the upgraded Pepperstone MetaTrader 4 is competitive.
When you are choosing between trading platforms with Pepperstone broker, you will not have to choose between features and tools offered by Pepperstone broker in addition to the trading platforms. Pepperstone broker offers its Smart Trade Tools with MetaTrader 4, MetaTrader 5, and cTrader Automate.
Pepperstone MT4 Review
Now, we will go briefly over the Pepperstone MetaTrader 4 platform.
After you download and install the Pepperstone MT4 platform and you are logged into your account, you have the connection to the server of the Pepperstone broker, you see the prices moving, you are pretty much ready to trade.
However, if you are using MetaTrader for the first time, you can follow this Pepperstone review along. Now, when we installed the platform, it had by default 4 charts, 1 for EURUSD, USDCHF, GBPUSD, USDJPY.
The default charts in Pepperstone MT4
And most of the brokers will give you some default layout, but you can change pretty much all of that.
So, for example, if we want to tile the windows, we can right-click and go to Tile Windows, or that it will be an Alt + R combination on your keyboard.
Click on Tile Windows
You see the 4 windows are displayed equally on the screen.
And I can change any of these currency pairs as well, simply by drag and drop the currency pair I want to trade.
The 4 windows are displayed equally on the MetaTrader screen
The Market Watch
So for example, if I want to trade USDCAD instead of EURUSD, I can just drag and drop it over the EURUSD, and I have now the USDCAD.
On the left side, we have the Market Watch where we see all the trading assets.
The Market Watch in Pepperstone MT4
And if you don’t see all of them, what you can do is simply right-click over it and go to Show All. This will display all the assets that the broker provides.
Click on Show All
And if we scroll down, you will see that we have currency pairs, commodities, indexes. Here are the cryptocurrencies: Bitcoin, Dash, Ethereum, Litecoin.
Cryptocurrencies in MT4 Market Watch
And in the Market Watch we have 2 prices. One is the Bid price and then we have the Ask price. Now the Bid price is cheaper than the Ask price.
If you look at the Bitcoin, at the moment it is 10 709.51 as a Bid price and it is 10 719.20 something with Ask price or $10 more. Why is that? Because this is the spread. If we right-click again and we go to Spread, a third column will appear and it will show the spread.
Click on Spread
For the moment it is fixed with Pepperstone broker for the Bitcoin at $10, you can see the Ethereum is about $2 and the Litecoin is about 3, Dash is about 3 as well.
The Bid price, Ask price, and spread
Something important to know about the Bid and the Ask price is that we Buy the asset at the Ask price, which is the more expensive price, and we Sell at the Bid price, which is the cheaper price.
Now, if we drag and drop the Bitcoin over the chart, you will see that the Buy price is the more expensive one 10 727, and the Sell is 10 717. Or if we Buy 1 Bitcoin now, we will Buy at the more expensive price, which is the Ask price.
And if we want to close the position, we will be closing it on the Bid price and we will pay this difference of $10 to the broker, which is called the spread. And this is one of the ways that the Pepperstone broker benefits from our trading. It is just like the exchange bureau, the bank when you go to exchange currencies, there is always a difference between the Bid and the Ask price or the Sell and the Buy price.
It is very, very important to look for the brokers that have a small spread because obviously if you have a huge spread, this will minimize your profits.
And in most of our courses, we include Expert Advisors and sometimes some students report profits. Others report losses with the very same Expert Advisors for the same period of time. And this is because they use different brokers and some have really huge spreads, especially for Bitcoin.
So trading with a small spread is vital and always look for the brokers that have a smaller spread.
Pepperstone MT4 Navigator
Now, below the Market Watch, we have the Navigator where we see our accounts.
The Navigator
If you have a Live Account or another Demo Account, it will be displayed here. We have the Indicators which we will show a little bit later. And below we have the Expert Advisors where we can place the Expert Advisors.
And we have Scripts that are very useful, especially when we create Expert Advisors, export historical data from the broker, and many other things. So all of these windows are customizable. For example, we can decrease the size of the Navigator. Usually, we keep it that way at the Academy just to see the Expert Advisors that we have. we can change as well the place so we can drag it above the Market Watch.
But usually, we keep it the way it is, the way it comes after the Pepperstone MetaTrader 4 installation, and we just customize the chart windows. Below we have the terminal where we will see the open trades, the closed trades, the result, we will see the account history once we have the Expert Advisors trading.
MetaTrader 4 terminal
And on the top we have different drawing tools like horizontal lines, vertical lines, we have the trend line which you can use if you have such a strategy. We show many strategies in our courses using trend lines and especially counter trend lines.
Drawing tools in MetaTrader
Timeframes in Pepperstone MT4
And we have the different timeframes in MT4.
For example, with the Bitcoin we are on the H4 chart right now, we can change it to M1 or to M5 and M15. These are the available timeframes in Pepperstone MT4. We have the daily chart, weekly, and monthly.
The different timeframes in MT4
What that means, for the beginners, if we are on the M15 chart, it means that 1 candlestick is 15 minutes of a time. It is now 9:23:20. And when it is 9:30 or half past 9, we will see a new candlestick opening. So 1 candle represents 15 minutes. If we switch to an hourly chart, 1 candle will represent 1 hour.
So when we have the full hour complete and the new one starts, a new candlestick will open.
Chart Types in Pepperstone MT4
On the top, we have as well different chart types. So we have candlesticks, we have the bar chart, which is very similar to the candlestick.
Example Candlesticks hour chart in Pepperstone MT4 platform
But with the candlesticks, we have more visual representation of the price.
Switching to Bar chart in MetaTrader 4
And we have as well the line chart, which is just the line connecting the closings of these candlesticks.
Line chart example
In this case by default, when we installed the Pepperstone MT4 platform, we have white candlesticks if it’s a negative bar. The price opened at the price of 10 748.38 and it closed at 10 697.26. It opened here, it closed here. And it’s a negative bar.
And the next one, the one that we have until the moment is positive, you can see that it opened at 10 695 and still, it didn’t close. We’ll see how this bar will close at the end of the hour. So what we will do now? We will just remove the other charts, we will close the GBPUSD, USDJPY, and USDCHF, and we will leave just the Bitcoin.
Pepperstone Review – Features
What can really make the best Forex trading brokers stand out from the rest is what sort of unique features they offer. And Pepeprstone broker does offer three main features. The Smart Trader Tools mentioned earlier, the cTrader Automate, and social trading partnerships.
Smart Trader Tools
Smart Trader Tools: Pepperstone’s Smart Trader Tools is an upgrade package with 28 different plugins. They are compatible with both the Pepperstone MetaTrader 4 and Pepperstone MetaTrader 5 platforms.
This upgrade set really takes the standard MetaTrader 4 platforms and turns it into one of the best trading platforms there is. It creates a more solid trade execution, allows retail traders to manage their portfolios with tools that the professionals use, and enhances risk management.
It is not uncommon for brokers to claim that they are offering traders cutting edge technology. What most are really offering is the basic version. In this Pepperstone review, we found that the Pepperstone broker really does deliver on their promise.
cTrader Automate
Just like it sounds, this feature correlates with Pepperstone cTrader platforms. This feature provides traders with the opportunity to customize indicators and automate their trading solutions. This is really great for traders (individual and company) who do not already have an existing solution on another platform, such as the MetaTrader5 platform. The cTrader Automate is also great for both optimizing strategies and back-testing.
Social Trading
In addition to the automated trading solutions that Smart Trader Tools upgrade and cTrader automate provide, Pepperstone broker has a lot to offer when it comes to social trading. This happens through their partnership with five of the most popular social trading platforms – Myfxbook, Mirror Trader, MetaTrader Signals, ZuluTrade, and DupliTrade. It is worth noting that some of these services may require a minimum deposit, so make sure you investigate which option is best for you.
Research and Education
No matter what is your experience, there is almost always more to learn when it comes to Forex trading. Forex education is a really key component of the industry. Therefore, it is important to consider what kind of research and education opportunities your broker offers.
With Pepperstone broker, you will find research opportunities both with in-house analytics and through their partnerships with different third-party firms.
The in-house research provides traders with market news and trading opportunities on trading days. Every time they release new information, they send it to their users in a very professional and thorough way. This is beneficial to both traders looking for new ideas and those just looking for something to look into while taking a trading break. Traders will also have access to research by leading groups FX Evolution and BK Forex.
As far as education, Pepperstone broker provides traders with a wide selection of both written content and video lessons. This is really beneficial for new traders.
Their information is broken down into seven main categories. While very thorough for the most part, the CFD section does focus solely on gold. Their educational content does focus mainly on the basics. More experienced traders wanting to further their education may want to consider another source for education.
Customer Support
Pepperstone offers 24/5 customer support
As you are trusting your broker with money, good customer support is important in case there ever is a problem. Pepeprstone broker does offer customer support for 24 hours five days a week through email, live chat, phone, or through a webform they offer. Customer support through live chat and phone are obviously dealt with right away. All written requests are handled within 24 hours.
While their customer support is good, you should not find yourself having to deal with them all that often. This is because the Pepperstone broker takes pride in being extremely well-managed and transparent. This means that you should not regularly run into all that many problems.
For any of the more common problems or questions traders have, they do have a thorough FAQ section. There you can browse a variety of topics – funding and Pepperstone withdrawal; managing your Pepperstone account; opening an account; new to trading; platforms and tools; and understanding trading conditions.
Pepperstone Review – Promotions
If you become a premium client through Pepperstone broker, you will have access to additional bonuses and promotions. Such promotions include more advanced trading tools, a premium rebate program, and VPS hosting.
You will not even be pressured to make a bigger despite becoming a premium client. This is rather based on your trading volume. If you trade around 15 lots (it varies slightly based on the assets traded), you can become a premium client.
Pepperstone broker promotions are based on your trading volume
Furthermore, once you become a premium client, you can become a member of their Active Trader Program if you are also a Razor account holder. There is more information about this program under the fees section, but it essentially awards traders rebates based on their trading volume, which further lowers their cost of trading.
That is one of the nice things about Pepperstone broker – the more you trade, the less you pay to trade.
Beginning with Pepperstone
When you are first beginning with Pepperstone broker, you will need to open an account. You do those through an online application, which is fairly standard in the industry.
The application will take you through a four-step process that is very clear and easy to follow. The four steps take you from opening and verifying your account through funding it.
It is an extremely simple process. Though it is worth noting that you will need a copy of both your ID and a proof of residency document so that Pepperstone can meet their regulator’s requirements.
You do not need to feel concerned about giving Pepperstone broker your information and documents. They are extremely well-regulated and trustworthy.
Their account-creating process includes funding your account. This means you will be able to start trading very soon after you verify your Pepperstone account.
However, it is worth noting that if you are new to trading, it is a good idea to go through some, if not all, of their educational content pertaining to the types of trading you are planning to do before getting started as education, is key to successful Forex trading.
Pepperstone Demo Account Review
For new traders, it is advisable to undergo some, if not all, educational information in regard to the type of trading you plan to do. This is crucial for a successful trade.
When you feel comfortable enough you can start trading. We strongly advise you to start with the Pepperstone demo account before jumping into live trading. This way you will become familiar with the broker and trading platform you decide to use.
Now we will show you how to open a Pepperstone demo account, how to install MetaTrader and the basics of MetaTrader that you need in order to start trading manually or with Expert Advisors.
Let’s start by opening the website of Pepperstone, one of the brokers that we have been using for Cryptocurrency trading.
And again, please don’t take it as a recommendation because we are not related to any of the brokers. We are not promoting any of them.
Of course, we need to select one of them to show in our courses. So Pepperstone is a regulated broker and they have relatively small spreads for Cryptocurrencies.
How to Open a Pepperstone Demo Account
So after you select your trading broker, what you will need to do is to open a demo account. And you can do it either if you log in into the client’s area, or most of the brokers will have the button test, demo account, open demo account, and etc.
In this case, we try a 30-day Pepperstone Demo Account. So if the Pepperstone broker limits the demo account to 30 days, for example, Dukascopy limits it to 15 days. All you need to do is to write their support to extend the account. And usually, they do it without questions asked so you can ask them to extend the demo account to a lifetime so you will have more time to test the strategies.
Once you’re logged into your Pepperstone demo account, just click on Request an Account.
I click on Request an account
We will be using MetaTrader4 and I can select if I want to put a nickname, let’s say I will put Petko Aleksandrov, and then I would like my currency to be in USD. I will start with a smaller amount, let’s say 5000 USD.
If you are planning to trade on a Live Account with 5000, it’s not a bad idea to start the same amount on a Demo Account. This way you will be doing more realistic testing.
Back in the Pepperstone account, click on Submit.
I click on Submit
It will take a couple of seconds and I have my Pepperstone Demo Account open. Here is my account number.
Pepperstone demo account number
Installing the Trading Platform
And if I move my email from my next screen, you will see that I have received immediately the email from Pepperstone.
It says Hi Petko Aleksandrov, your Demo MetaTrader4 Account is now ready. To get started, install the MT4 platform.
The email from Pepperstone
This is the link that they send you and you can install the platform. I will click on that and it brings me back to their website. It depends on what you want to install or if you want to use the Web version, you can open it from right here.
Then for MetaTrader 5, they offer MAC version and Windows, and they have the mobile apps.
MetaTrader 5 variations at Pepperstone
Review Pepperstone MT4 on Windows
We will be using MetaTrader 4 for many reasons. Personally, I prefer MetaTrader 4 and it’s still the more preferable platform for most traders. I will be using it with Windows.
I use MetaTrader4 on Windows
Click on that button. The installation file is downloaded. I will click on it and you will see how easy it is to install the platform.
Now what you can do is click on Settings.
Click on Settings
Then select the destination. And usually what I do is I just change it according to the account that I will be trading. However, I can call it, for example, Pepperstone Crypto Trading, so I know that on this platform I will be trading Cryptocurrencies and I click on Next.
Select installation destination
And it installs just in a few minutes. The platform will open automatically.
I will click on Finish.
I click on Finish
And it brings you usually to the MQL5 website.
The MQL5 website
And below is the platform opened. Let us just make it fit the trading screen, and here it is.
Pepperstone MetaTrader 4 trading platform
Login to Trade Account
Now, I will log into the Pepperstone demo account that I have just opened. I go to Login to Trade Account,
I click on Login to Trade Account
and here, I will enter the account number and as well I will enter the password.
I enter my login credentials
That’s it. Once I do that, I click on login and it will take a few seconds to log in to the account, and I’m connected to the server of the Pepperstone broker. In the bottom right-hand corner, you can see that I have a connection to the server.
I am connected to the broker’s server
And on the left side, I see all the quotes, or in other words, I see the prices moving. This means that I am connected to the market and I’m ready to trade.
Pepperstone Deposit and Pepperstone Withdrawal
Deposits and withdrawals are two key components to any Forex trading broker. The process by which you do so is often a deciding factor for traders. If the process is too complicated, a trader may not feel confident that they will get their money.
Pepperstone supports a relatively wide range of different deposit and withdrawal options, including bank wires, credit and debit cards, Neteller, Union Pay, Bpay, PayPal, and POLi. The Pepperstone deposits are instant except for bank wires, which can take up to five business days to go through.
Pepperstone supports a relatively wide range of different deposit and withdrawal options
Pepperstone only has withdrawal fees with bank wires, though any of the third-party options may have separate fees.
It is important to note that the name on your trading account has to match the name on the account of the payment option you use.
Pepperstone withdrawal and Pepperstone deposit process are extremely streamlined and simple to use. Their range of different options along with their fast turnaround and low to no withdrawal fees makes it easy for every trader to access their earnings.
And, as mentioned in the customer support section, if you do happen to run into any problems, their customer support is available and ready to help you sort it out.
Pepperstone Broker Review – Conclusion
In this Pepperstone review, we found that this is a very good broker when it comes to Forex trading. They fall under many regulations and they are very transparent with their traders. Everything Peppersotne offers should be enough for both novices and more experienced traders.
The main reason why Pepperstone broker may not be for you is if you are really interested in expanding your CFD portfolio, especially with metals. Other than that, Pepperstone broker really is one of the best trading brokers available today.
For more regulated brokers go back to the Brokers Page.
Yes, Pepperstone is an ECN Broker. While they only offer one ECN trading platform, it is the most popular one there is, cTrader, which will fit most ECN trader’s needs.
Many Forex trading brokers require a minimum deposit ranging all the way from 100 dollars to a thousand or more. One of the benefits to Pepperstone is that there is no formal minimum deposit, which is good for new traders who are just interested in trying it out. It is important to understand, however, that how much you put in limits how much you can trade and therefore how much you can make.
Yes. Many brokers do not allow scalping, which is entering and exiting trades extremely quickly, but doing so is allowed with Pepeprstone. In fact, there is no minimum time that a trade has to be kept open.
Some companies are not very transparent with how they are making money, but Pepperstone is a very transparent broker. They make money from overnight swap fees, commissions, and charging spreads.
You have a lot of freedom when it comes to lot size with Pepperstone. Clients may even trade in micro-lots if they want, which is 0.01 lot. However, trading more may make you eligible to be a premium client.
Hello dear traders, I continue with the 2nd Envelope indicator strategy for Bitcoin, which is again for M15 chart. And before I show you the strategy, I will just need to open another chart window, which I can do if I right-click over the Bitcoin in the Market Watch and I click on Chart Window.
Right-click over the Bitcoin and select Chart Window
A new chart opens and it has a totally different layout. But I can customize that as I’ve said if I go to properties,
Right-click and go to Properties
and I can uncheck Show grid,
I unmark Show grid
and as well for the colors, if I click on reset,
I reset the chart colors
I will reset it to the black background, which I used on the 1st chart.
So if you want to save any of the layouts as a template, you can do that. Just go to Template, Save Template,
Go to Template, then select Save Template
and you can name it however you wish. Then when you open a new chart, you will be able to switch to your favorite template quickly from your templates.
So I have already my black background template saved.
I use my Black background saved template
This is the one that I will be using. So the 2nd Envelope indicator strategy for Bitcoin is the EnDe, as I call it. I call it this way because of the entry Indicators, I use Envelopes and I use the DeMarker as confirmation.
How do the Envelopes work in this Envelope indicator strategy
So I just take the first 2 letters from both indicators, that is Envelopes and DeMarker, and I make it EnDe. This is just my own system of naming some of the strategies that I use so it’s easier for me to remember them and to apply them. The exit indicators are the Alligator in this case, and I have a Stop Loss of 70 USD and a Take Profit of 200 USD.
Very good risk-reward with this strategy and I will explain how it works. The 1st indicator that I will add is the Envelopes. I will go to Insert, Indicators, Trend, and I go to Envelopes.
How to insert the Envelopes
The default value is 14 as a period.
I will change it to 11 and the deviation is 0.39. I click on OK.
The Envelopes parameters
You will see how the Envelopes indicator looks like.
The Envelopes as they appear on the chart
These are 2 kinds of Moving Averages that go in parallel and usually the price stays between them. You will see that the price stays between the 2 bands of the Envelopes indicator and when there is volatility, it gets outside the bands.
Representation of volatility by the Envelopes
This Envelope indicator strategy works on M15, something I forget to switch on the chart, so make sure to use it on the right timeframe. But no matter which timeframe you use with the Envelopes, you will always see that the price stays inside the Envelopes when there is no volatility and when there is volatility, it gets outside the bands.
The DeMarker in this Envelope indicator strategy
This is exactly what I will be using for this strategy. So with this strategy, we buy when the price gets outside the bands and it gets inside back.
Or to make it more precise, we say that we buy when the price gets outside, we see a bar opening above the upper band. And if we have a bar that opens below the upper band after that, this is our entry on the opening of the next bar, which confirms that there is a cross of the bands.
But we have one confirmation and this is the DeMarker, which must be higher than the level line. I will go to Insert, Indicators and the DeMarker is with the Oscillators. I click on it.
How to insert the DeMarker
I will be using a period of 36 for the moment, and Levels of 0.75 above and below it will be 0.25.
The DeMarker levels
I click on OK, and you will see how the DeMarker looks like.
The DeMarker as it appears on the chart
The DeMarker must be higher than the level line which is 0.75. And in this example, you will see that we don’t have confirmation.
No confirmation
Because when we have a bar opening above the band and then we have another opening inside the Envelopes, this is the signal, but we need to see at the very same time that the DeMarker is above the level line, which in this case is below. So there is no confirmation.
We have no confirmation
I see the DeMarker above at some point but in this case, we don’t have a confirmation. Because with these candlesticks, we have a bar that opens outside the band.
But then the next one opens inside and the DeMarker is already below the level line. I want to show an example where we are actually buying and not selling.
Stop Loss
I see that we have a confirmation with our Envelope indicator strategy. The price goes outside the Envelopes and at the same time, we have the DeMarker above the level line.
This is a signal to buy. Let me put 1 vertical and 1 horizontal line and you will see that at that moment, we have the DeMarker above the level line of 0.75, which is the confirmation.
The confirmation
I will make the horizontal line green because it’s a long trade or we buy at that moment.
What we will have for this Envelope indicator strategy is a Stop Loss of $70. I will put quickly 1 horizontal line 70 USD lower.
Sometimes I don’t calculate the cents. But in order to be precise, 10 634.78 minus $70, and that is 10564.78.
The calculation
Then I will just right-click on the horizontal line properties and I will make the color red because this is a Stop Loss in this case. I will enter the value, which is 10564.78, and I click on OK.
The Horizontal Line properties
The Alligator is a part of this Envelope indicator strategy
It gets on the right spot the very same way I am placing a Take Profit. Now it is red because I changed the color on the other horizontal line, but I will change it to green because this is our Take Profit and the parameters will be 10634.78 plus 200 USD.
That is very easy actually to calculate, 10834.78, and I click on OK. So here is the entry.
The entry
At this moment we have the signal from the Envelopes. The price gets outside and gets inside. We have a bar that opens inside the Envelopes.
So this is our entry at the very same moment that DeMarker is above the level line, which is confirmation. At the moment, when you open the trade, you need to put your Stop Loss and your Take Profit. So you’re protecting your capital and at the same time, you are ensuring profits if the price goes in your favor or in your direction.
Now, before we see what happens with this example that I just took very randomly on the chart, I will put the exit indicator, which is the Alligator. The Alligator is a very interesting indicator. I will look for it in Indicators, and I go to Custom.
How to insert the Alligator
It has Jaws, Teeth, and Lips.
Take Profit in this Envelope indicator strategy
It’s a very popular indicator and it has many strategies. But we will be using something very simple. So the values that I will be using is 20 for Jaws period and I have Shift of 18, and then I will use Teeth period of 18 and Shift of 8, and for the Lips, I will have period of 8 and Lips Shift 5, and I click on OK.
The Alligator inputs
You will see another 3 lines over the chart.
The 2 lines on the top are the Envelopes that are parallel. The other 3 are crossing each other. The green one, if I put the mouse on that, is the Lips, the red line is the Teeth, and the blue one is the Jaws.
The Alligator indicator
What we have as an exit rule for the long trade is the Lips crosses the Teeth downwards.
So when the green line crosses the red line downwards, we exit the trade, no matter whether it’s on profit or on loss. And the blue line, we don’t use it in this case, which is the Jaws. The price just goes sideways.
It touches the Take Profit exactly.
You can use any colors of your choice
The red line which is from the Envelopes indicator is parallel to the blue. I’m looking at the other red one. The green one crosses the red one.
Now, in order not to get confused, usually, I change the color of either the Envelopes or the Alligator. Now, because I’m used to the Alligator, what I usually do is change the color of the Envelopes to the same color. So I will take Aqua as well for the lower band, and when I click on OK.
I think it’s much easier because both bands for the Envelopes are blue and we have the green line from the Alligator and the red one.
I use different colors for different indicators
We wanted to see that the green one is crossing the red line downwards. This happens at this moment as seen below.
The cross
The price hits the Take Profit
So we would be closing this trade at the level of 10 696, which is about $62 61, something higher. And we take a profit. If I don’t use the exit rule, what happens after that? The price goes up impulsively and we would have the Take Profit now.
It happens in trading that sometimes you will see the price getting very close to your Take Profit, but it will not hit it.
Sometimes it’s really just a couple of cents and it goes back. It can even go back to your Stop Loss, which is not really the best feeling. Let me zoom out the chart to show you, one more time, the example. We have the confirmation from the DeMarker, we have our entry, Take Profit, and Stop Loss.
The confirmation, the entry, Take Profit and Stop Loss
Then I am following the Lips and the Teeth of the Alligator. For this Envelope indicator strategy, I want to see the green line crossing the red line downwards, which happens. We would close the trade on a profit. Then the price hits the Take Profit impulsively higher.
Each strategy has endless outcomes
So that’s quite an interesting example that I have selected because first, the price goes very close to the Take Profit, I really can’t say in 100% if that would close the Take Profit because it’s just touching it. But then it goes down back to the entry-level and then when we have the exit, the price goes to the Take Profit.
So when you start practicing, you will see that there are so many different outcomes for each strategy. Sometimes the Take Profit will be hit, sometimes the Stop Loss, sometimes the Take Profit is very close, but the price goes down.
And in this case, I always like to say that if I am in front of the screen and I see the price getting very close to my Take Profit, I will just close the trade manually and I will take my profit. Because anyway, there is always the risk that the price reverses and you lose the profit. But that’s up to you.
Usually, when I trade with the Expert Advisors or I trade these strategies manually, I don’t touch it. I’ll leave it to the Expert Advisor 100%.
These are the rules that we have for this strategy: 2 entry rules.
The strategy rules
The exit in this Envelope indicator strategy
Indicators, I have 1 exit Indicator, and if we are selling, we are using just the very same thing on the opposite side. We want to see a bar that opens below the lower band, and then a bar opening inside the Envelopes. But at the same time, the DeMarker must be below the level line of 0.25.
In this case, let’s see where we have confirmation right over here. With this impulsive movement downwards, we have confirmation and let me remove all the lines. So you will see clearly here that the DeMarker is already below the lower band and the 1st bar that opens inside is right over here.
So at this moment, we would be Selling at about 10 628. And in this case, I think our Take Profit would be hit. $200 lower is at 10 427. The exit would be when the green line crosses the red line upwards, which in this case happens somewhere in here. This is the strategy in both directions.
When you want to buy, when you want to sell, you have the Envelopes as an entry, DeMarker as confirmation, Stop Loss of 70, Take Profit of 200. And these, one more time, are the values that I use for the current moment. And we have the Alligator, which is an exit Indicator.
Stay tuned for the next strategy
So as I’ve said, when I change the parameters in the strategies, I simply change the PDF for myself as well, and you will find it attached. So you will always know what are the current parameters that I’m using for these strategies.
Thanks for reading. I will continue with the next strategy, which is for Bitcoin on H1 chart, or that is for the 60 Minutes timeframe.
EA Creator is the tool that every advanced trader wants to use
In this post, we are going to have some fun. We are going to generate Expert Advisors, we’re going to select the best strategies, I’m going to show you how to filter them, and we are then going to take our Expert Advisors that have been filtered with the best performance and place them on all 4 of our Demo accounts. That is possible with EA Creator.
We’re going to track the progress of the Expert Advisors on each of the Demo accounts, and we’re going to select the best ones. From there, I’m going to show you how we open a second Demo account, which will simulate a live account, and how we then select the best performing Expert Advisors from our Demo accounts and place it onto this live account and then start monitoring the performance.
What is EA in Forex trading?
I’m going to be showing you how we generate our strategies using EA Studio software and how we then download them as Expert Advisors. The first thing you’ll notice is that on the right, under My data, I have the data that we have imported from IG, from ForexTime, and from DukasCopy.
The imported data
But there is no data here from JFD. The reason for this is if we go to our generator, the first thing under historical data we have is the data source. And here, you can select. So as you saw, we have IG, we have ForexTime, and we have DukasCopy.
Data source
The lots in the EA Creator sets your trading volume
But the very first one is Meta Trader Demo. Now, Meta Trader Demo is, in fact, historical data from JFD. We don’t need to import it because it is already in Expert Advisor Studio and it gets updated daily. So you always have the latest historical data available from JFD within Expert Advisor Studio.
Let’s run through how we generate our strategies. The first thing is we go to historical data, we select our data source, we select our symbol.
The symbol
Now, on the drop-down, you’ll notice that we have a number of different assets or a number of different currencies available.
And this is, again, because the historical data for all of these currencies is within EA Studio from JFD. In this course, we’re doing EURUSD, so we’re going to keep it at EURUSD. And the period, we’re going to keep at H1. You can select all of the different time periods but we are creating Expert Advisors on the one-hour chart, on the H1.
I see that we have 37,000 bars and the date is from 2014 to current. The next thing we are going to do is go to strategy properties.
Strategy properties
Entry lots – here is where we can select our entry lots. I always keep it on 0.1 and this is my recommendation to you, especially if you’re a beginner trader.
Take Profit
Don’t make it too big because you are going to amplify your risk too much. Stop Loss, we have a number of options – we have Always use, May use, or Do not use. We’re going to keep it on Always use. Under Type is Fixed, Trailing, Fixed or Trailing, and we’re going to keep it on Fixed.
Minimum pips, we’re going to keep it at 10, and Maximum pips, 100. Then for Take Profit, we’re going to do very much the same thing. We have the options of Always use, May use, or Do not use, and we’re going to keep it on Always use. Minimum pips is going to be 10 and Maximum pips is going to be 100. Then generator settings.
Generator settings
So working minutes – here is where you would put the amount of time that you want your generator to run. I usually keep it between 300 and 600 minutes, which is between 5 and 10 hours. If I’m going to let it run overnight, I’ll put it at 600 minutes.
But it is now morning and I wanted to generate strategies by this afternoon. So I’m going to put it on 300, which is 5 hours. Search best, so here, again, there are a number of options. We’re going to keep it on Net balance. Basically, what will happen is that the strategies that have produced the highest Net balance will be first in our collection under Out of Sample. We’re going to keep it on In Sample.
Acceptance criteria is crucial in the EA Creator
Max entry indicators are going to be 4, and Max exit indicators we are going to leave at 2. Then Generate strategies with Preset Indicators, if this is selected, just unselect it. And ensure that the checkbox for Use of the common Acceptance Criteria is selected.
We’re then going to click on Acceptance Criteria and that will bring us to the page below.
Common Acceptance criteria
Now, this is where we set the Acceptance Criteria for our generator and this is where we set the parameters that we want our generator to use when creating strategies.
So what we’re going to do is we’re going to make our Minimum count of trades 300, Minimum net profit and Minimum r-squared we’re actually going to get rid of. And how we do that is very easy, we just click on the red X. Then we’re going to click on Add Acceptance Criteria and as you can see, here, we have a lot of options available.
And the one that we’re going to use here is Minimum Profit Factor. Here we’re going to set this to 1.2. So what do these 2 mean? Minimum count of trades, what it means is that this strategy must be tested a minimum of 300 times over the historical data, and the Minimum Profit Factor must be 1.2.
EA Creator: Expert Advisor Studio
So in other words, if we take all of our wins versus all of our losses, the Profit Factor needs to be 1.2. For In Sample and Out of Sample, we’re going to leave. We are not going to use that. Then from here, we’re going to go back to our generator and we’re going to click Start.
I go to the generator and click Start
Now, what you’ll see is that it’s calculating strategies very quickly. And as it finds strategies based on the Acceptance Criteria that we put in, it will put them into our collection. So we’re going to let this run over the next 5 hours. And when we’re done, we will have 100 strategies in order of the highest net balance over the time period.
So the next step is that we’re going to do exactly the same thing using the historical data from the rest of the brokers. Now, one of the great things about Expert Advisor Studio Is that you can run multiple instances of the generator in different browser windows.
So while this generator is running, we’re going to open another browser window. We’ll bring it across here and we’re going to go to the generator.
I open a new browser window
We’re going to select the historical data from one of the other brokers, in this case, Let’s use IG-DEMO.
Profit factor
If we then go and we look at our settings, they will all be saved. So all the settings will still be the same. Great Acceptance Criteria, you can see that the Minimum count of trades is still 300 and the Minimum Profit Factor is still 1.2. We then go to Generator, make sure that’s an IG-DEMO, and we press Start.
And as you can see, we now have 2 generators running.
We have 2 generators running
And I’m going to do exactly the same thing with the other 2 brokers. So in 5 hours when all the generators have completed, I have 400 strategies in total. And from those 400, we will filter them down to 10 each, which will give us a total of 40.
And those 40 are the EAs that we are going to use on each of our platforms.
What is EA in Forex trading?
Our generator has now finished running and we have 100 strategies in our collection.
The collection
Now, if you remember when we generated our strategies, we used certain Acceptance Criteria. One of them was a Profit Factor of 1.2 and the other was a Minimum count of trades of 300.
Now, what that means is that the strategy will be tested across all of the historical data and it needs to be at least 300 trades where the minimum Profit Factor is 1.2. Now, what we used to have to do is go through all of these strategies and then decide whether or not we would use them.
Minimum count of trades
So, for example, if we go to page 10, you can see a really bad equity line, big drawdowns, a lot of stagnation. And what we would do is we would go through all of these, and we would delete the ones that we don’t want, until we got to the quantity of EAs that we wanted, which in this case is 10.
However, there’s a very cool new feature in Expert Advisor Studio, and that is the filter records. So what we’re going to do now is we’re going to select the checkbox and as you can see, you have a number of options here.
Filter records
And if you click on the add validation criteria, you have many different options that you can put in to validate your strategies.
So the first thing we are going to do is minimum Profit Factor, which is already here. We have already set it to 1.2 in our Acceptance Criteria when running the generator. However, our Minimum count of trades in the generator, as I said earlier, was 300.
The Minimum count of trades, the higher the number is, the more robust your strategy is, and the more times it worked in different market conditions. So we’re going to leave those 2. However, we are going to add one more and that is going to be Minimum R-squared.
Minimum R-squared
Now, what Minimum R-squared is, is essentially the equity line. Now, if the R-squared was 100, it would mean that we would have a completely diagonal and perfect equity line. Of course, this is impossible to get because market conditions change and you’re always going to have drawdowns.
And you’re going to have periods where you make a little bit more and some periods where you lose a little bit with the strategy. So what we’re going to do is we are going to play around with the minimum R-squared number until we get to around 10 or 12 strategies that have passed.
So right now we only have 6 out of 100 based on our criteria. We’re going to bring this down to, let’s say, 70. We’re left with 17. That’s still a little bit too much so let’s change this to 75. Now we have 11 strategies out of 100.
So what are we going to do is to just very quickly look through these and decide which one we’re not going to keep. These all look pretty good. I’m just going to look through all of them and then what we’re going to do is to go back to page 2. It’s got a lot of drawdown. Let’s get rid of that one.
Downloading the Expert Advisors
And as you can see, Period strategies – 10 out of 99 because we deleted one of them. What we do now is we are going to click on this dustbin icon here, which will remove all hidden strategies.
Remove all hidden strategies
So we click on that and as you can see, we now have 10 out of 10.
Each one of these strategies here is going to be an Expert Advisor. Now, what do we do from here? Very easy. If you look at the strategy window here, you’ll see that there’s an icon where you can click to download the Expert Advisor for MT4, the one next to it is for MT5.
Download the Expert Advisor for MT4 or MT5
So all we’re going to do from here is we’re just going to download these for Meta Trader 4 and Meta Trader 5. And these are the strategies from the historical data of this broker that we are going to use, and these are going to be 10 of the 40 strategies that we are going to be putting onto our platforms.
All I do is click on Expert Advisor for MT4, it downloads. And then we click on the one for MT5. I’m just going to do this for all of them, MT4 and MT5. I have all of the Expert Advisors downloaded for both Meta Trader 4 and Meta Trader 5.
Download EA from the EA Creator either for Meta Trader 4 or the Meta Trader 5 depending on your platform
Of course, you will only download the one that is applicable to the platform that you’re using but we will be attaching these to the course so you’ll have the option to download either the Meta Trader 4 or the Meta Trader 5 EAs, just depending on which platform you’re using.
That’s it. Very quick and very easy. I’m going to do exactly the same thing with the other 3 collections that we have created using the generator with the historical data from the other brokers.
And in the next lecture, I will show you how we put these Expert Advisors onto our charts to start testing them on a Demo account.