Today I’ll be talking about margin crypto trading, and I will talk about the pros and the cons.
What is Crypto Margin Trading?
So what is the Margin Cryptocurrency Trading? This is the option that we have from some of the exchanges to trade with more money from what we have into the account.
How Crypto margin trading works
For example, if I fund an account on Coinbase, which is one of the most popular exchanges out there, with $100,000 or let’s say with $10,000 and I want to buy cryptos, I have actually $10,000. But with some of the exchanges like Kraken, Binance, Crypto.com, offer that and it’s called Loan-to-Value. You can actually purchase more cryptocurrencies from what you have into the accounts.
You will be able to purchase, for example, for $20,000 or even $30,000. How that works? The exchange will actually loan money to you. You will borrow from the exchange money to purchase a bigger amount of Cryptocurrencies. Of course, as you can guess, that is risky and it’s costly. How come? There is an interest rate.
The interest rates
They will not just give you money so you will be richer faster. They will borrow money but you will have to pay for that.
And pay attention here, some of the interest rates are relatively high, jumping up to 20% or even 30% a year.
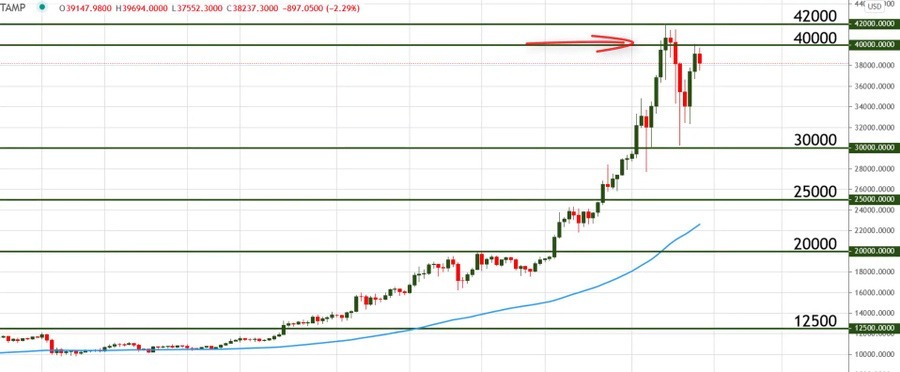
And this is, of course, useful if you catch the very right moment on the market, you borrow the funds, you make quick profits, you sell it, and you’re good to go.
For example, if you have done that when the Bitcoin price broke $20,000 and it reached $40,000 shortly, then you will be doing great.
The price rises within a short time
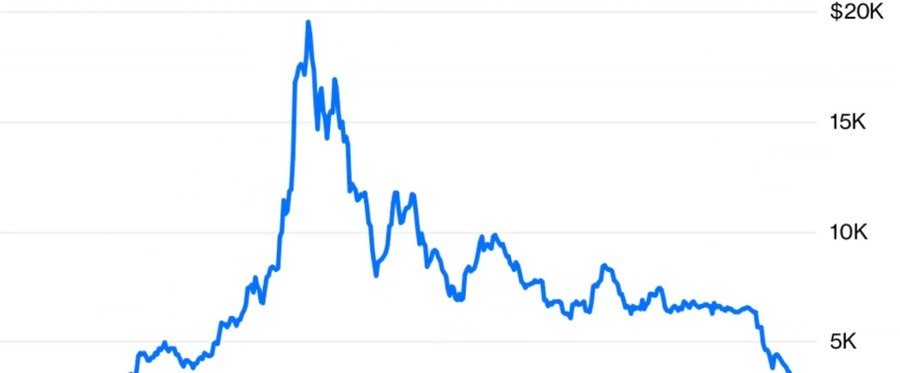
But if you have done that in January 2018 and after that the price crashed from $20,000 down to $3,000 and something, well what happens?
The price crashes
You will be holding borrowed money from the exchange and you will be paying interest rates.
So if you have bought Bitcoin at, let’s say, $19,000 in 2017, but you didn’t buy 1, you bought 2 more. For example, on Binance, you borrowed 2 from them but you had only 1. And then you hold these 3 Bitcoins for a few years and you just pay interest rates. Well, I’m not sure that you would still hold any Bitcoins.
My money management technique
Because you borrow the money but when the price drops, you will be losing actually 3 times more than what you would have lost if you had just your Bitcoin. So cryptocurrency margin trading is quite useful. If you want to get some quick profits, that’s where it’s risky.
Remember that on the market, anything that is risky will bring you more profits and everything that is less risky will stay longer on the market.
That’s why if you are planning to buy cryptocurrencies as an investment and hold them for years, you better not use margin crypto trading. Because this might bring you into losses much faster than you were expecting. But usually, people get greedy when they get into the cryptocurrency market because they wish they bought more and so they can make bigger profits.
Of course, I wish I bought more but I bought exactly with the amount I have decided. I have good money management that I stick to. For example, I never go above 20% of all my capital for cryptocurrencies, that’s the rule I follow. It doesn’t mean you have to do it but it’s good to have rules. And of course, I wish I bought it earlier at a better price but that’s the market, there are always possibilities.
Don’t get greedy
If you have bought at one price, it means that this was the price at which you were ready to buy. On the market, there is no expensive and there is no cheap price. It’s always the current price that matters and that’s what I explain always in my courses. Because many of my students ask me, ‘OK, isn’t it too late to buy Cryptocurrencies in 2021?‘
Well, it was late when the Bitcoin was $1,000 because many people said, ‘Oh, why didn’t I buy it at $5, why didn’t I buy it at $10?’ And when the price reached $50,000, the mass of people say, ‘Oh, it’s too late to buy cryptocurrencies.‘ But what if next year the price is over $100,000? Is $50,000 still going to be too expensive? So there is no expensive price, especially for Bitcoin.
It’s always the current price that matters. So don’t get greedy to borrow a lot of money from the exchanges because you might lose much faster. The margin trading with crypto is great when there is huge volatility. Just like what happened after the price broke the $20,000, reached to $30,000, to $40,000 very quickly.
Leveraged trading
And you can use that time or such a period of volatility, so you can trade with some borrowed money from exchanges and brokers and get some quick profits but not for holding cryptos for years because you will be paying a lot of interest rates. And just to make it clear, at the end of the lecture, the margin crypto trading actually comes from the Forex brokers, which have named it leveraged trading.
You can do much higher leverage
And they have invented that much before even Bitcoin was created. So when you have a Forex trading account, you can use leverage much higher than 1 to 2 or 1 to 3.
There are leveraged accounts 1 to 100 or 1 to 500. What that means, is that if I have $1,000 of an account, I can open positions 500 times more.
Obviously, that’s super risky and you can blow your account for less than a minute. So the right turn to go is actually leverage. But the crypto exchanges just twisted it and called it margin crypto trading, but it is leveraged trading. Or with simple words, it is borrowed money that we use from the exchanges, from the broker, to open bigger positions. But you have to be very careful with that one more time.
Thank you guys for reading this lecture. If you have found it useful, please share your thoughts about crypto margin trading in the comments below.
In today’s lecture, I’ll be talking about the coin BitTorrent and what is the realistic price prediction that I’m looking at after investing a small amount into BitTorrent buying it from Binance. And I’ve bought nearly 12,000 coins and I will share with you what is my plan to add some more to improve my average price and what are the realistic targets I’m looking at.
BitTorrent Price Prediction
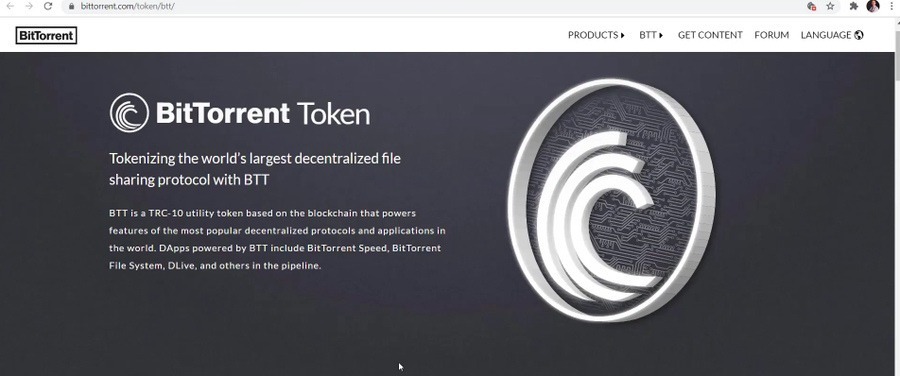
BitTorrent, the coin that many of us associate with the torrent company and the websites from where we are able to download favorite movies, is quite an interesting coin. If I go to the BTT CoinGecko page, navigate to website, and open the BitTorrent.com BTT website and you will see that it actually is applicable to the speed.
BitTorrent BTT website
And if I scroll just a little bit lower you will see that with BitTorrent Speed enabled, downloaders will have the option of providing tokens to uploaders in exchange for faster download speed.
And indeed BitTorrent speed is available as a feature of BitTorrent and uTorrent web as well as uTorrent classic and much more. You can read about the BitTorrent coin itself. As well if we look at the community, they have a pretty decent community on Reddit and Twitter. So in the Subreddit BitTorrent, we have just about 6,000 members. And on Twitter, we have nearly half a million followers which is a huge number.
Improving Average BTT price
Half-million followers for a cheap coin that sits at the moment at $0.0027 is a huge number of followers. However, in this lecture, I want to focus on the BTT price prediction and I will tell you what are my realistic targets and where I’m looking to buy some more from the BitTorrent crypto coin.
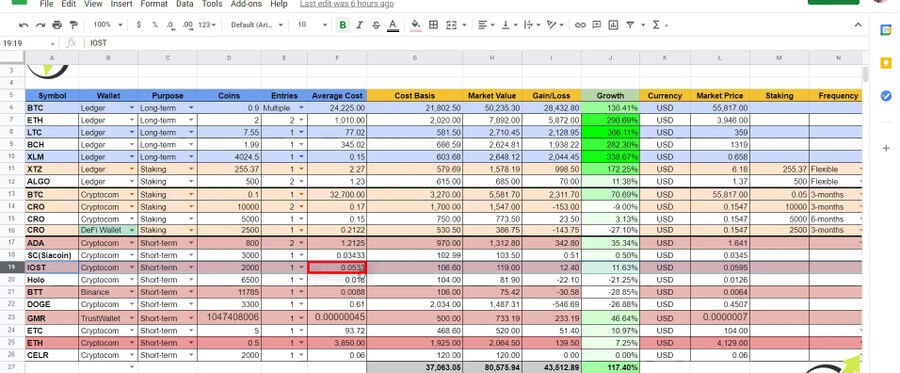
The first time I have bought BTT, and I will show you my crypto portfolio spreadsheet, is at $0.0088 and I will tell you why I have bought it there. And now I’m looking to buy it a little bit cheaper, so I’ll improve my average price.
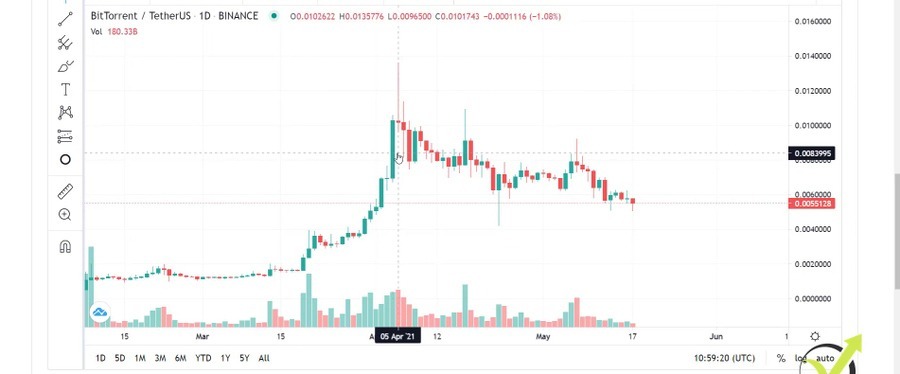
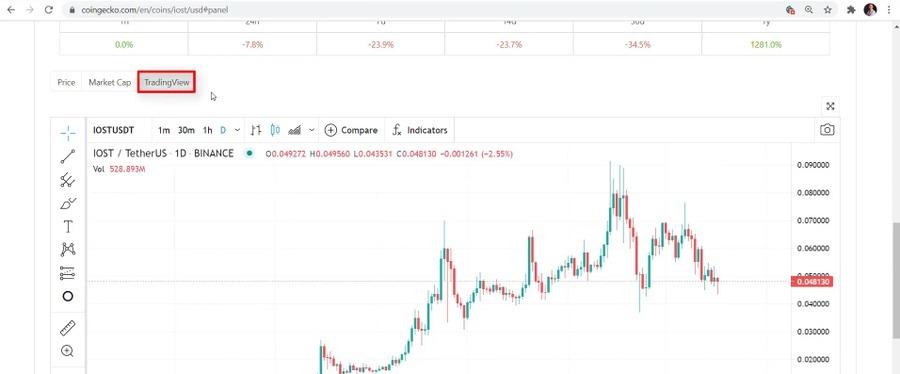
So at the moment, I’m looking at the Trading View feature in CoinGecko which is a great option to draw lines, do some price predictions. Now BitTorrent like many others did a great move at the end of May 2021.
BitTorrent did a great move at the end of May 2021
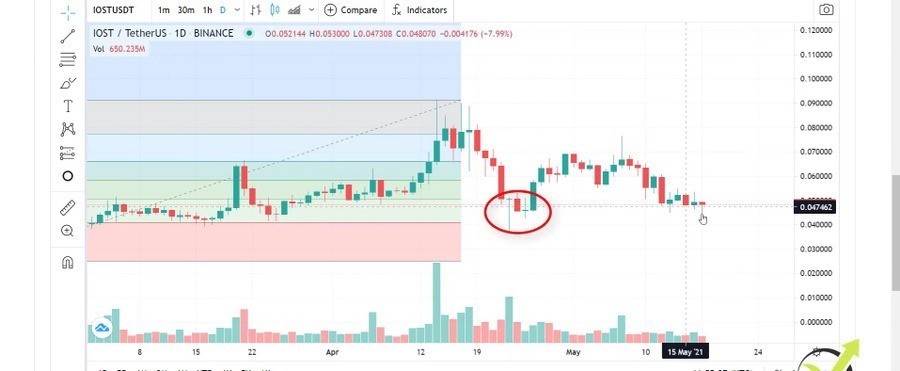
And on the 5th of April, it formed this nearly a doji, or I can say nearly a gravestone doji candlestick which is a reversal pattern.
The gravestone doji candlestick
And it showed that this is it for this month and it went on the negative side and after it did that I started to look for buying opportunities. So I always avoid buying cryptocurrencies that are just going up because we don’t know where the top is. And buying it somewhere on such impulsive candlesticks could be really risky because we might hit just the ad.
Using Fibonacci for the BitTorrent Price Prediction
So what I personally prefer to use are the Fibonaccis, the support, and resistance levels, and the counter-trendlines which I will explain in this lecture. And you will see what are the realistic BTT price predictions that I’m looking at and what are the levels where I’ll be happy to buy some more BitTorrent coins for my crypto portfolio.
If you want to follow all the investments that I currently have you should check out my Patreon page where I have been sharing all of my investments. Every time I buy or sell an asset I send an alert to my followers and you will get as well access to the spreadsheet.
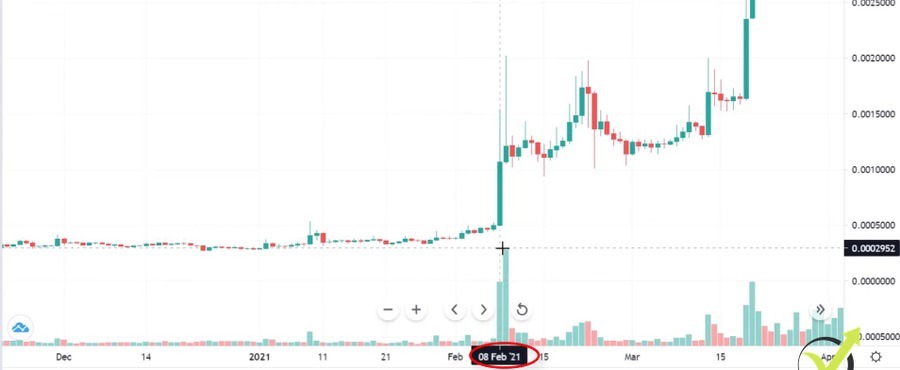
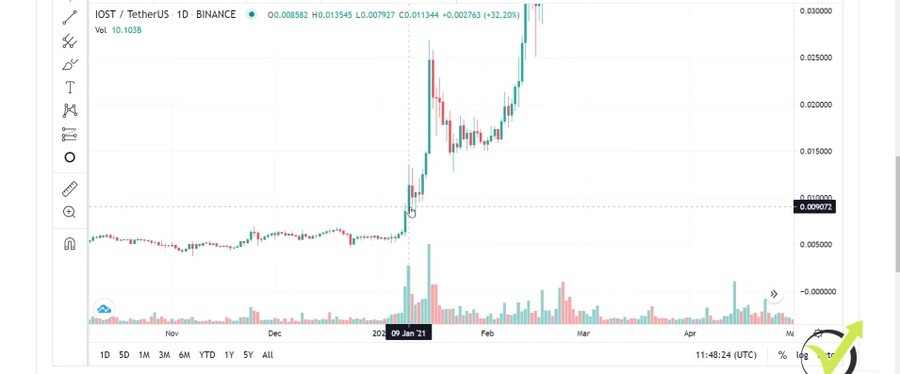
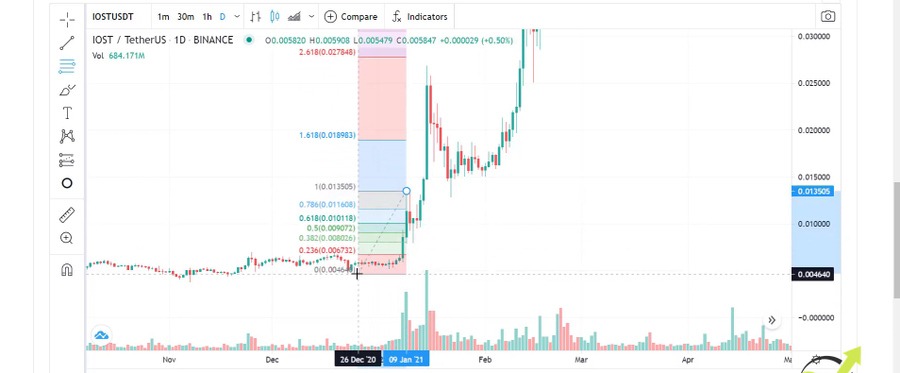
So now going back to the chart I will start a little bit earlier from the beginning of this year. Or if I have to be precise I will start in February 2021 when we had this first impulsive move from BitTorrent in 2 days.
The first impulsive move of the BitTorrent coin
It was on the 8th of February and the 9th of February. So what I usually do, I take a Fibonacci retracement and this is a popular indicator that you might be familiar with, if not, nothing hard. We just draw from 1 point to another. So now I’m taking this impulsive move that we have at the beginning of February 2021 and I’m drawing it from the top to the bottom.
The 1st Fibonacci
Retracement levels
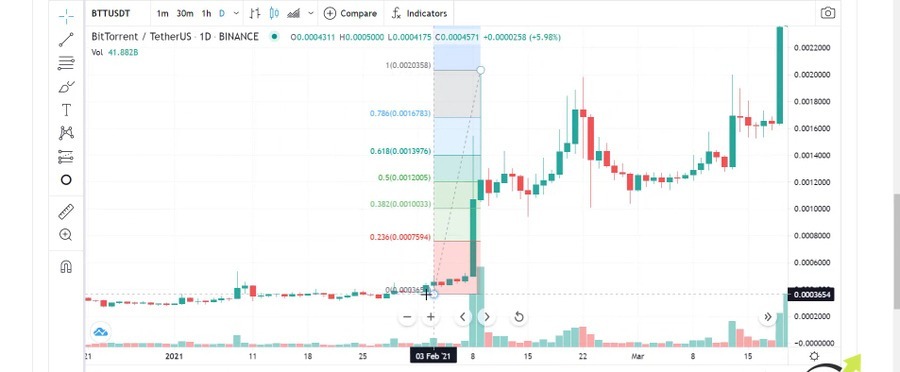
So it started at this point and this is the top. Now what you see is that there are levels, these are retracement levels which we use to buy the dips. And now here you can see that the BTT price did a retracement just below the 38.2 which is not bad. At this moment the price lost over 50%, actually over 75% of its value and that would be a great opportunity to buy it when the price touched 38.2.
So that’s one move and then we have this retracement zone where we can buy at a cheaper price and after that, chase the targets. So on the top with the Fibonacci we have automatic targets, we have 4 targets and usually, I use the second one of 2.618. And in this case, this target was reached a little bit later at the end of March or at the beginning of April to be precise, yes just on the 1st of April 2021.
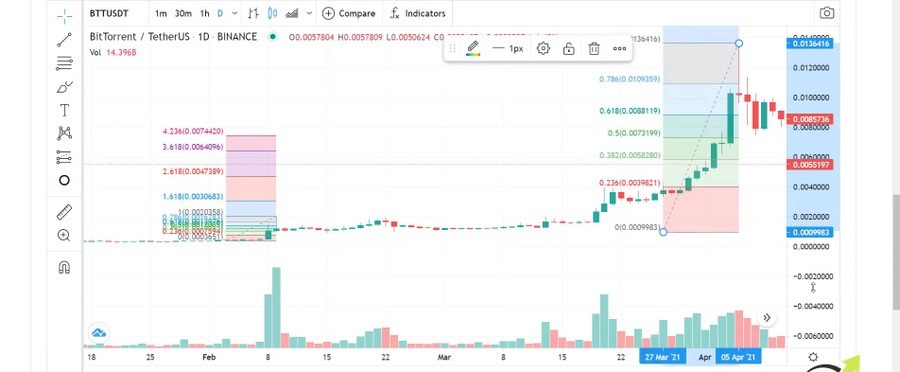
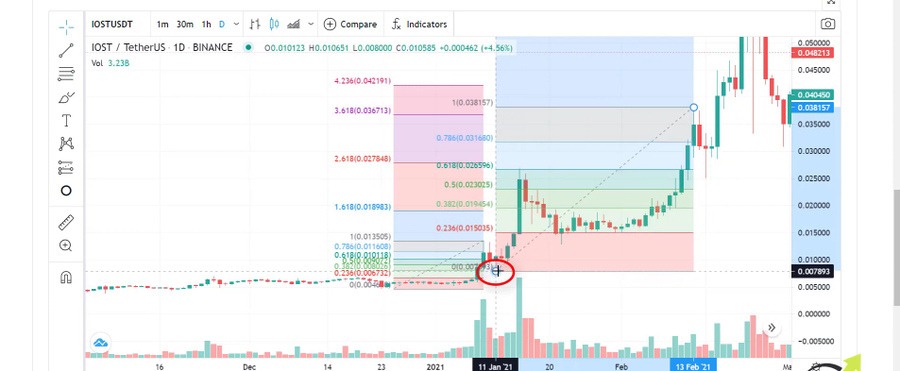
And then the price did this awesome move, it reached the top of $0.0135. Now after the price reaches the second target of the Fibonacci, what I do is I take another Fibonacci and I draw it from the top going to the lowest point of the retracement.
The 2nd Fibonacci
I will need to zoom in to see exactly where it was. So right over here is the lowest point after the previous Fibonacci and I will just zoom it and put it exactly where it should be right over here and that’s it.
Counter-trendlines
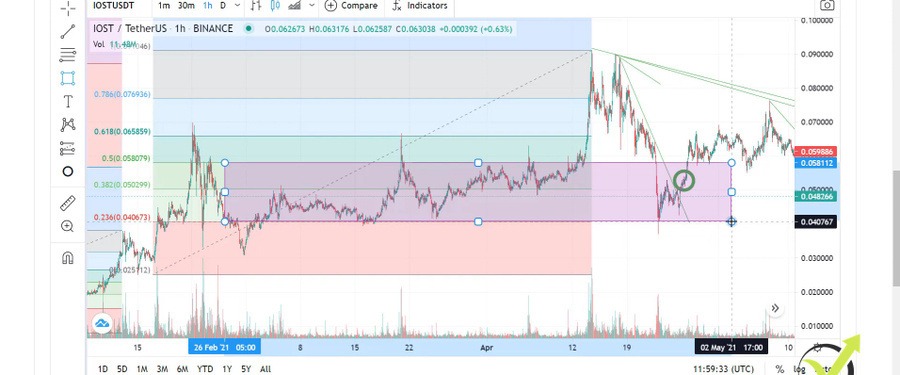
As well on the top, I will do it precisely so we can see a realistic BitTorrent price prediction after that with the next targets, here it is. I will just zoom and boom, here it is. So now I have the new Fibonacci which shows the recent move which is drawn from the recent move. And you can see that I have new retracement levels. So if I take one rectangle, for example, you will see that before the 50 levels we can have a box locked between 23.6 and the 50 levels.
And that box simply said shows us the levels at which I’ll be happy to buy.
The safety zone rectangle
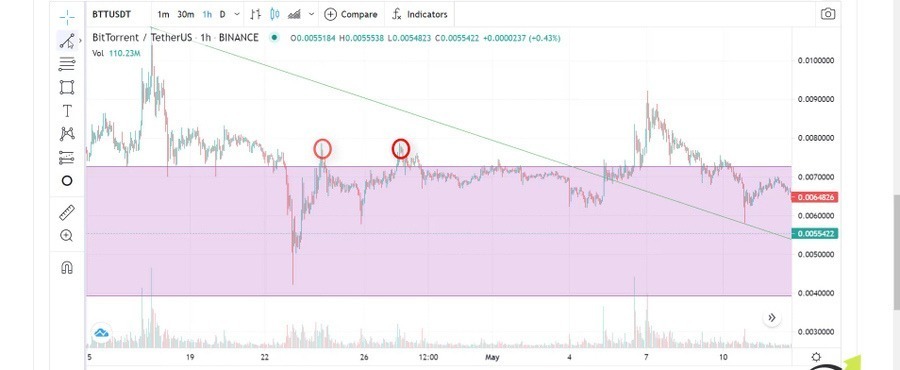
I’m just trying to do it really precisely, here it is. So the price one more time did an amazing move and then it pulled back. So this is called as well retracement and these are the retracement levels at which I’ll be happy to buy anywhere in this box, works great for me. And as I said I bought it at $0.008 and I will tell you why.
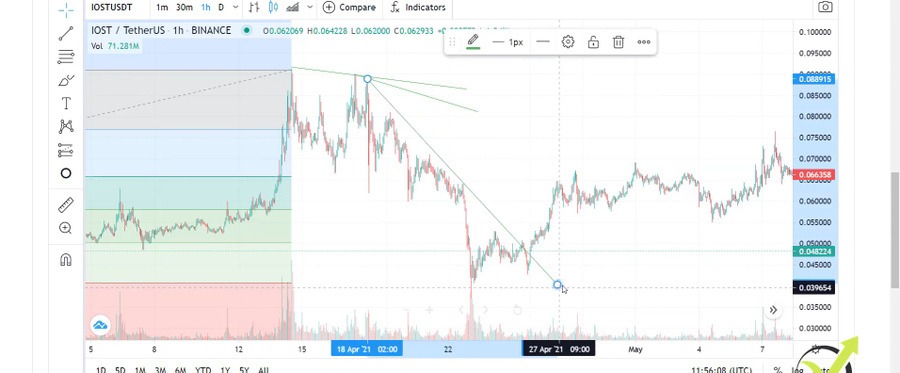
I have used the counter-trendline right over there and when the price broke the counter-trendline I started to look for buying opportunities.
So you see that the break was in the box which was a double confirmation for me. But I will go to the hourly chart. I always do this when I want to purchase because I want to see in detail what’s going on inside the day or what’s going on actually on the lower timeframe.
The hourly chart
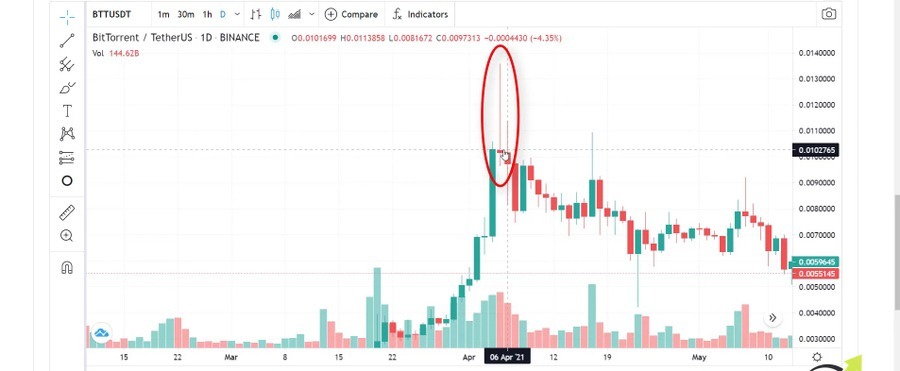
And you see that there was a break inside the box but I wanted to see these 2 highs broken as well.
I wanted to see these 2 highs broken
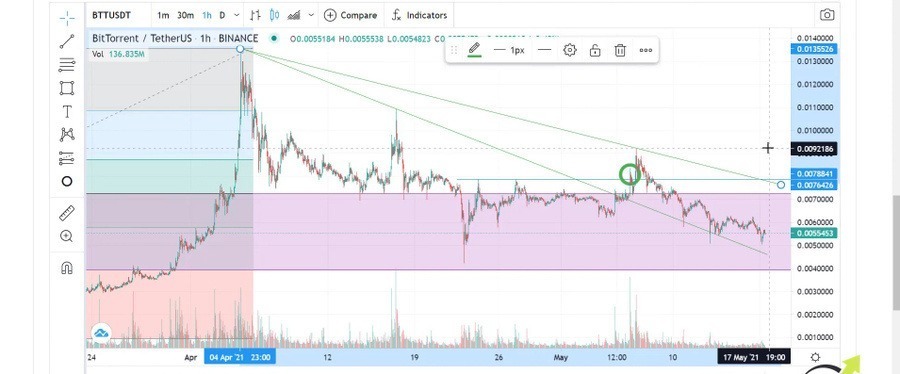
This level for some reason plays an important role because right there the price stopped, it pulled back, then it stopped for the second time. This means that this level which is somewhere at $0.0078 is an important level for the sellers. And in these 2 points, they didn’t want to allow the price to go higher.
So what I wanted to see is the break of this level and I’ve bought right over there. After the price I will put one circle. I’ve bought it right over there the price reached $0.008. I have announced it on my Patreon’s page and as well I have placed it on my cryptocurrency portfolio sheet.
Now after that, the price reached $0.0092 and it continued lower. So now what I’m looking at is to buy it at a cheaper price so I can improve my average price.
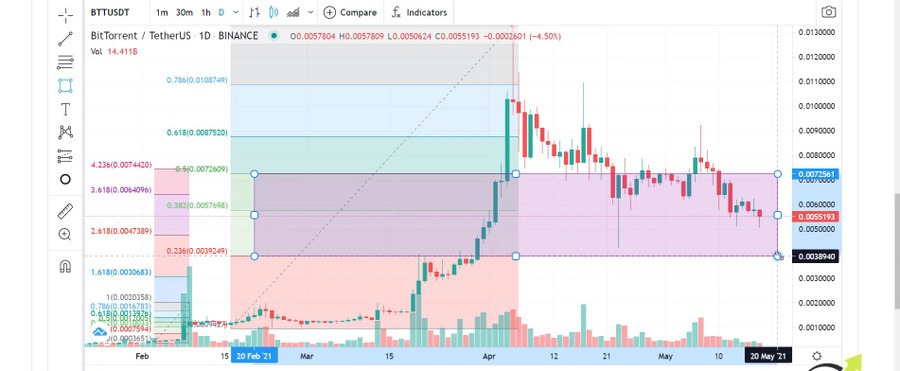
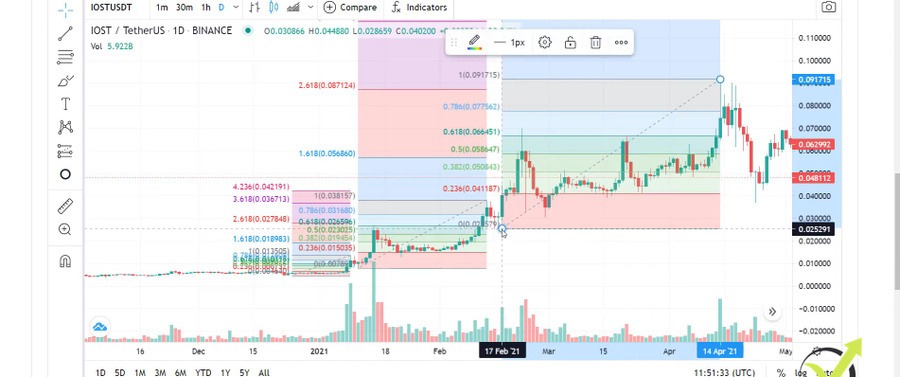
And I will just draw the counter-trendline precisely through the top. And after that, we have the new top over there and we can draw another counter-trendline and I will do it right away starting from the top going through this top.
The counter-trend lines
Now you see that I will need to increase a little bit the box and I will increase as well the counter-trendline. So now if the price reaches somewhere to this zone over here and it breaks the counter-trendline this will be great.
Multiple entries
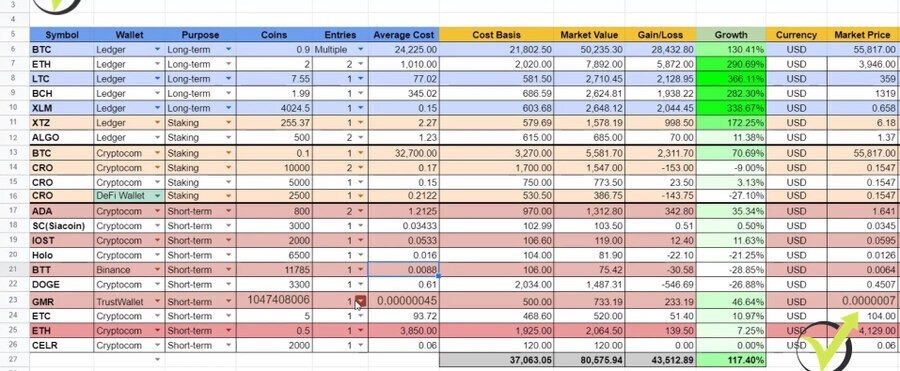
I always aim to buy a second time at a cheaper price than where I bought the first time. So if I go back to my cryptocurrency spreadsheet you will see that some of the assets that I have currently. So these are all the assets that I currently have.
My Cryptocurrency spreadsheet
And I have sold many, I have been trading many and on the spreadsheet, I keep only the assets that I am currently holding.
And if you’ve been following my courses, my videos, or my Patreon page you will know that I never sell at a loss. So when I purchase an asset I always aim to take profits or if the price goes against me, like what it did with BitTorrent, I’m looking to buy at a cheaper level so I will improve my average price.
So when the price breaks above I will have more profits compared to if I have bought all, so this is the idea of averaging the price. And this is why on some of my investments you will see 2-3 or even multiple entries.
Aggressive Counter Trendline
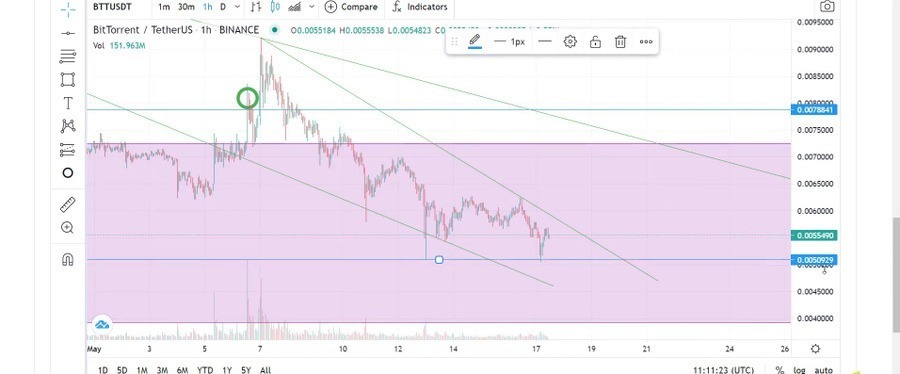
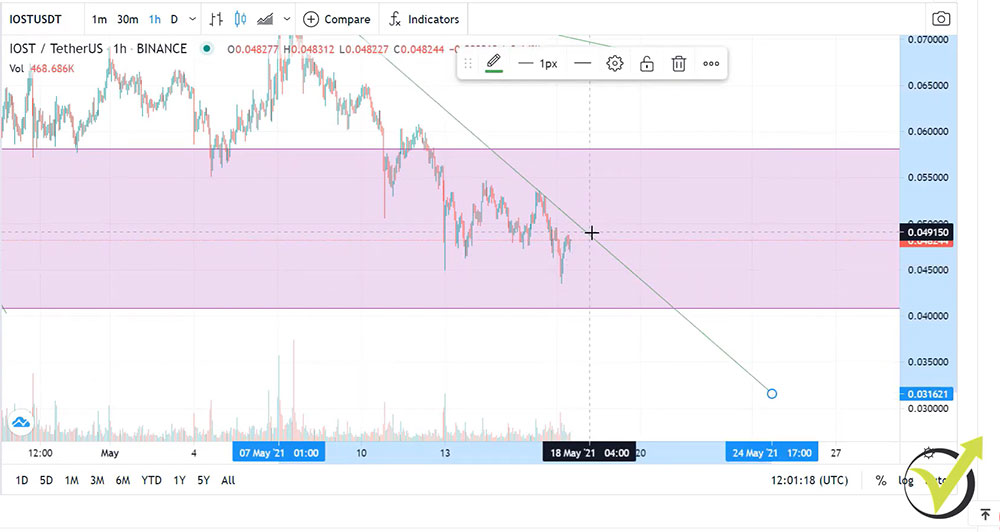
And one more thing I want to show you is the aggressive counter-trendline. This I draw from the recent high using a lower high like that one. So this is for the more aggressive players which prefer to buy the dips.
But now I’m really looking at this aggressive counter-trendline to add some more BitTorrents into my portfolio. Because you can see that the price stopped twice at this support level which I will put precisely right over here at the level of point $0.0050.
The support level
Probably it’s accepted as a round number in Trading View. So always remember that the 5, the 10 is accepted as a round number. So the buyers didn’t allow 2 times the price to drop below $0.0050 or this is half of a cent.
And previously on this dip over there, if I zoom it, you will see that the candlestick failed to close below that level. After that with this candlestick, it bounced again and now 2 times the price fails to go below that level which makes it important. And now if the price breaks the counter-trendline I might add to my portfolio some more BitTorrents which will give me a price of about $0.006.
So if the price does something like that in the next hours or days I’ll be happy buying it somewhere at $0.0060. And I will have an average price of about $0.007, of course, if I buy the same quantity.
So this is how I’m usually using the counter-trendlines combined with the Fibonacci, so I will put this green circle in here. And one more time I’ll be happy buying some more BitTorrents and these levels if the price breaks the aggressive counter-trendline.
My Prediction for BitTorrent Price
Now I use the Fibonacci to give me the retracement levels and the zone where I’m comfortable purchasing. But as well what is important is that the Fibonacci gives us targets or realistic price at which I’m super happy selling my coins. So if I zoom out the chart you will see that with the last Fibonacci I have 4 targets. One sits at 0.00213, the next one sits at 0.00340, the third target is at 0.00466 and the last one is at 0.0544.
And what I usually use the most is the second target of 2.618. So 2.618 is the value from Fibonacci which is calculated based on the move the price did. And for me with my experience, the most realistic target is the second one, which in this case sits at $0.0340. This would be my realistic price prediction for BitTorrent crypto coin. And why do I say realistic? Because with my experience I saw that the second target works best in most of the cases.
For example, Ethereum Classic recently did a great move and reached nearly the fourth target but this was rare. Most of the time the second target is reached easier and what I do after that simply when the price reaches the second target I draw a new Fibonacci. And then I’m looking for the new retracements, I’m buying it cheaper, selling it higher and this way I always buy the dips and I sell the record highs.
Conclusion
And this is what brought me a lot of profits in 2020 and 2021. Hopefully, the market will continue to be bullish in the next months. Even if Elon Musk keeps posting now negatively about Bitcoin and the crypto world, even he was so positive in the last months. But I will not go into there. In this lecture, I wanted to show you my realistic price prediction for the BitTorrent crypto coin and where I’m looking to buy some more.
One more time, I’m looking to buy at the level of $0.006 and I’m looking to sell it at $0.0340.
Of course, if this happens in the near future, if not I’ll be patient and I will be looking for buying opportunities if the price drops lower so I can have a better average price. And if you don’t want to miss my crypto signals check out my Patreon’s page, this is where you will get access as well to my cryptocurrency portfolio spreadsheet.
And if you have any questions let me know in the comments below. I will be super happy to see what is your price prediction for BitTorrent in the comments below. Take care, bye.
In this lecture, I will share with you how exactly to choose and buy an NFT on the OpenSea marketplace. The NFT market is really huge with so many platforms out there. I have already shared a few tips on how to choose valuable NFTs across the different platforms. But the methods are pretty similar. So I will demonstrate it on the OpenSea platform. But it doesn’t really mean that you have to buy from that platform. You can choose any platform you like.
How to purchase NFT on OpenSea
For the purpose of the NFT masterclass, I selected the most trusted platforms and the most popular by the time I’m writing this lecture. Probably in the future, there will be more. Of course, I will be improving the course along with the time.
However, I want to give you a few more tips when choosing the right NFT, and I will show it step by step. But it’s very similar if you are doing it on the other platforms as well.
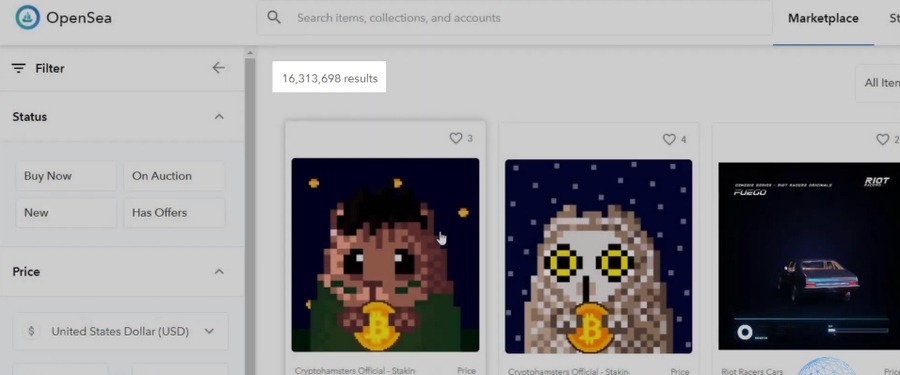
So right now I am on opensea.io. And if I click on Marketplace, we will see all of the NFTs that are available and there are many, we have over 60 million NFTs.
OpenSea NFTs Marketplace
As you know, some are cheap, others are expensive. So it really depends on how much you can afford to spend for an NFT.
You should decide what your budget is rather than just go around and like an NFT, which is much more than what you are planning initially to spend.
So don’t take it as financial advice. But what I would usually do, when I am planning to purchase an NFT, for example, I decided I will be buying an NFT for $500, I’m looking for NFT that is within this price range.
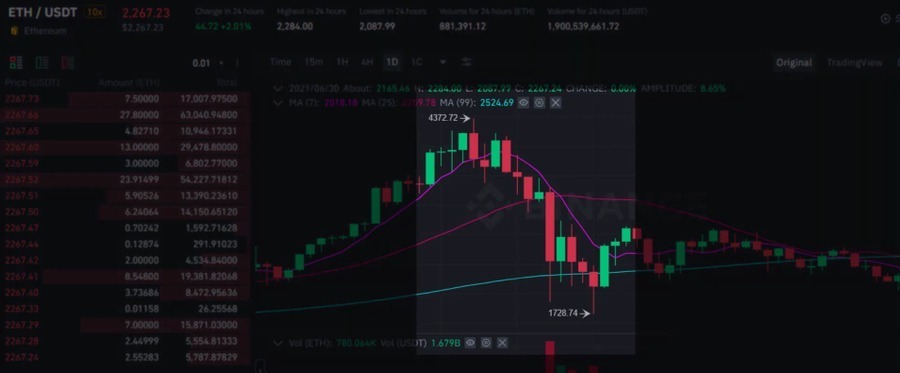
And now my wallet is funded with 0.0194 of Ethereum. For the purpose of this lecture, I will be using that amount and this is approximately $41.58. But in May and June 2021, Ethereum and all the crypto lost more than 50% of their values.
Cryptocurrencies lost more than 50% of their values in May and June 2021
Anyway, that’s the amount that I’ll be spending. But this is, one more time, for the purpose of this lecture. Don’t take it as a recommendation.
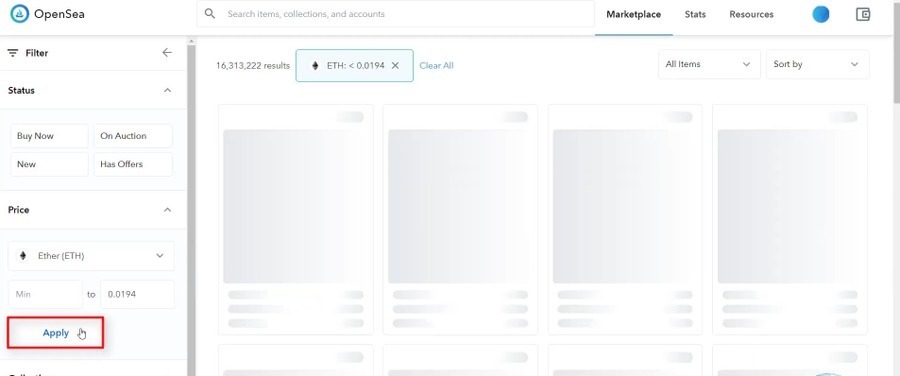
Filter NFTs by price range
I just wanted to pick a small amount, which I will be using for demonstrational purposes. This is my budget, 0.0194 ETH. So what can I do? I can set a price range on OpenSea, it could be in dollars or it could be in Ethereum. And I will switch to Ethereum. I will go for 0.0194 ETH because this is how much I have currently in my wallet and I want to look for NFTs that are within this price range.
So this is my maximum and if I apply, I see all the results.
Filter NFTs by price range
And these are actually 124,946 results if I have to be precise. So all of these NFTs are within this range. So one more time, if you are planning to spend $100.05 Ethereum or 0.1 Ethereum, then you can just put it in the filter and look for all the NFTs that are in this price range.
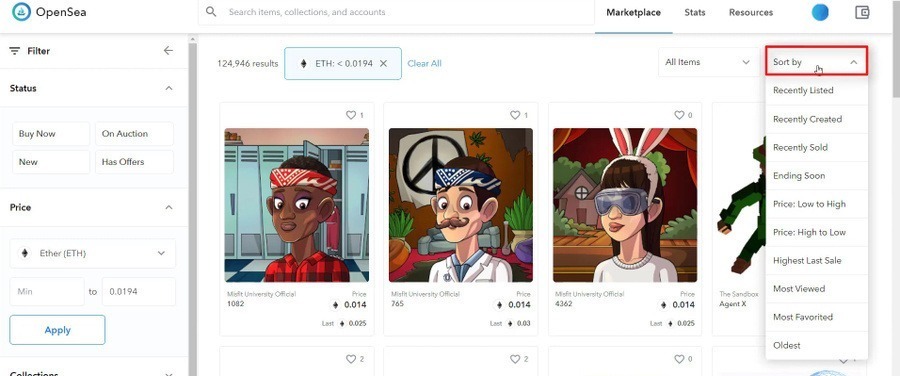
Sorting NFTs on OpenSea
The next thing I like to do when filtering NFTs is to use the Sort by option and we have plenty of options here.
Sort NFTs by option
We can see NFTs that were recently listed, recently created, or recently sold, and we have a few more options. But what I like to use is Most favorited, which means that they will have more likes or kind of hearts.
But on the top, you can see that we have this heart icon, which if I tap on, I will increase the number with 1. I just need to confirm this. And then I can unfavorite it.
But my point of view is that I want to look for NFTs that people like. Because if it’s the other way around and you buy an NFT that no one liked, you will probably have hard times reselling it after that.
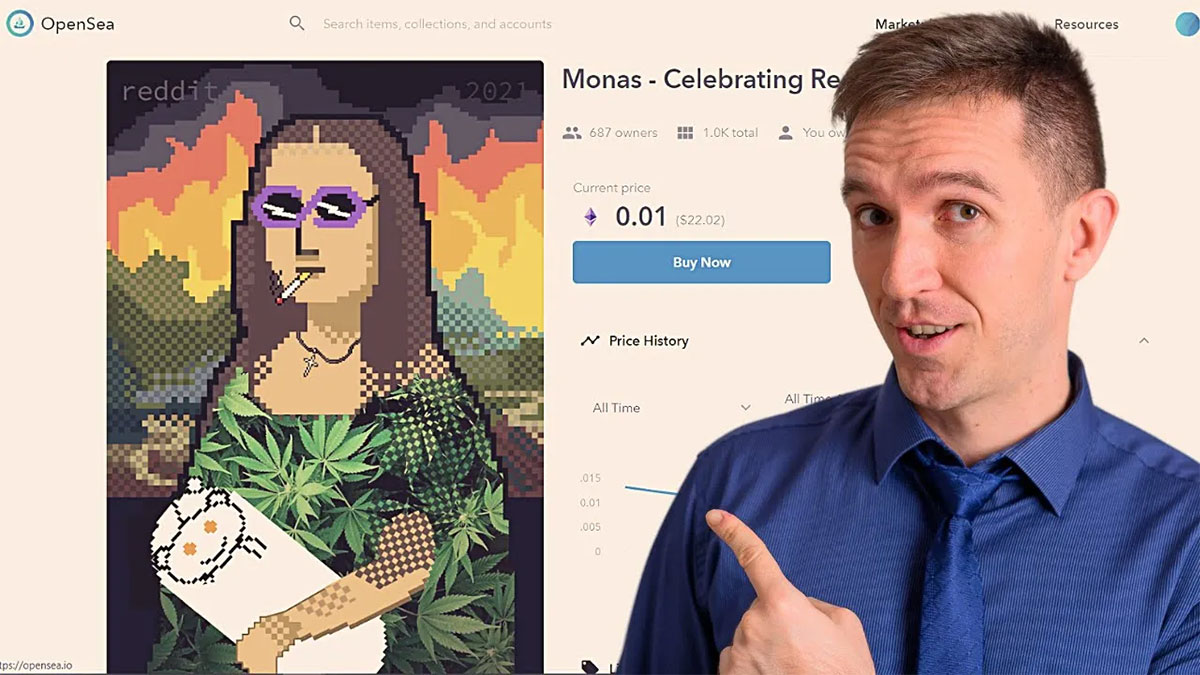
So let’s look at some of the first results. We have those ‘Oops!’ which is from Clucoin. Actually, the first 2 results are from the same seller, and then we have a few more. Actually, three is a Monas NFT which is quite interesting honestly, celebrating Reddit. You see a smoking model with glasses and then she’s holding a kind of baby with the Reddit icon, an interesting dress as well. But let’s have a look at the others as well.
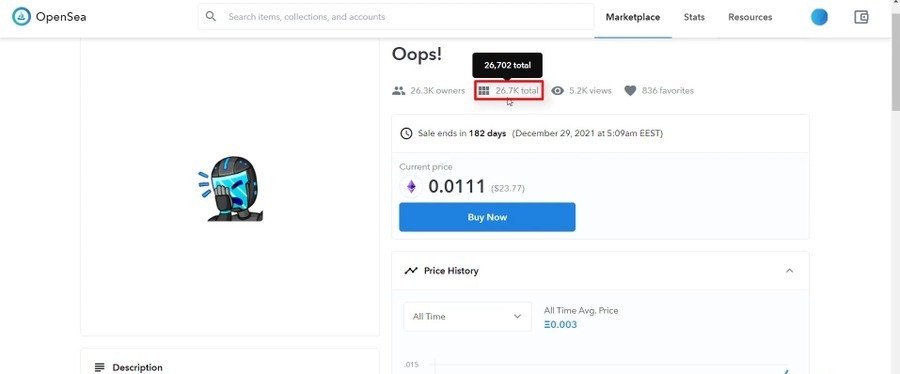
Preview the NFT details
I will just click randomly on any of them, let’s click on the first one that has the most favorites. So you can see that we have 26,700 pieces in total, which is a huge number. We have a lot of views, a lot of favorites, and the average price goes just sideways.
I click on the first NFT
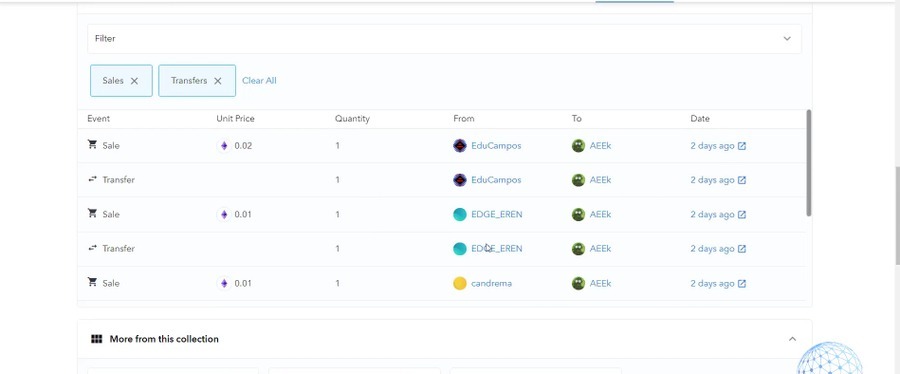
And recently we have had an increment, which is great, but it is based on a small number of sales. You can see a number of sales, 3. And if I scroll down, here are the listings of all the NFTs from this collection. And you can see that the price was more expensive. But the recent listings were at about $40 to $20. And if I scroll lower, you will see the trading history.
The trading history
It was listed about 2 days ago.
What I see, and this was the concern here with me, is that this recent increment in the sales is based on just 3 sales. And for me, honestly, I’m not really impressed with this NFT, I personally prefer to like the idea of NFT.
How to choose what NFT to buy on OpenSea
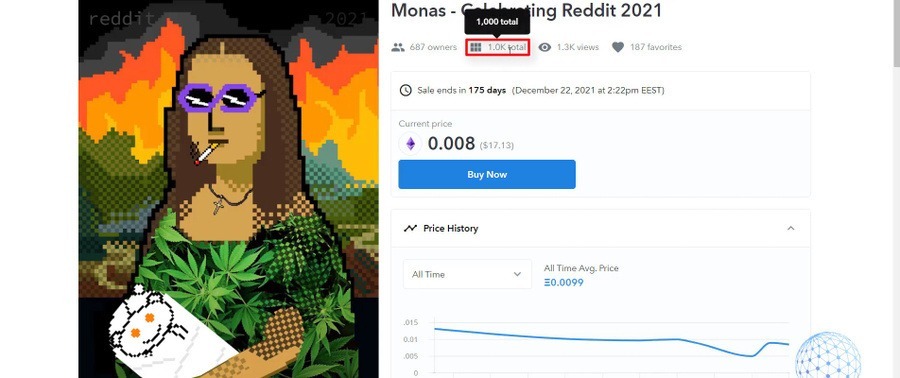
Let me click on the NFT with a Monas, which caught my attention because of so many different things in one simple picture. And it’s about Reddit, which is a huge form for NFTs and for crypto especially.
The Monas NFT
So what we have here are 1,000 total NFTs, which is much better. We have already 687 owners. We have views and favorites, which is great. This is the average price which decreases and here it increases again. Again, it has recently increased a little bit based on a few sales again.
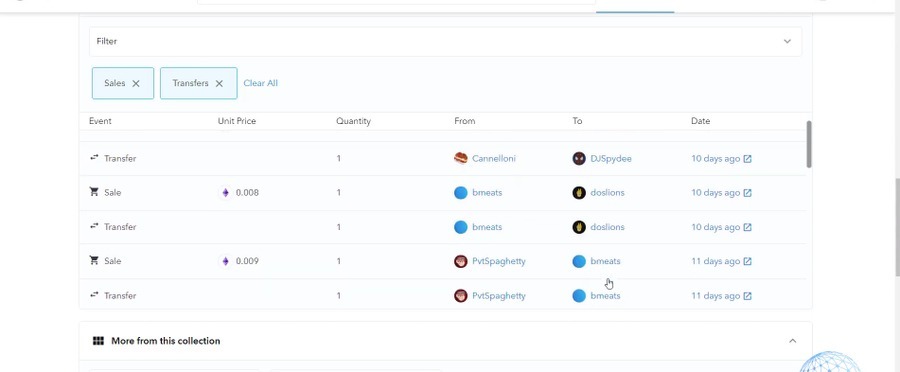
But you see that All Time Average Price is 0.0099 ETH, while I can buy it for 0.008 ETH. And if I scroll down, you will see the listings. And here is the trading history. So let’s see what we have in the trading history.
The trading history
It starts about 16 days ago. Already many people bought and it looks pretty decent. Not really the best NFT I could look for.
Buy NFT on OpenSea
I don’t want to make the lecture too long where I’ll be scrolling around different NFTs, I just wanted to give you the idea that we want to have the NFT collection, which recently increases in price. And it’s better if it has more sales. At the same time, you want to see that people are buying it. So I will just buy this NFT for the purpose of this lecture as a demonstration.
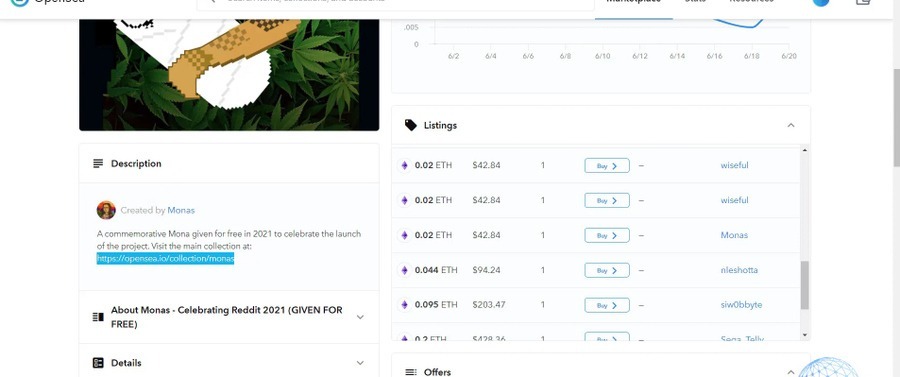
And then one last thing, you should have a look at the creator, created by Monas and we can see the main collection when clicking on the creator name.
Information about NFT creator
Let me just quickly open it so we can see what exactly we have in there. Probably, we’ll see similar NFTs with Monas that represent different things. We have over 1,000 items. We have an average price of 0.03 ETH and already 14.9 Ethereum volume traded. So yes. Different Monas, very similar to the one we saw.
So I can look for something more interesting or something that will grab my attention more. Or if you find more value in any of those or if you’re a fan of Tesla, for example, or if you want to have a Monas with Dogecoin or with Kitty, you see a lot of things combined into one.
Opensea Gas Price
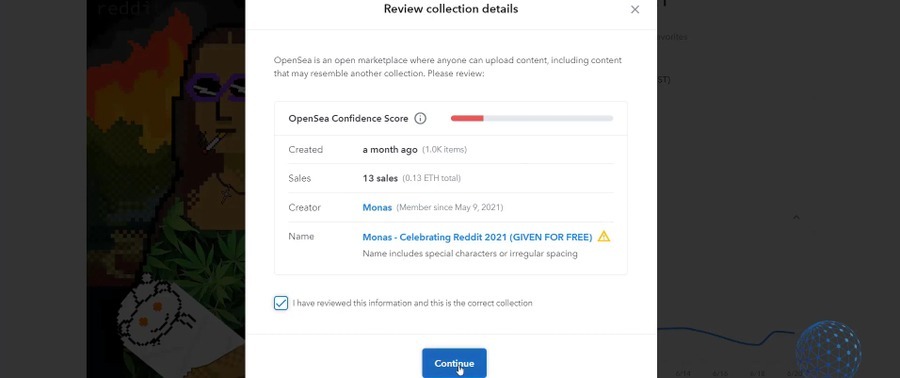
But what’s interesting here is that actually people are buying these NFTs on OpenSea and I would be just buying the first Mona that I have noticed for the purpose of the lecture. And I will just demonstrate how it works. I will click on Buy. Now, I have some summary. I have reviewed this information and this is the correct collection. I will tap on Continue.
Review collection details before purchasing NFT on OpenSea
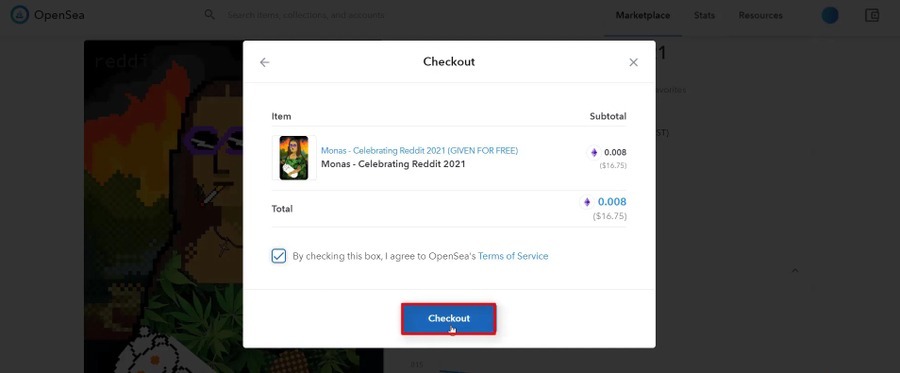
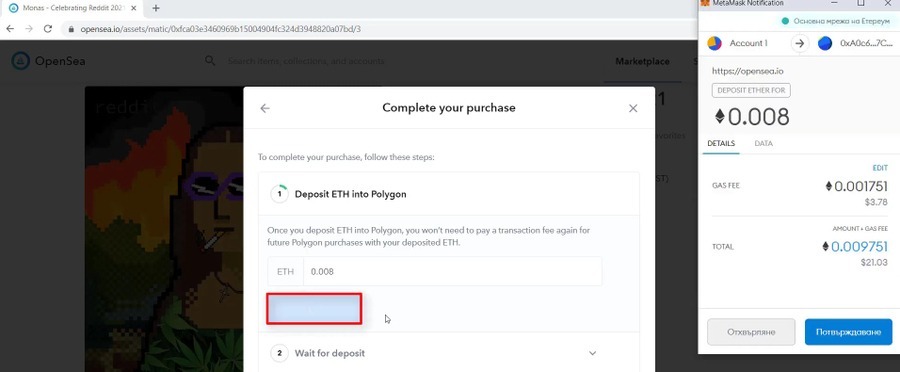
And then what I have, it’s about $16.75 or 0.008 of Ethereum. I will just check out, and then I will click on Convert, which opens the MetaMask notification bar.
I click on Checkout
And you can see that I will be paying an OpenSea gas price of 0.001751 ETH, which is approximately $3.78. So this example gives you an idea of how much gas fee I will be paying for such an NFT.
I click on Convert
I will click on Confirm and then it will take a few seconds for the deposit to go through into Polygon. And then I will show you the next steps. So bear in mind that we always have guest fees, some people predict and there are some plans for updates on the Ethereum network that the guest fees will be removed.
Unlocking the currency
Personally, I’m a bit skeptical because of many reasons. If it happens, of course, it will be great. It will be very bad for the Monas because they will be getting less. But this is for the future, we don’t know if this will happen or not. In a few minutes’ time, I see the message that says ‘Wait for deposit’.
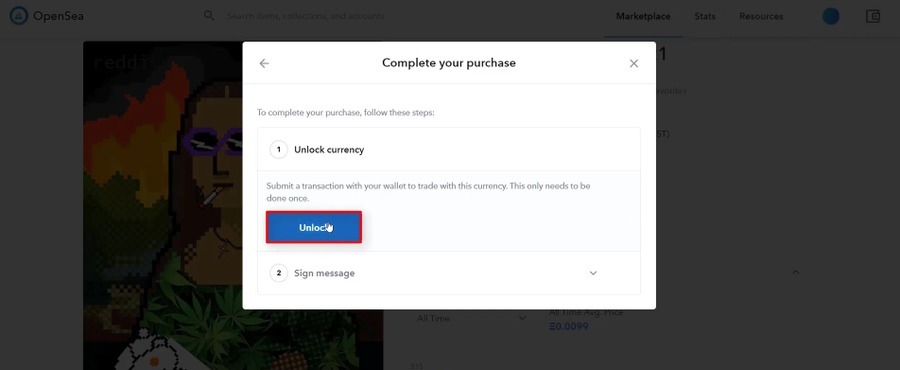
Your deposit is pending and may take about 10 minutes. You may leave this page or keep this model open and check back later. So give it another 10 minutes. In a few minutes’ time, I need to unlock currency or the message says ‘Submit a transaction with your wallet to trade with this currency. This only needs to be done once.’
And I click on unlock and again I forward it to the MetaMask wallet and I will just sign it.
I click on Unlock
And it’s loading, unlock currency transaction successful, and then sign message. Sign a message using your wallet to continue. I will click on sign again and one more time, I will just click on Sign, and here we go. It’s processing.
Just follow the easy steps
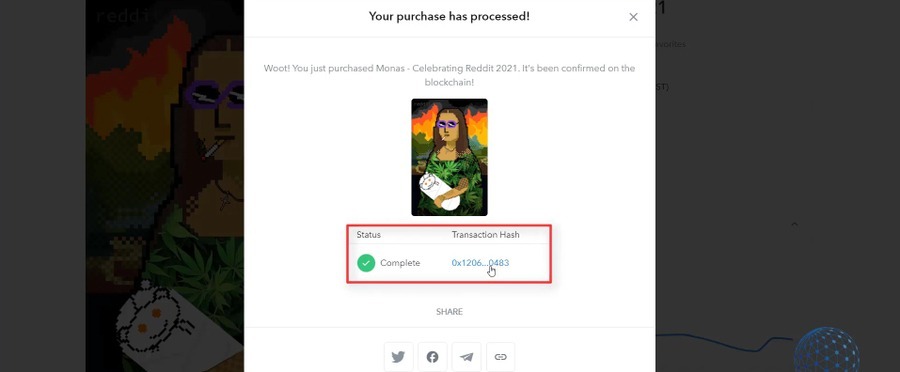
It says, ‘Woot! You just purchased Monas – Celebrating Reddit 2021. It’s been confirmed on the blockchain.’ And here is the Transaction Hash, and here we go.
The Transaction Hash
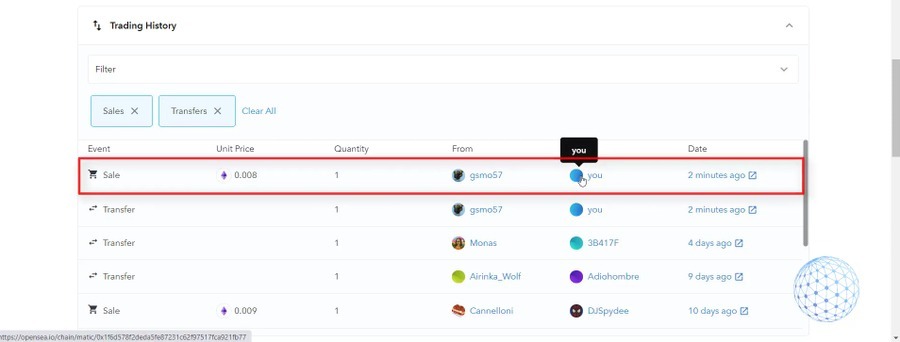
And now if I scroll lower in the trading history, here it is, from gsmo57 there was the transfer and the sale, for 0.008 Ethereum 2 minutes ago, to you or to me.
The transaction history is updated
So the transfer is ready, if I click on my profile, it’s still unnamed.
I have created it for the purpose of the lecture. So here it is, it is inside my wallet and I am already the owner of this quite interesting NFT. One more time, I have selected it quickly and bought this Mona to demonstrate how to buy NFT on OpenSea. Really easy by the way, you just follow the steps and here it is. The NFT is right into my wallet. I can give it another favorite. And pretty much that’s all.
This is how you can buy easily NFT on OpenSea. And it is very similar on the other platforms.
In today’s lecture, I will tell you what is a realistic price prediction for Holochain crypto coin or HOT as some investors know it. I will share with you what is my current investment with Holo, why I have bought just 6,500 coins, and I will share with you what you need to be careful of.
Holochain Price Prediction
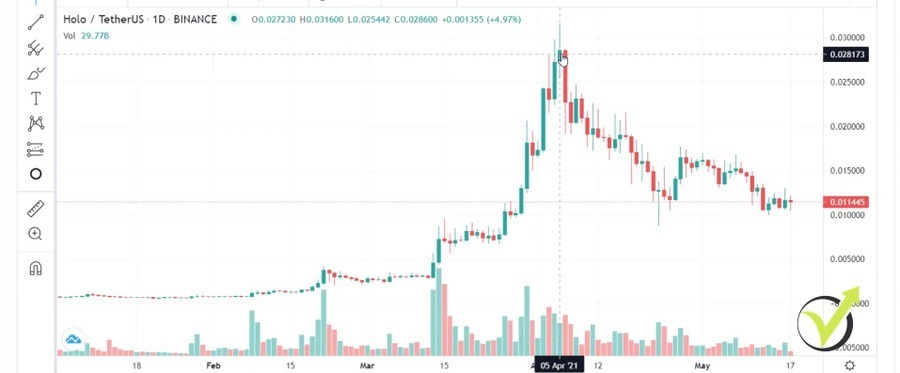
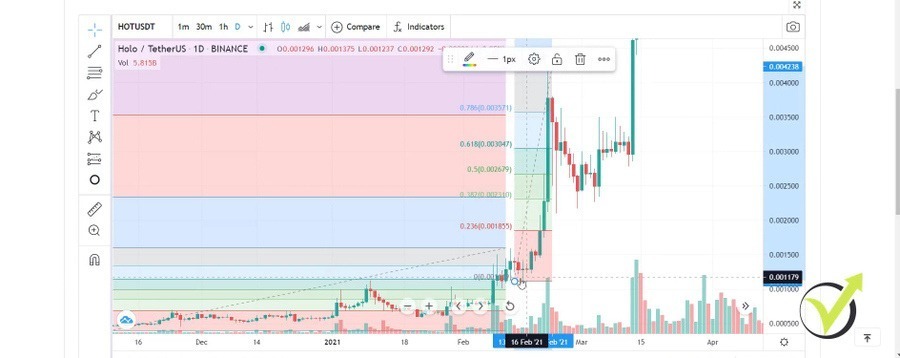
Holo or HOT which did an amazing move in the last year. The price did a great move starting from mid-February 2021 from about $0.001 reaching to the top which was on the 5th of April and the price reached $0.0316.
Holochain price movement in 2021
But then it lost a lot of its value which gave me a good opportunity to buy it and I’m looking for a second opportunity to buy the HOT.
Holochain community
So right now, I am on CoinGecko.com, a great website for analysis. What I like the most is that they have integrated Trading View which is one of the best platforms to use for price action trading. And I will show you my current setup, I will show you exactly how I draw the lines, and I do the whole Holochain price prediction. If you are new to CoinGecko, and I’m not promoting the website or anything, just using it.
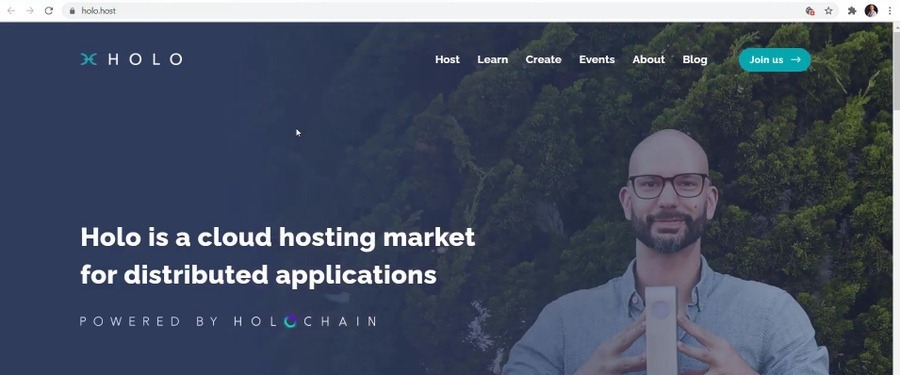
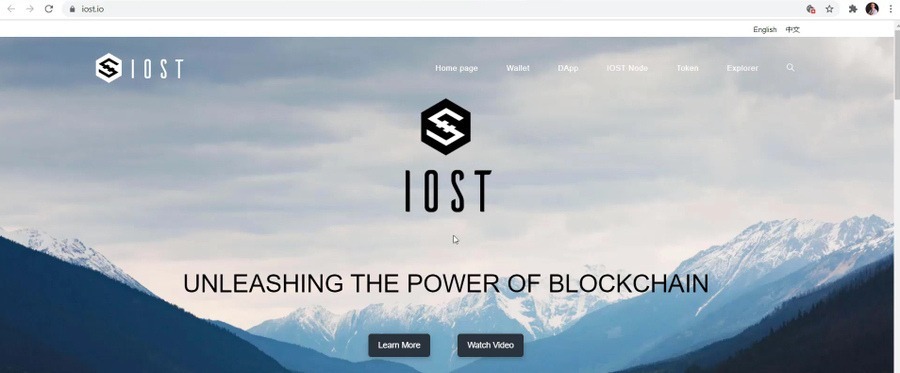
What you need to pay attention to when you are choosing a cryptocurrency to invest in is a couple of things. The first is the website. Do they have a professional website? So if I open, for example, Holo.host, you will see quite a professionally designed website with the community, with the development projects, they have a Forum as well.
Holo website
And they have a lot of educational stuff which makes it trusty. However, I just look at the website, I don’t dive into it. What I care the most is the community. So they have Reddit, Twitter, Facebook, Telegram, and Bitcointalk. But I look usually at Reddit and Twitter. So if you look at Holochain’s Reddit you will see that they have above 21,000 agents, and as well on Twitter, they have above 74,000 followers which is a pretty decent community.
The support and resistance levels
Now, going back to the chart, I want to focus on what is the Holochain price prediction and I will share with you how I reached there. We are looking at the last few months after the price did that amazing move and when I’m looking to buy the asset or to identify potential targets and a crypto price prediction, I always start from the basics going to the more advanced stuff.
So the first thing is always the support and resistance levels.
For the beginners, the support and resistance levels are the levels where the price stopped a few times.
For example, right over here at $0.0010, I’ll just make it as a precise value at $0.01 or we can say this is 1 cent. The price actually stopped just before the 1 cent, then it retested it and continued higher.
The $0.1 level is a strong support level
After that, the price stopped right there again, even broke a little bit lower but there was no day closing below the 1 cent and now recently the price stopped exactly at that level. And if you see the lowest point of this candlestick on the image above, you can see the exact value right over here is $0.010001. So it stopped exactly at 1 cent which means that this level is a strong support level.
In other words, the buyers don’t allow the price to drop below 1 cent. And when there is a strong support level, I always look for buying opportunities. And one last thing to mention about the support, the more times the price stopped at that level, so right here it was resistance then it was a support, second time support, third-time support makes it an important level.
The uptrend
As well, if we are back on these times right in March 2021 when the price climbs from $0.003 to $0.0089, obviously, the next roundish number is $0.01 which is the 1 cent. So this is the first important thing to point out. Here we have strong support at the 1 cent or 0.01 of the dollar. Where was my first investment?
I used exactly that bounce right there, so this is called to be a Doji candlestick which is a reversal pattern.
When the opening and closing prices of a security are almost equal within a given period of time, a Doji candlestick is formed and usually signals a reversal pattern to technical analysts.
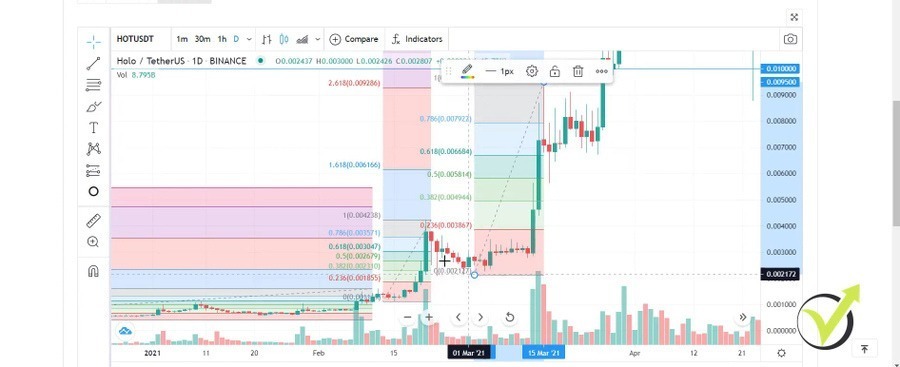
Even the price after that continued a little bit lower, then continued higher, so I saw that this level is actually important, the 1 cent, and then I was looking for buying opportunities. As you probably have seen in some of my price prediction videos, you will know that I use the counter-trend lines which are awesome tools to show me where to buy the asset. So I draw them against the trend.
Obviously, until that moment we’re in an uptrend. We have a series of higher highs, higher lows, which identifies the uptrend. If I put some moving averages they will be showing upwards. But then I don’t want to buy just somewhere randomly. I want to use a retracement. I want to buy when the price loses some of its value and this is where I want to enter.
Drawing the countertrend lines
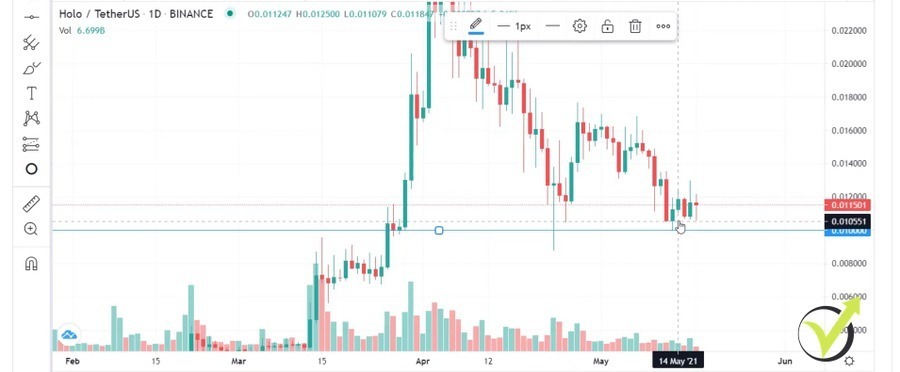
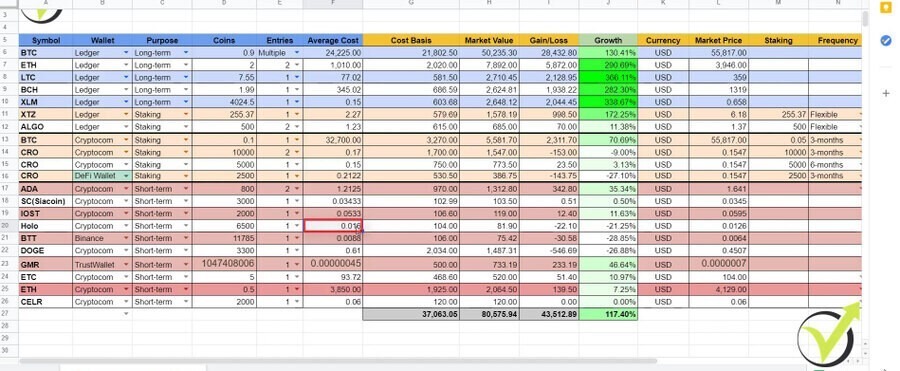
And I usually use the countertrend lines so I draw them against the major trend and when the price breaks, this is when I usually enter. And if you look at my cryptocurrency portfolio spreadsheet, I have entered the Holo right at $0.016.
My Cryptocurrency portfolio spreadsheet
And I have bought just 6,500 coins which was an investment of $100 just because the price lost a lot of its value.
I will show you the retracements a little bit later. And when there is a huge drop I can expect a further down movement and I would buy more at a cheaper price to improve my average price.
However, the price went just sideways since then and now I’m looking for one more opportunity to buy it. But one more time, this is a small investment of $100 which I am implementing recently in my portfolio strategy.
So I’m purchasing cheap coins with just about $100 and then I’m chasing bigger percentages as growth. And actually, if you want to find my portfolio spreadsheet, you can check out my Patreon’s page where I share all of my investments. I simply send crypto buy and sell alerts to my followers. So right here I had a great sale alert with Ethereum and I took amazing profits right on the top.
I make weekly updates
Currently, it’s on a much lower value and Ethereum just lost a lot of its value. And as well on my Patreon’s page, you will be able to download the spreadsheet which I update regularly with all of my current investments. This is what I have currently in my wallets and on the exchanges. I have the growth right here so this is like the total investment I have at the moment.
What’s the market value and what’s the growth? And once a week I update the values in the market price and all the rest updates automatically with a formula behind.
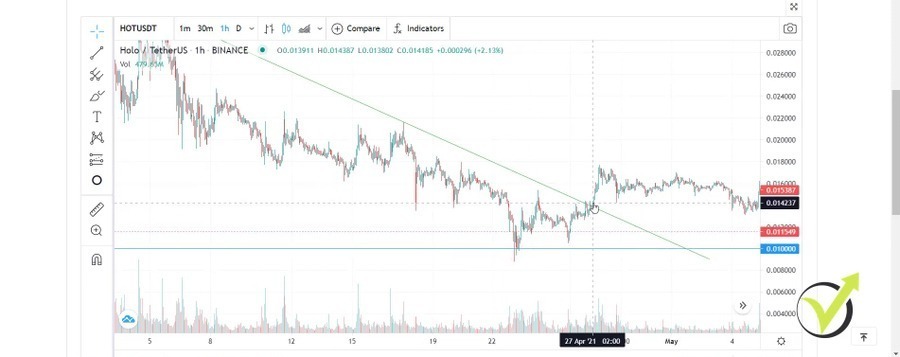
So this was my entry, one more time, at $0.016 and I will go to the 1-hour chart to show you exactly where I have bought it. So if you want to draw precisely, you better go down to the 1-hour chart.
For the beginners, each candlestick represents 1 hour.
So here was the bounce from the $0.01 level then there was a break of the counter trend line.
Break of the counter trend line
However, I wanted to see this high broken first which sits at $0.015 to make my Holochain price prediction so I opened the trade at $0.016 right over here. One more time, I wanted to see the price breaking this small top over here.
The value dropped after a few negative Elon Musk tweets
So we are back in an uptrend on the hourly chart and I had my entry somewhere right here at $0.06, something like that. Now, after that, the price just went sideways, lost a little bit of its value together with the Bitcoin recently after some Elon Musk tweets that nobody liked but that’s another story, I’m not going to talk about it.
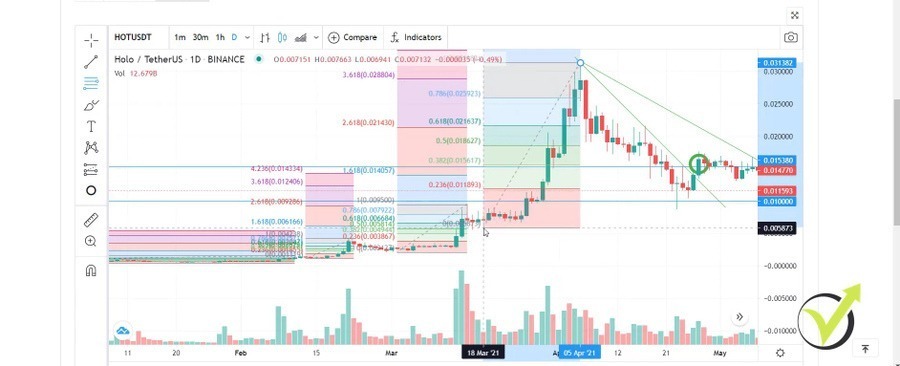
However, the market is being quite negative recently, which gave me another opportunity to draw another counter trend line. So right now I’m looking to buy the break of this counter trend line which happened right here but immediately the price pulled back lower and it didn’t continue higher. So now if the price breaks the counter trend line, I’d be happy to buy somewhere at $0.013, right over here I want to see the break.
I want to see a higher high than that one. So if the price forms something like that, that would be great for me to buy. Because I will have a break of the counter trend line, I will have the support level of $0.01, and then I will have a higher high which forms a new uptrend on the hourly chart and I will improve my average price.
Don’t put all of your money into a single crypto coin
So, for example, if I buy for another $100 at $0.013, my average price will go somewhere to $0.01450 or something like that. So very important here is when I want to invest in an asset, I don’t put all of my money into it. I have a portfolio as you saw on my spreadsheet and as well if you look, for example, at Bitcoin, I have bought it multiple times.
Some of the others I have bought 2 times, some I have bought 3, 4, or more times. But the idea is that I’m looking for different entries just when the price shows strength and a new uptrend coming on the hourly chart. And if the price drops, I’m just averaging the price and improving my price so when the price goes up on profit again, I will have much more if I entered with all of the money that I planned for this asset from the first time.
Hope that’s not too complicated, guys, but this is my first entry and I’m looking for a second one after some time. If the price drops lower that’s fine. I’ll be looking for lower entries, lower counter trend lines, so I’ll have even a better average price. How do I determine my targets and what is the realistic Holochain price prediction? This is what I’m talking about right now.
The Fibonacci retracements
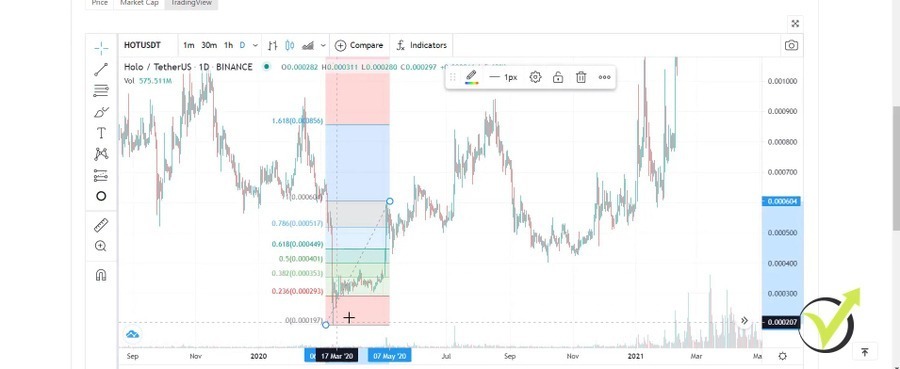
I start from the beginning of the uptrend so I’ll switch back to the daily chart and you will see that the new uptrend started from right over there. So right over there, you see that the price goes down. We have a series of lower lows and lower highs which forms the downtrend. And the first move from the new uptrend is this one over here. I will take a Fibonacci retracement and put it on the chart.
The Fibonacci retracement
So this is the first move from the new uptrend and I take a Fibonacci retracement starting from the top going to the bottom. So I’m drawing it from the top to the bottom. Then what we have with the Fibonacci, I have explained it in a couple of my price prediction lectures, but I will explain it as well in here, we have retracement levels. So all of these levels starting from 0 – 100, we have 78.6%, we have 61.8%, we have the 50%, 38.2%, and 23.6%.
So these are potential levels where we can expect the price to drop and you can see at this level it dropped just below 61.8. But what is the thing that I’m using right here are the targets. So on the top, you will see that I have targets and I have 4 targets. And I usually use the second one, 2.618.
What to do when analyzing a new asset or chart
So when the price reaches that level, I usually take profits and when I’m analyzing the chart or if you’re just starting analyzing a new asset, a new chart, what you should be doing is when the price reaches the second target, it does right over here. I take the next high and I draw a new Fibonacci to the lowest retracement which in this case is this level over here.
The 2nd Fibonacci
And then what I have is a new Fibonacci and you can see that the price did another retracement to the 61.8, then it continued higher, and then let’s see where it reached, the second target right over here. So what do I do next? I take another level, I draw it from the top, and I stop at the lowest retracement after the last Fibonacci which is right over here.
The 3rd Fibonacci
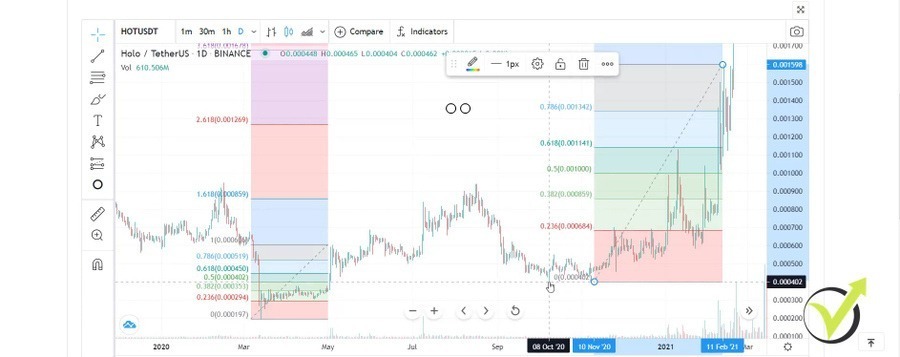
And then the same thing repeats but right here we had a better retracement which went below the 38.2. So you see the price dropped and then it continued higher reaching the second target again, I will show you exactly so you see how well it works. This is the second target, the price just reached it perfectly and I will draw another Fibonacci starting from this top going to the bottom, right over here to make a precise Holochain price prediction.
The 4th Fibonacci
A small change in the Fibonacci will cause a change in the target
And when I say the bottom, this is the lowest retracement. And then we have a new Fibonacci target which was reached, not with this top but with this candle over here and this is actually the top. So now I will take from the highest point that we have going to the lowest retracement after the last Fibonacci which is this one over here.
The 5th Fibonacci
Stay with me, guys, it might sound complicated but it’s not. I will explain it very simply. So this is the lowest point and here we go. So now what we have is we have the new Fibonacci retracement levels and in this case, the price dropped down below 23.6% which is a huge retracement, you can see it’s marked in red already with the Fibonacci levels.
But what we have on the top are the new targets.
The first target sits at $0.0472 and the second one sits at $0.0730. And this is the realistic Holo HOT price prediction I have if the Holochain price continues higher and reaches new record highs for the year.
Now, let me draw this Fibonacci, the last one, very precise so we’ll know exactly what is the level because a small change in the Fibonacci will result obviously in a change into the target as well.
My realistic Holochain price prediction
So right over here I will just draw it to the lowest point, it’s right over here. That’s it. Let’s check out, one more time, where is the second target of the Fibonacci, is at $0.0735. So let’s say $0.07 would be my next realistic price prediction for Holochain HOT crypto. And after that, if the price reaches this level, I will have a new Fibonacci starting from the new top which could be here, could be here, could be even higher, I don’t know where it will be.
But then I will draw another Fibonacci going to the lowest retracement. We can have a new retracement but then I will have new targets which will be higher and probably I’ll be updating the lecture at that moment so you will see exactly where it is but I hope it’s really clear how I draw the Fibonaccis starting from the lowest point when the price reaches the second target, I draw a new Fibonacci from the top to the lowest retracement after the last Fibonacci.
And this system, I have explained very clearly and in detail in my Cryptocurrency Investment Strategy course which will help you to learn exactly how I do all of these analyses. And in the course, I have recorded many live examples of taking trades.
Conclusion
So usually, I use the Trading View platform to do the analysis but I buy the assets from the exchanges such as Binance, Crypto.com, Coinbase. I have put links in the reviews of these exchanges if you want to take some bonuses when registering. So this is my realistic price prediction for the Holochain HOT crypto. One more time, I’ll be buying again if the price breaks the aggressive counter trend line.
I’ll let you know on Patreon if you are following me in there. And if the price drops lower, it might be if Elon Musk keeps tweeting negatively about Bitcoin and the whole crypto world. But I believe personally there is a huge potential in HOT and Holochain because of the idea that stands behind and the nice community they already have.
So keep an eye on the Holo, it might be a great investment for the rest of 2021. If you have any questions, let me know in the comments below. I’ll be preparing more lectures about price predictions and if you don’t want to miss them, make sure to subscribe to web push notifications from Trading Academy.
Today I’ll be talking about the metal Visa card from Crypto.com and actually, it is really metal which surprised me. However, that doesn’t really matter. What matters are the benefits that we get from using such card. And actually, the best thing for me is the cashback. So every time I make a purchase with the Crypto.com Visa card I get cashback.
My Crypto.com Visa card has recently arrived and I’m already using it. So in this lecture, I’ll be showing you what are the benefits, I will show you how you can top up or fund money into your card and I’ll be unpacking it. And all of that I will do just in a second.
The Crypto.com Visa card arrived in a relatively nice package, to be honest with you. Inside I had a letter from the co-founder and CEO, Chris. But what I liked the most was the pack where the card was. It’s very nice. Not like how we get the cards usually from the banks. Anyway, that’s not important.
The Crypto.com Visa card cashback
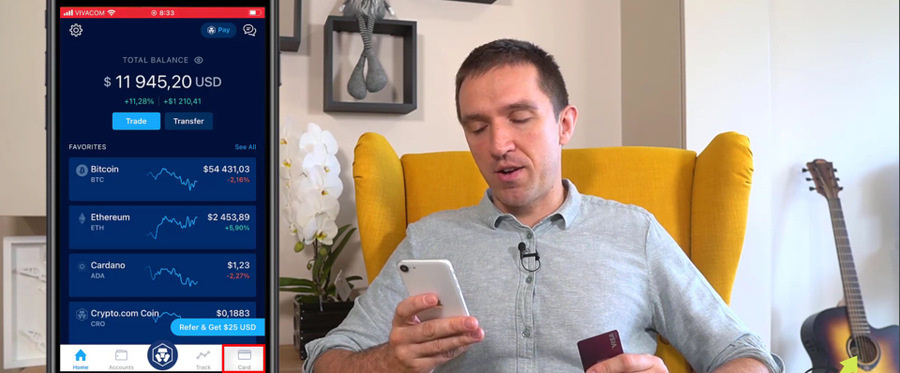
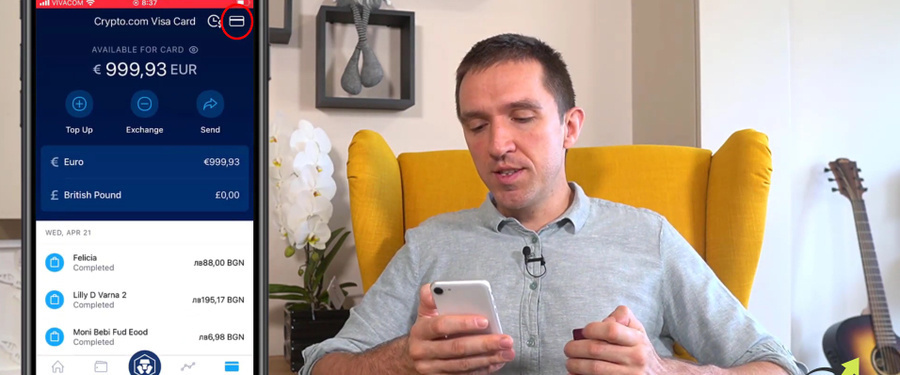
So now what are the benefits of using such a card? I guess that’s the most important thing in this lecture, so you can easily decide if you wish to have a Crypto.com Visa card or not. Now, I have opened here the Crypto.com app and I will show you where is the Visa card, it’s right over there in the bottom right corner.
Where to find the card on the Crypto.com app
I have available nearly €1,000 and then below I can see all the transactions I did yesterday. And I see most of them in the local currency which is Bulgarian Levs.
So for all of these payments that I did on POS terminals, I got cashback. And with the Ruby Visa card, the one I have at the moment, we get 2% cashback.
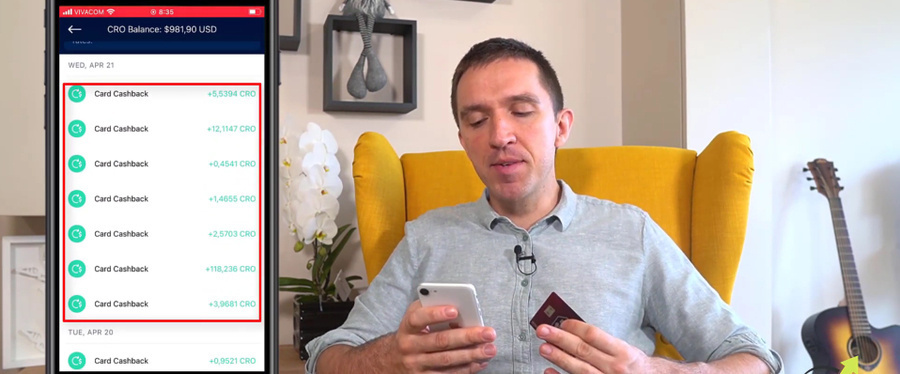
So for every $1,000 or €1,000 I spend, I’m getting back €20 in CRO coins. One more time, I’m getting them in CRO coins, not in Fiat currency. I’m spending Fiat currency but I’m getting back the cashback in CRO coins which is the native token on Crypto.com.
And if I go back to Accounts now, and I tap on Crypto Wallet, and I tap on Crypto.com, CRO, and I scroll. You will see that for all the transactions from yesterday I got CROs. And I had one payment of nearly €1,000, actually, it was about exactly €1,000, I have received 118 CRO coins.
Crypto.com Visa card cashback
Best way to use the Crypto.com Visa card
So it depends on how much the CRO coin currently is and simply I’ll be getting 2% of the amount I have spent converted into CRO coins.
So the best-case scenario obviously is to use the card for a long time when the CRO coin is still cheap. Then when the CRO coin rises in value, we will be having a lot of CRO coins into the account and make more money.
However, we don’t know if this will happen for certainty but I am spending this money anyway. So why not getting cashback in cryptocurrencies? I love the idea, I think many people love the idea as well because it’s much better to have a debit card with a cashback rather than a credit card with a cashback.
I’ve been using this card for a couple of days. And if I tap on the card in the right-hand upper corner, you will see that from here I have the option to freeze it, that’s good if you lose it.
Tap on the card in the right-hand upper corner
Then I have the option to view the PIN but I have to confirm my date of birth every time I want to see the PIN code. And then I have the option to view the card number, which requires me to identify, one more time, with a fingerprint.
And if I go back and tap on Crypto.com, you see that I have 209 CRO coins which are about $40.
So these are already all the CRO coins that I have as cashback using the Crypto.com Visa card for a couple of days. And then below is the amount I’m staking to have that card. So for the Ruby card you need 5,000 CRO coins to stake. It was that much actually when I was ordering, by the time you’re reading it could be different.
And because the value of CRO coins changes, now it is about a certain amount of money that you should be locking and staking instead of a precise number of CRO coins.
And if you decide to stake for a Visa card, you can get a bonus by using my Crypto.com referral link. You will be supporting the Academy and you will see what are the current conditions by the time you are reading this lecture.
Card variations
And I have the option to upgrade and I’m planning to upgrade the Crypto.com Ruby Visa card to the next one. So that’s the one I have at the moment is getting 100% cashback on Spotify as well.
But I will be upgrading to the €3,500 card which actually will bring me as well some additional benefits but what’s most important is, it will bring me a 10% CRO reward from staking the CRO coins. So while I’ll be using this card for purchasing and getting cashback, at the same time I’ll be getting a 10% annual CRO stake reward. So for all of the CRO that I will keep as a deposit, for having such a card I’ll be getting as well annual reports.
And if I scroll to the right, I see the other Crypto.com Visa cards which are more expensive but that’s a personal choice which one you would like to use.
Card funding
And the last thing I want to show you is how you can top up the card because I saw many videos on YouTube, comments that people have hard times funding this card.
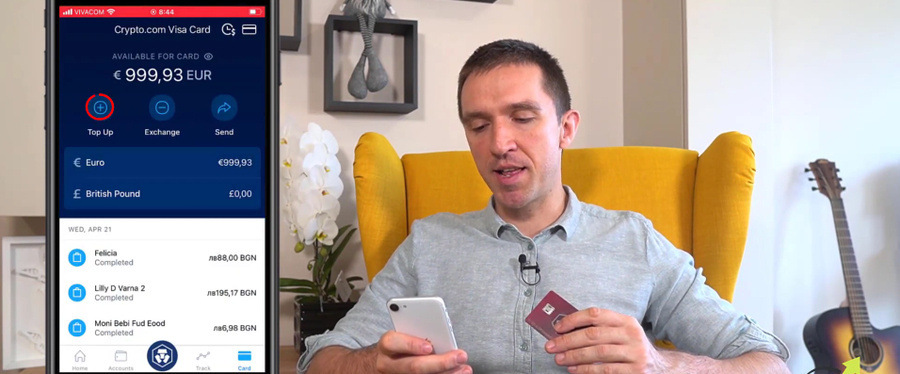
And many people ask if there is an IBAN, no there is no IBAN. That’s just a card that you connect with the app so you cannot send money with a wire transfer to a bank account to use for the Crypto.com Visa card. It doesn’t work this way, you connect the card with the app on your phone, and from the app, you fund the card super easily. If I tap on Card again and I tap on the + button which says Top Up, I have a few options available here.
Tap on the Top Up button
“Crypto wallet” means that I can fund the account with any of the cryptocurrencies I have in the wallet. Then I have “Fiat wallet”, so if I have Fiat currency in my account I can use it but I usually don’t keep Fiat currencies in my app. I buy cryptocurrencies, I trade, I stake. Personally, I prefer to use my money to work for me instead of keeping them as a Fiat currency.
And then I have the option to fund the Crypto.com app with a credit card which I have used until the moment which in the first month is with 0 fees. I’m not sure after the first month if there will be a fee or not. But if there is a fee after the first month, the best way then will be to fund your Crypto.com app with a wire transfer so the money will go to the Fiat wallet.
And from the Fiat wallet, you can easily fund your card. I use the term “fund” because we are actually funding from the app to the Crypto.com Visa card and from there we pay. And from each payment, we get cashback to the app in CRO coins. So pretty much that’s all you need to know about the Crypto.com metal Visa cards and I personally plan to upgrade it because, the next one, the 3,500 one, will bring me 3% of cashback instead of 2% which is a percent higher.
Conclusion
If you have any questions about this Crypto.com Visa card review, let me know. And don’t forget to check out this link if you decide to get such a card and benefit when you are paying every time.
Thanks for reading, I will see you in the next lecture. Let me know in the comments below what is your experience with these cards so it will be more useful for everyone reading this lecture.
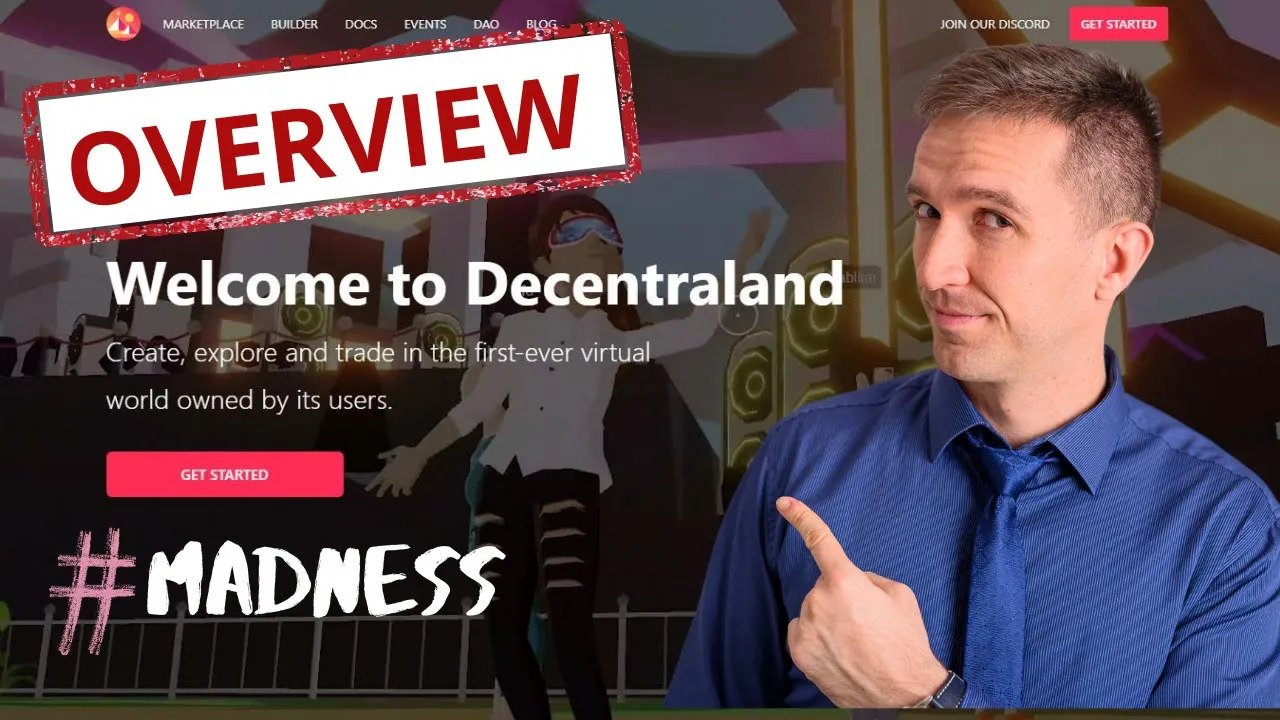
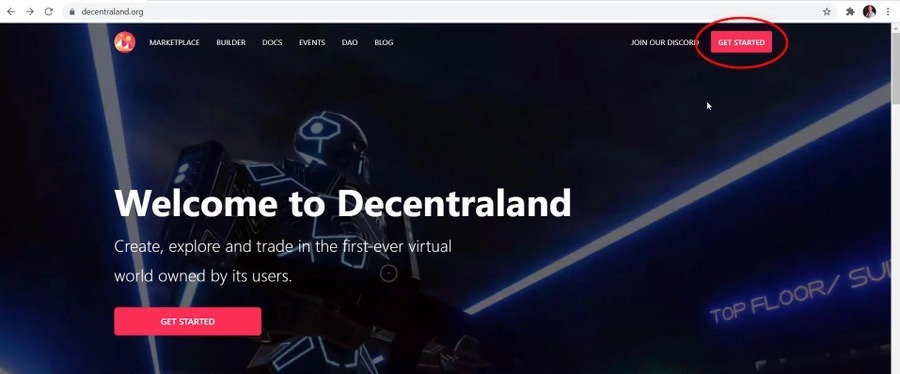
In this lecture, I will show you the Decentraland platform and their NFT game, which is the first-ever virtual world owned by its users. So I guess this platform is for the younger audience, but it’s a fact that the virtual world will be part of our lives one way or another. And especially the young generation is very keen on that. And I will share with you some of the pros and cons you need to bear in mind before jumping into Decentraland NFT game.
Getting Started with Decentraland NFT Game
So first things first. Let’s get started.
Click on Get Started
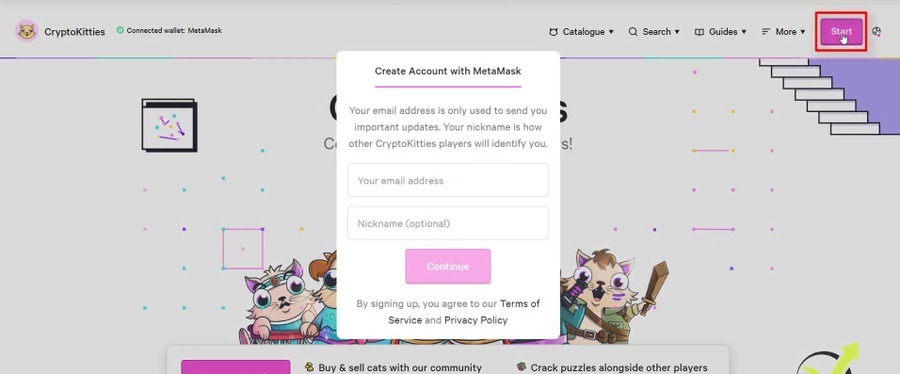
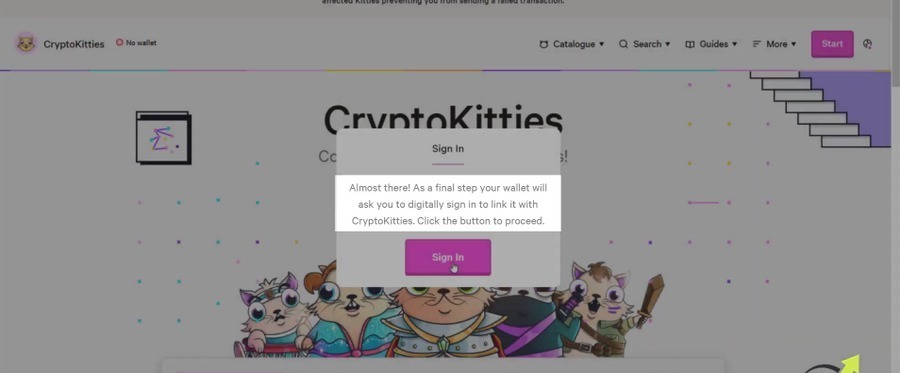
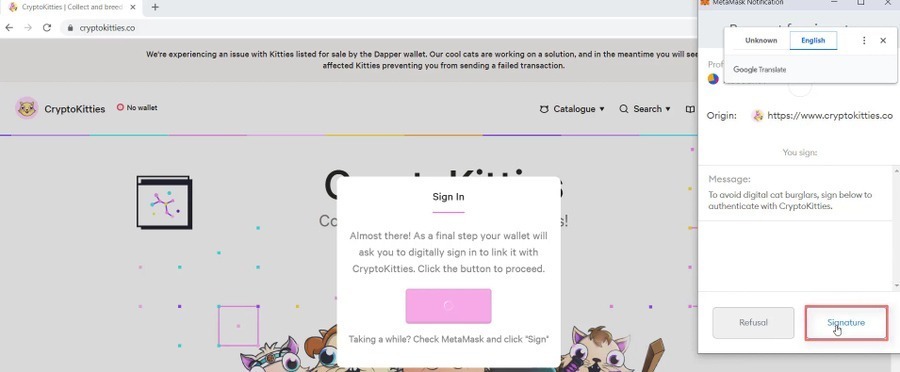
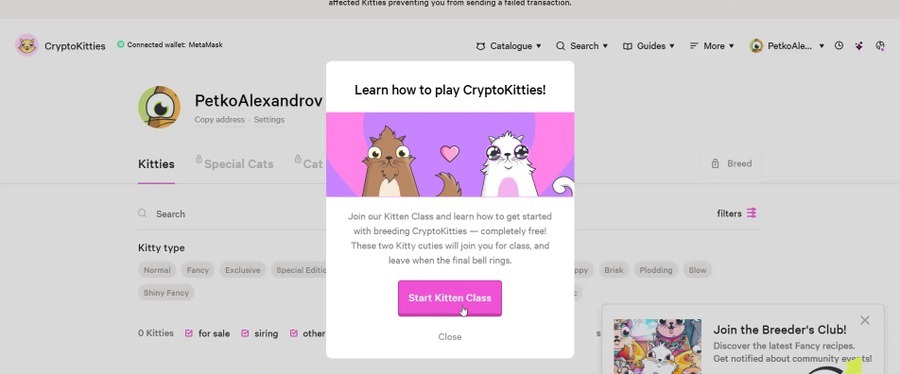
I will need to sign in or create an account. I have a Metamask account, so I will sign in with this account. This is the account where I have the Ethereum. After I connect Decentraland to my Metamask account I will need to create my NFT game avatar. You can choose what is your hair, for example.
Customize your avatar
Or I can choose something not even close to mine. But you got the point. From here we can choose what hair we have. Then we have eyes, mouth. I’m not going to play with these options now. Then here you can set up your profile, how you want to be dressed in this virtual world, what type of shirt you want to wear.
Then you have the bottom, then you have the shoes, accessories and many more.
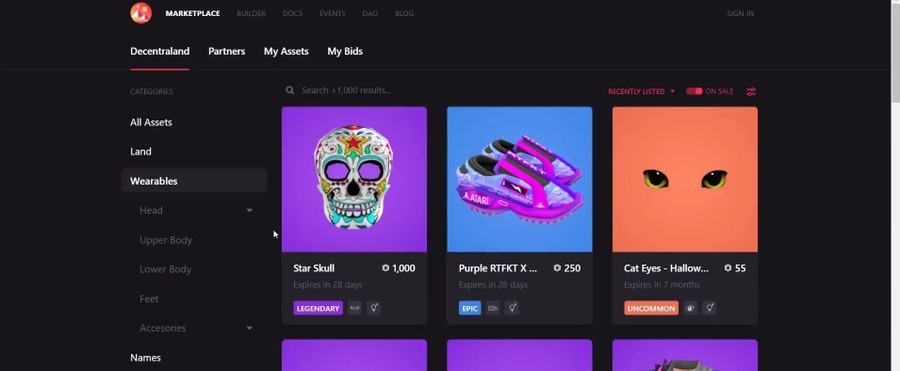
Decentraland Game Marketplace
Then we have the collectibles, which I need to purchase if I want to have them. So now I will go to the marketplace and I will show you what type of assets we have in the Decentraland NFT marketplace. And pretty much we have everything here. We have some masks, eyes, we have shoes and a lot and a lot of things to go through.
Decentraland NFT marketplace
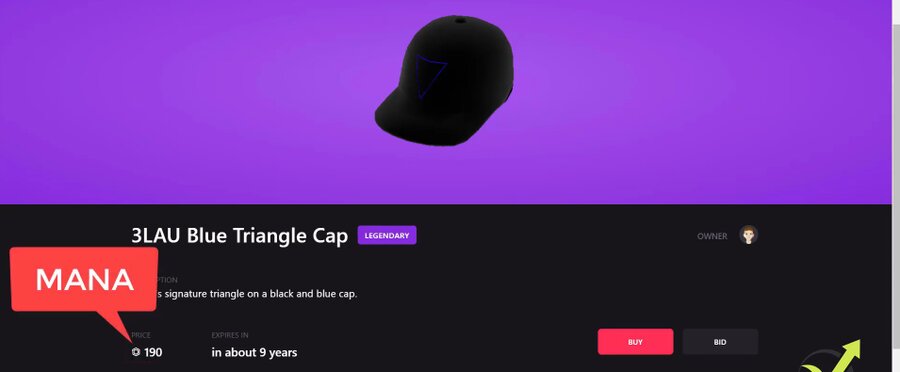
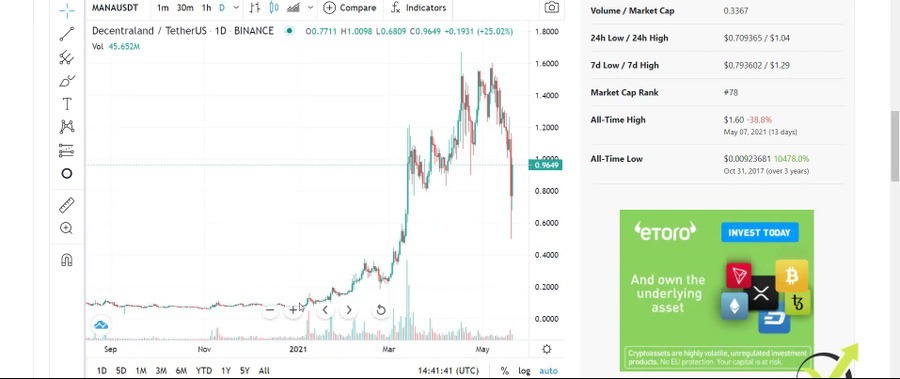
But what I want you to focus on is the price. Let me go through this cap. You can see that the price is 190, but this is MANA.
I pick a cap randomly
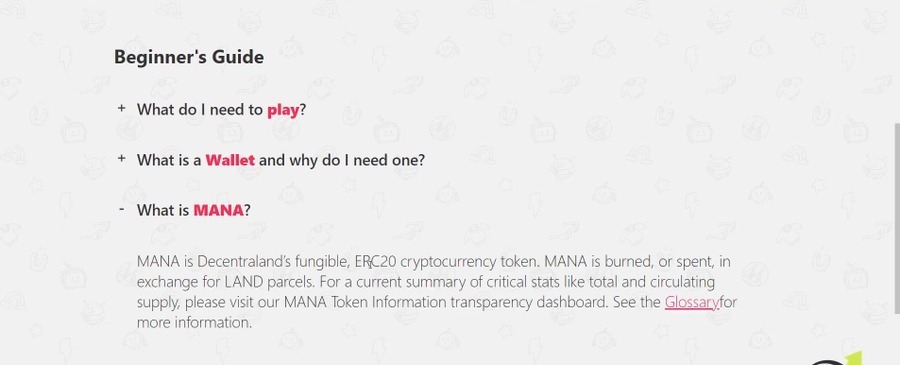
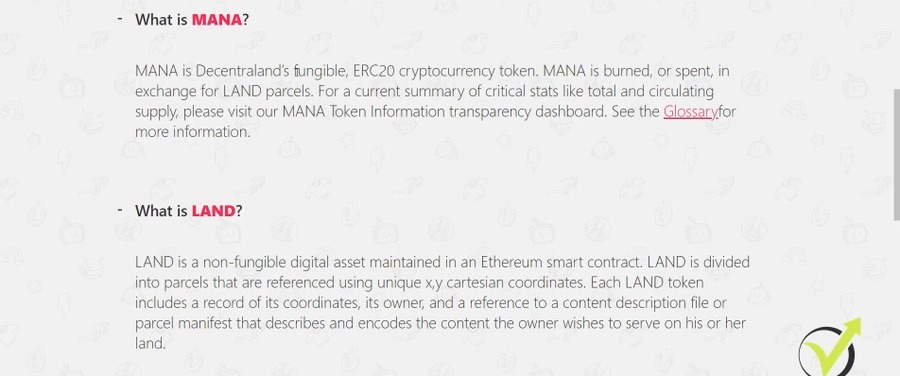
This is the cryptocurrency of Decentraland, it is a fungible token. It is an ERC20 token. Actually, if I go back to Decentraland NFT game page I can see that there is a Beginner’s Guide.
Decentraland crypto game beginners guide
It says ‘What is MANA?’ It is the fungible token, ERC20 cryptocurrency token. And what I want to show you, I will go to coingecko.com and I will search for MANA. CoinGecko is a cryptocurrency website where you can find almost all of the cryptos. And for MANA, it says Decentraland. And if I click on it, I see that at the time I’m writing this article MANA sits at about $1.
Difference between the MANA and the LAND
But what’s interesting is if I go below and you see the chart and I go just to the daily chart, you will see that the MANA value increased significantly starting from 2021. In December, the price of MANA was just 7-8 cents.
Mana value has increased in 2021
So, for example, the cap from the Decentraland NFT game, which is 190 MANA at the moment, back in December was about $15. But by the time I’m writing this lecture, it is about $190.
And if I was buying this cap, let’s say at the end of April or May, I was going to pay about $300. So if you want to use Decentraland, you need MANA because all the assets are selling in this crypro.
Decentraland LAND Explained
On the Decentraland marketplace we have also ‘What is LAND?’ So the LAND is non-fungible. Simply it is an NFT.
And you see here very clearly what is the difference.
The difference between MANA and LAND
The MANA as a cryptocurrency is a fungible token and the LAND is unique and it’s not a fungible token, and it’s maintained in the Ethereum smart contract.
And if I show you a piece of one block, you will see that as of March 2021, on average, 1 parcel of LAND in Decentraland is sold for approximately 6,900 MANA, which is nearly $6,000.
It’s not cheap to live there and the total number of parcels in Decentraland is capped at 90,000. The developers, all own the common places, the plazas, and the roads, and they cannot be bought or sold by users.
How it works
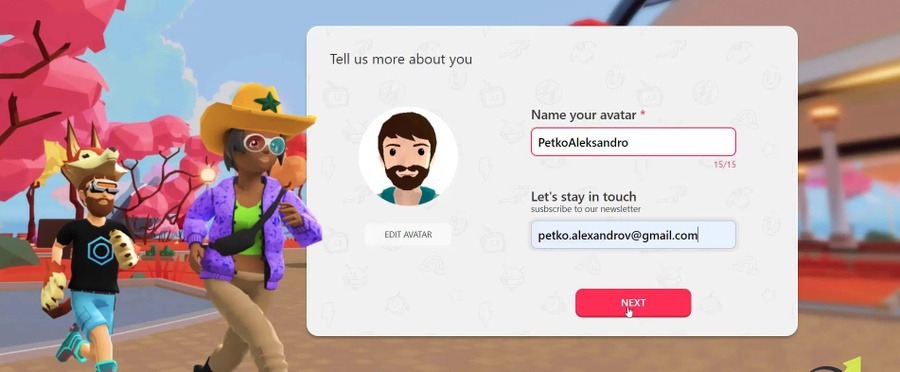
I will go back to the avatar and I will choose just the male. And I will name my avatar. So let me use my name because I don’t want to think of anything different right now. I will enter my email, I will click on Next.
Naming the Decentraland game avatar
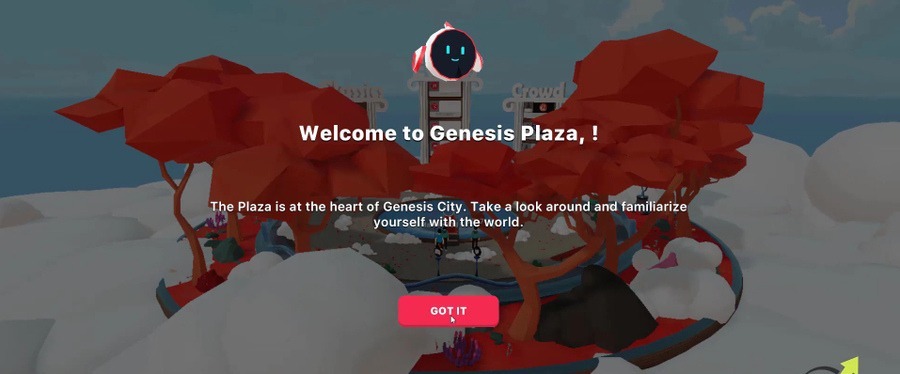
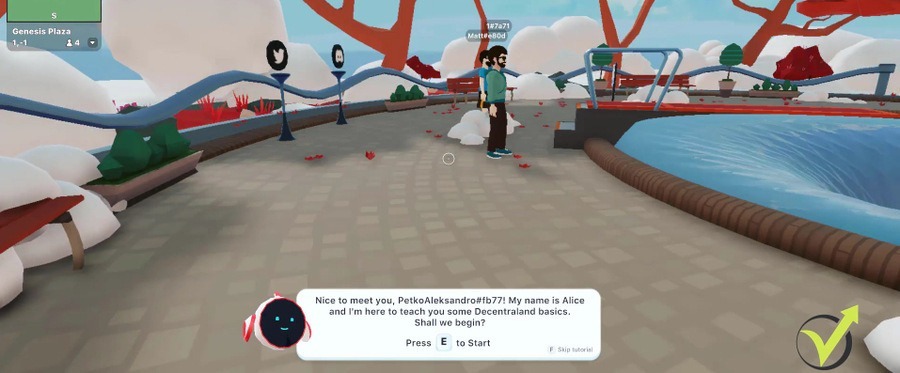
I will agree to all of that, but I will suggest you read the Terms and Conditions. On the next screen I the text ‘Welcome to Genesis Plaza.’ The plaza is at the heart of Genesis city. Take a look around and familiarize yourself with the world.
Genesis Plaza at Decentraland
So this is it. I am now in the virtual world and I’ll be using my mouse to walk around.
And it’s just a game. I’m not really a gamer. Honestly, I haven’t played for years, but I’m in the virtual world right now. I can walk around, probably I can dive into water. I don’t know. There are some other people who just joined I guess, and I can start walking. So I’m not going into more details about it because below you can see that there is a guide and with E, I can start it.
Waling in the Decentraland crypto game world
You will need a powerful computer to access the platform
Something to bear in mind is that the graphics are a little bit hard and if you don’t have a powerful computer, it might slow down.
Actually, I’m on quite a powerful laptop right now creating this lecture. This is because the platform or the graphics of the website are quite heavy and if your computer is slow, it might slow down.
So you can play around in the virtual world. But to summarize it, it is a virtual world where you are actually purchasing items on the Decentraland marketplace. You’re purchasing your clothes, shoes, and you can purchase the real estate. Randomly, I will click on one spot that sells for 15,000 MANA, which is nearly $15,000.
It’s a virtual world and it’s an NFT, which means that it will be recorded on the blockchain. You will have it in your assets. And this is why I connect it to my Metamask account, because all of the assets that I have, they would be in my Metamask and I will be the owner. Of course, after that, you can decide to resell them or to increase your property, whatever your purpose is.
Conclusion
If you’re a gamer and you want to play around, you can just increase your lands and improve your assets and probably make some money out of it. And to summarize, the Decentraland game is an NFT platform, which is simply a virtual world where you buy assets, you buy LAND, but you buy them one more time in MANA, which is a cryptocurrency.
And if you’re interested in it, probably you would like to buy land and wearables, for example, when the MANA is relatively cheap. So you’ll be spending less Ethereum to convert to MANA or equivalently, you will be spending less American dollars for the assets. So since January 2021, the price of MANA increased and it got really expensive honestly to live in this virtual world and to buy stuff and land.
Thank you for reading the lecture. We’ll see you in the next one.
In today’s lecture, I’ll be talking about Celer as one of the recent investments that I have in my crypto portfolio and I will explain exactly why I have bought it and what is the realistic price prediction that I have for the CELR coin.
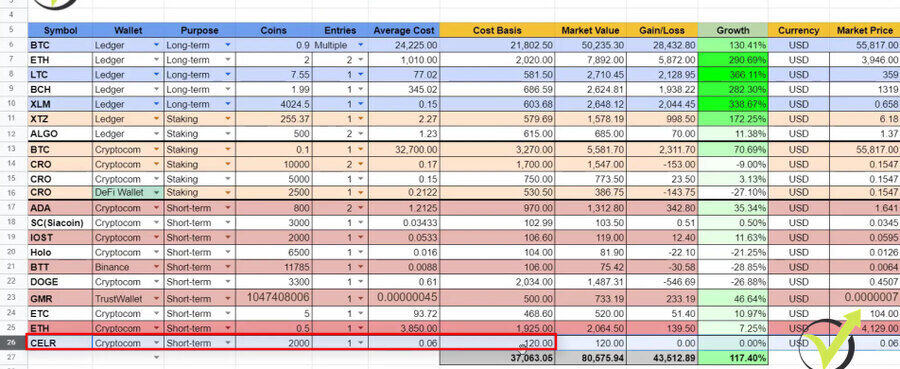
So on my spreadsheet, I have the Celer as the last investment, 2,000 coins at a price of $0.06 and this was an investment of about $120.
My Cryptocurrency spreadsheet
And if you are a beginner to our Academy, on Patreon I share all of my investments. I send buy and sell alerts. So, for example, I have a sell alert for Ethereum where I gained a profit of above 220%. As well, on my Patreon’s page, you can download the spreadsheet and use it for yourself or track all of the investments that I currently have. So this crypto portfolio spreadsheet is available on my Patreon’s page.
Celer Coin Community
So Celer is quite an interesting coin that grabbed my attention because it did a decent retracement after the move in March and April 2021. And a few words for the beginners, if I go a little bit higher on the CoinGecko website where I am doing the analysis you will see that Celer Network has a Twitter and Telegram community.
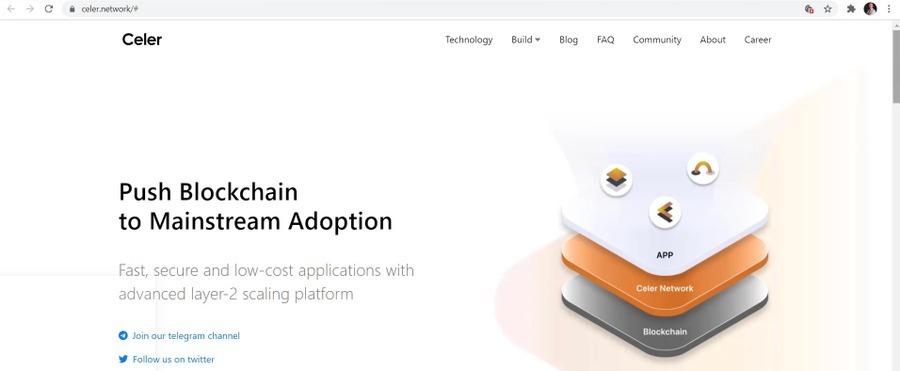
If I click on Twitter, I will see that Celer already has above 50,000 followers which is not bad at all for a coin with a price of $0.05 where it sits at the moment. And if I open their website you will see a well-designed celer.network website where you can read more about the technology, what is it all about?
Celer website
I’m not going into details, at least not in this lecture. What I want to focus on is the Celer price prediction and the levels at which I’m comfortable buying it.
So for every asset when I’m starting to analyze, I look at the community, I look at the website, what’s the idea? Do I like the idea of the coin? There are hundreds and thousands of assets so it’s really hard obviously to analyze and decide which altcoin you want to buy or you want to buy the assets that are already listed on some of the exchanges.
What is the support level?
So Celer is already listed on a couple of exchanges, I have bought it from Crypto.com.
Check out our Brokers & Exchanges section, where you can see the exchanges that we’ve been using that are trusty and I don’t have any issues when I’m withdrawing because I know that many beginners worry about that which is normal.
But I already tested quite many exchanges and I’m always dropping the links to the trusty ones that I’m using.
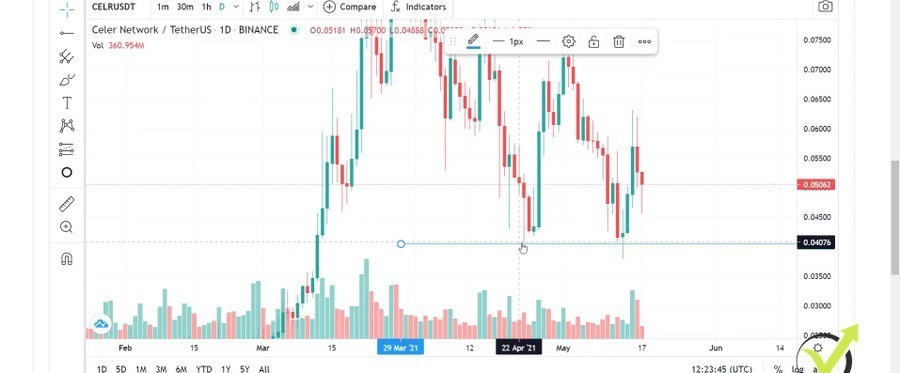
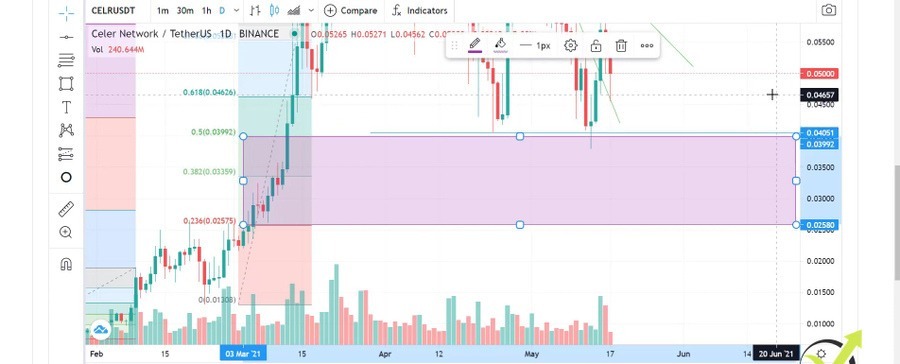
So with the Celer, what’s important to point out for me is that we already have a nice support level at the level of $0.04.
The support level
So this is where the price stopped on the 23rd of April, then it went higher, and then we had another failure. With this, we can say almost a doji daily candlestick on the 13th of May and the price failed to close below the level of $0.04 which makes it unimportant.
And usually, when I notice that there is strong support with some of the coins, I start looking for buying opportunities.
And for beginners, what is the support level? This is a level where the buyers stop the price or in other words, it means that at this level the buyers get stronger than the sellers.
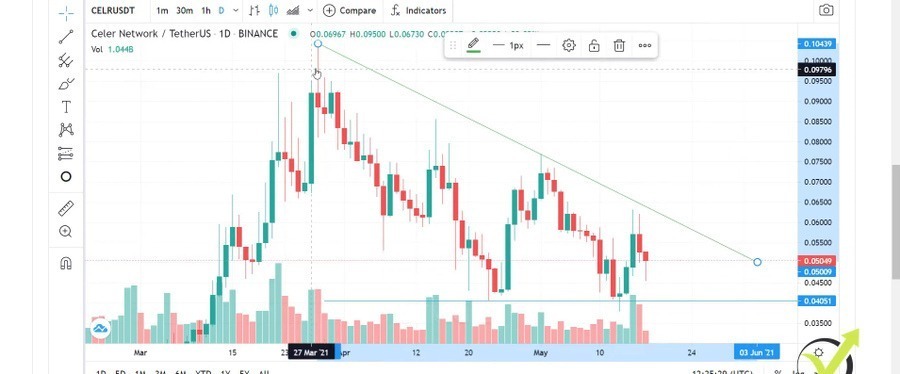
The counter-trend line
Obviously, the sellers are pushing it down, they’re selling, they’re taking profit or swapping to other coins but when the price reached $0.04, the buyers are stronger. And this is where I bought my recent Celer coins and I will explain it super simple. So what I am using are the counter-trend lines. I will draw one counter-trend line over here. Here it is.
The Celer counter-trend line
So I call it a counter-trend line because I draw it against the major trend which is an uptrend if we look at the bigger picture.
We have a very bullish movement and then we have a decent retracement which gives us great levels to buy. Now, I will go down to the hourly chart and I will show exactly what I have done.
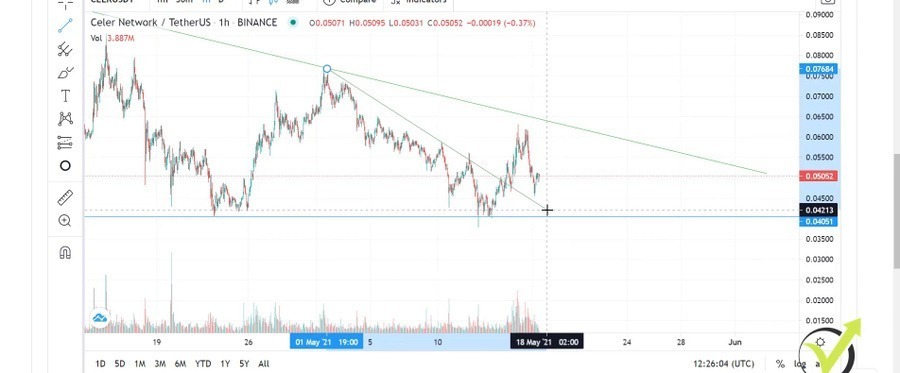
So here is the counter-trend line. I will draw it precisely through these levels and then what I usually do is I draw more aggressive counter-trend line which was right over here.
The more aggressive counter-trend line
Initially, it was here through this top, let me just zoom it. But I didn’t have a failure of the recent low so after that, I moved it over here. I’m looking for the failure of the recent low so you can see that right over here the price failed to take this low and there was a higher low.
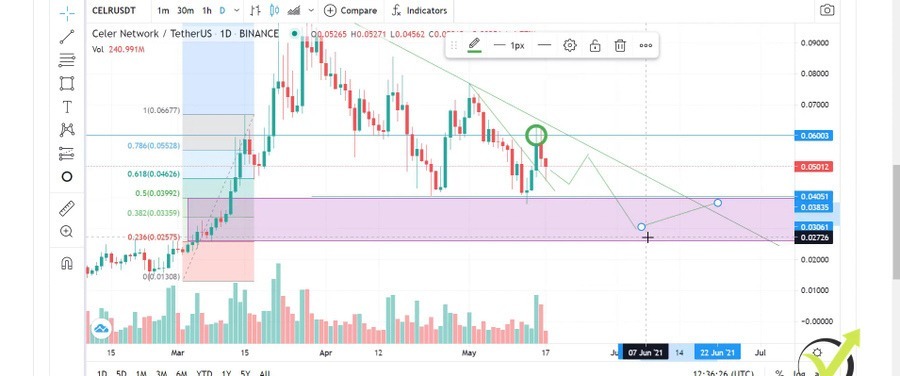
And simply said, we had a new uptrend on the hourly chart and when the price broke the counter-trend line, I was ready to buy. However, I wanted to see first the price breaking the level of $0.05, $0.06 because these tops here are important because it’s another important level for the market. So if I go back to my Patreon’s page you will see that what I said exactly on that date is.
However, I wanted to see a break of the $0.06 level first because it was important to support and the resistance level. So 0.06 is an important level. You see that the price stopped a few times here, it was a resistance here then it was of support a few times, here as well, here, like 5 times is more than enough to consider it as an important level so here it is, 0.06. I will just drop it precisely and you will see where was my entry.
After that, what we had was a few negative tweets from Elon Musk about Bitcoin which forced the whole crypto market to drop and other Celer trades at about $0.05.
As well, I’ve been using the Fibonacci levels. I will go back to the daily chart and you will see one more time why I said that the $0.06 is an important level.
The Fibonacci levels
Here it was a resistance, then it was a support for a few times. This is why I wanted to see a break from that level. But followed by Elon Musk’s negative tweets about Bitcoin forced most of the coins to drop in the next couple of days. So what more I wanted to show you are the Fibonacci levels.
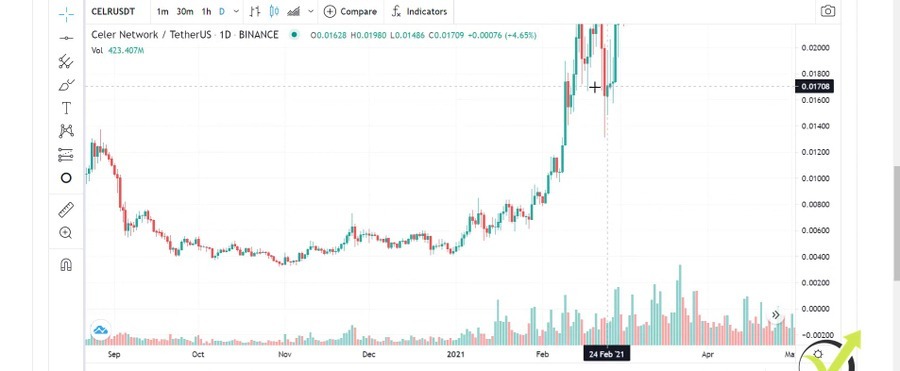
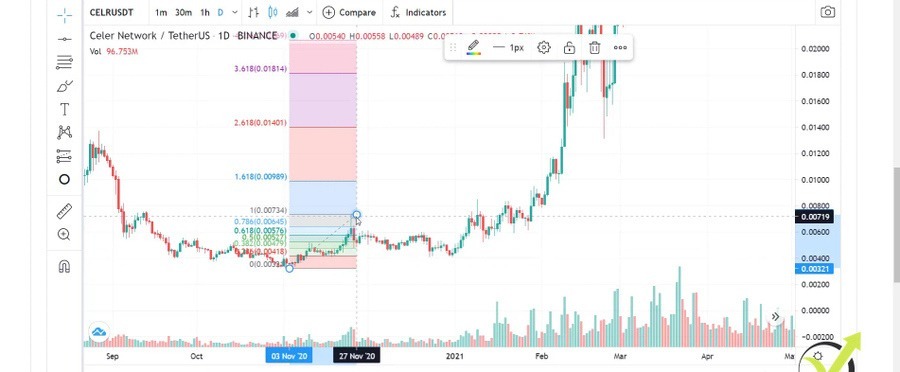
And exactly with the Fibonacci levels, I’ll be showing you what are the realistic price prediction targets that I have and that I’m looking at. So I’ll be going back to the beginning of 2021 and the end of 2020 because right over here in September, we had a very negative move with the Celer, and then the first positive move was this one over here.
The lowest point we consider to be that one over here, you can see the price was at 0.00324 and then we had a positive move, price went sideways, another positive move, and then we had the impulsive moves.
The impulsive moves
So now I’ll be taking the Fibonacci retracements and I will be drawing one Fibonacci with the first positive move.
The Fibonacci
The targets
This is the first positive move. I draw it backward starting from the top to the lowest point and you will see how Fibonacci looks like on Trading View. We have retracement levels and we have targets. And exactly I’ve been using the targets to determine realistic price predictions. So I take another Fibonacci and when the price breaks the second target, I draw another Fibonacci from the next top.
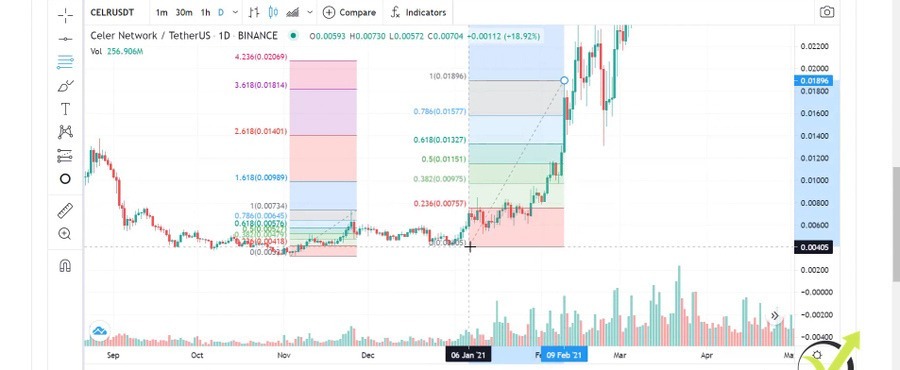
So here, the price broke the Fibonacci, I’m taking the next top and I’m drawing it to the lowest retracement.
The 2nd Fibonacci
This system works really nice so stay with me here, I will explain it in detail and you will see that it’s nothing really hard. And by the end of this lecture, you will know exactly what are the realistic targets for the Celer network and for the coin.
So now I have the new Fibonacci and you see that the price went a little bit higher and did a retracement exactly to the point 61.8 level of the Fib. And then it went higher reaching the second target at this moment. So after it reached, what I will do, I will take another Fibonacci from the next top which is this one over here,
The confirmations
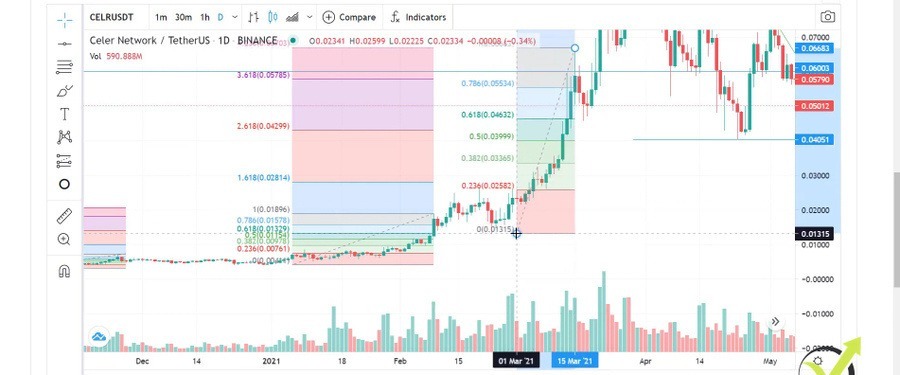
I will draw it precisely to the lowest level, I will have a new Fibonacci, and you see that the target was not reached.
The 3rd Fibonacci
And the target is 0.15, 15 cents. This is the next target I’m looking at based on the moves we had so far from the beginning of 2021. So let me draw it really precisely because it’s important. Every small change reflects the target.
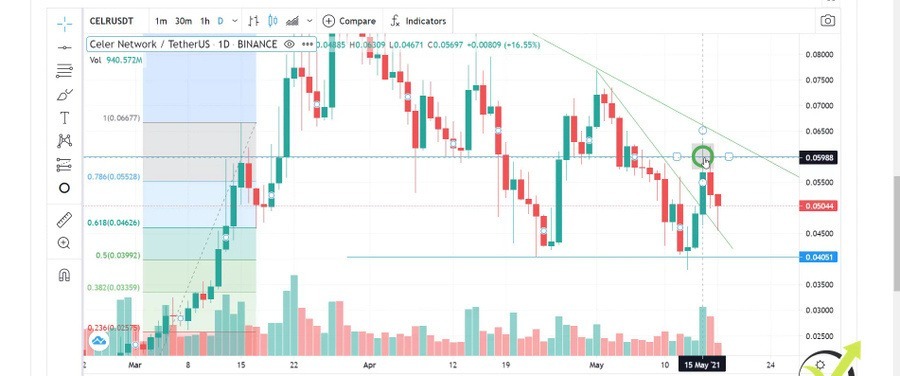
So here is the lowest point of the retracement and then we have the highest point right over here, yes, here it is. Now, what I do is to look at the second target. One more time, it sits at 0.15 or this is 15 cents. After the price reached the target, you can see that it went sideways, a little bit down, and it did a nice retracement to the 0.04.
And you can see that the 50 level of Fibonacci matches with the 0.04. It is 0.03992 but this is super close to the 0.04. And when we have nice retracements to the Fibonacci, this gives me a great opportunity to enter the market and to buy the coin. So here I have a few confirmations. First is the retracement to the 50 level from Fibonacci.
My personal opinion on Elon Musk’s remarks
Second is the support level of 0.04 where the price stopped twice. Third is this reversal pattern that we had from the Candle sticks, almost a doji. And then we had the break of the counter-trend line. So one more time, I waited in this case to see a break of the 0.06 as well and I have bought right over here.
Where I bought
The recent days, Elon Musk keeps tweeting negatively about Bitcoin which reflects the whole Cryptocurrency world but I think this is temporary. I personally don’t feel like selling everything because Elon Musk decided Bitcoin consumes a lot of energy. It’s nearly the same energy it consumed a month or two ago. It’s a super speculative move from Elon Musk to tweet against Bitcoin.
I personally believe he just wants to buy it at a cheaper level so I expect another positive move from the coins. So this is my current setup. This is what I’m looking at and if I draw a box where I feel comfortable buying it, this will be the retracement levels from the Fibonacci.
Where I feel comfortable buying it
I will take a rectangle and I usually use the 50 level, and I usually lock it between the 23.6 level up to the 50 level.
I want to see the price breaking the counter-trend line
So anywhere in this box, I’ll be happy to buy some more of Celers and improve my average price. This is in case the price drops. And you see that the price already has been into that box but one more time, I don’t feel comfortable buying for one reason, I want to see confirmations from a few things as I already explained.
If you are a more aggressive player and you want to buy the dips then you might want to buy every time the price drops into the retracement level or in this box that I formed between 23.6 and the 50 level. And ideally, what I’ll be looking at is discounted trendline, I will just increase it.
If the price does something like that, probably a little bit of a drop and then retesting again this counter-trend line, then dropping more to the zone and anything here that breaks the counter-trend line. This is just a potential setup that would make me happy to buy some more Celers.
The potential setup
So I want to see the price breaking the counter-trend line or eventually something like that which will form a higher low, here it is, and a break.
My current setup
So if I see the price forming a higher low on the daily chart, this will make me happier buying it and as well a break of the counter-trend line in the box would make me feel comfortable adding more Celer coins into my portfolio. This is my first entry so if my second entry is somewhere in the levels of 0.04, I will have an average price of 0.05.
And then if the price reaches my target of 0.15, this will bring me over 200% of a profit with the Celer coin. So this is my current setup, guys. This is what I’m looking at. Of course, if the price now just goes upwards, even better. If it drops, no worries. I’m happy when the price drops lower so I can improve my average price and when the targets are reached, I have more profits compared to if I have put all of the money in the first place.
So usually, I determine an amount that I’m ready to invest. With the Celer in this case, it was $300 but the first time I buy is only with $100 or something around it. Then if the price drops lower, I add to the position, I improve my average price, if the price drops more I will be looking for more buying opportunities and buy some more.
Check out my Patreon’s page
So after that when the price reaches my target, I will have more profits compared to if I have bought for the whole $300 at the beginning. This is my strategy, this is what’s been working for me great since 2020 after the Coronavirus crash. We’ve been having great opportunities on the Cryptocurrency market.
I’ve been sharing many of them on my YouTube channel in my Cryptocurrency Investment Strategy course which you can find in the description below. I’ll be posting as well a 50% discounted coupon. And as well, recently I started my Patreon’s page where I send buy and sell alerts for all the assets that I’ve been purchasing.
And as well, I have shared my Cryptocurrency spreadsheet which is super useful if you are building a portfolio so you can track where you have bought the asset, how many times you have bought it, how many coins you’re holding, in which wallet you’re holding it, what’s the purpose? Is it short-term? Is it long-term?
Please give the video a like if you enjoyed it
And, of course, at the end of the day what matters the most is are you profiting out of it or you’re not profiting out of it. So take it easy, don’t jump with all of your money into one asset. I always suggest the students and my followers to invest in many Crypto coins, not everything into one coin.
Of course, over 70% of my portfolio is in Bitcoin but the rest I split between many coins and I do a detailed analysis daily and I share every time I buy or sell an asset into my Patreon’s page. So check out the links below, make sure to subscribe to the channel so you won’t miss any new price predictions. One more time, for the Celer, a realistic target would be 0.15 or this is 15 cents.
And if you have enjoyed the video, thumbs up, and I will see you guys in another one. Take care, enjoy investing in the Crypto world.
The platform I’ll be going through this tutorial is called Rarible, which is well known to be the NFT platform for digital art. And in this lecture, I will share with you some pros and cons and at the same time, you will learn how to navigate through the platform.
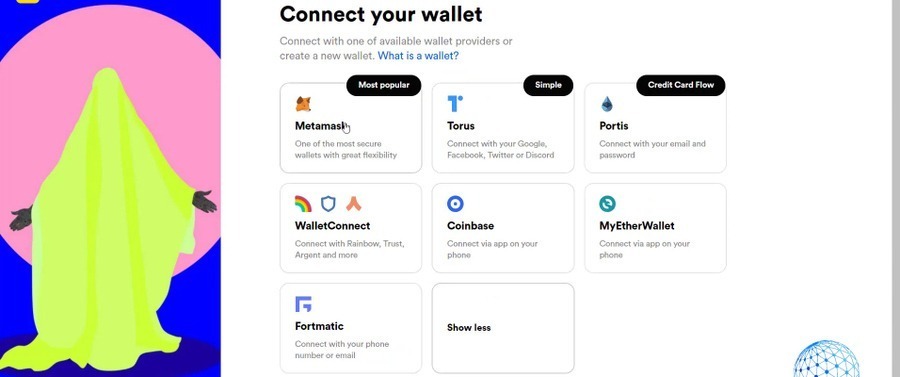
So first things first. I’ll be connecting the wallet and you will see that I have MetaMask, Torus. We have Coinbase as well.
If you click on Show more, you see that we have Fortmatic and a few more.
Connecting the wallet
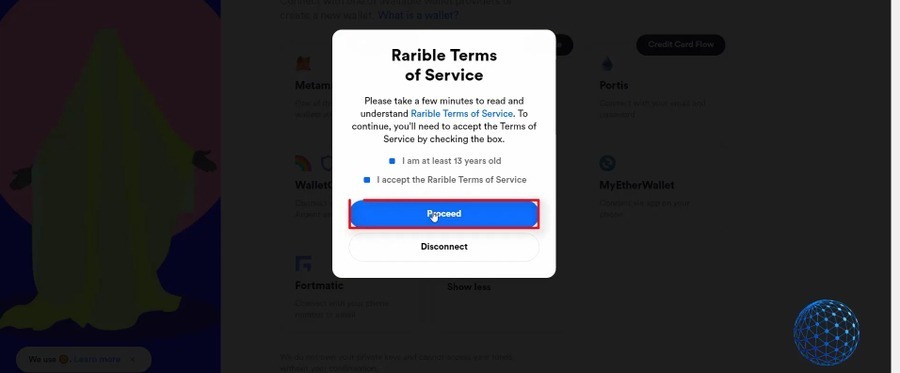
So I’ll be using MetaMask and I will just paste my passwords. I click on Unlock. Here is my account where I have 0.0194 of Ethereum. I click forwards and connect. Then I accept the Rarible Terms of Service and click on Proceed, but I will suggest everyone go through the Terms and Conditions.
Click on Proceed
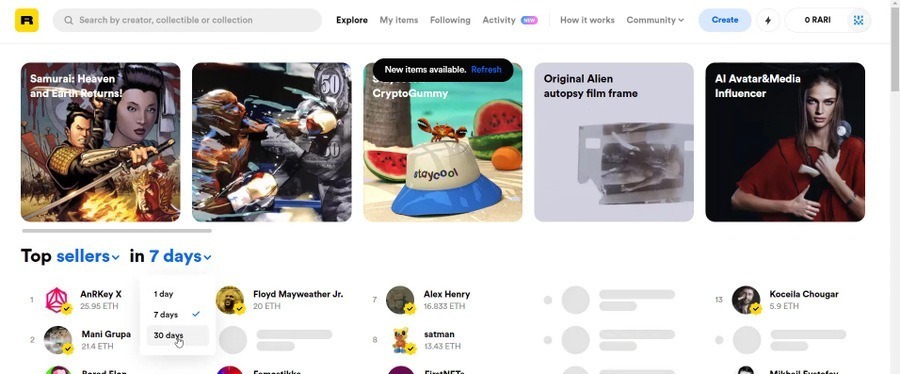
And here I am on the Rarible platform. So the first thing you see at Rarible is that there are some NFT tokens that are new. But what I want you to see from the beginning is that we have top sellers, in 1 day I can switch to 7 days, I can switch to 30 days.
The Rarible NFT platform
So the Metakey seller for the last 30 days sold NFTs that are worth a total of 216 Ethereums.
How Rarilbe NFT platfrom works
And at the current moment, by the time I’m creating this lecture, 1 Ethereum sits at about $2,500. You do the math. Now, in this tutorial, I don’t want to show you how much these guys do from selling NFT tokens at Rarible.
What I want to point out here and what is vital to understand about NFTs is that people are willing to spend money for NFTs, not because of the NFT itself, but for the creator or for the artist.
The same thing with non-digital art, for example, rich people are willing to spend a lot of money on Picasso or da Vinci paintings. Not because the paintings are actually amazing, but because they are made by Picasso. And if they share with each other what they have in their house, they’ll just say, I have a Picasso painting rather than I have the old guitarist or the Weeping Woman, for example.
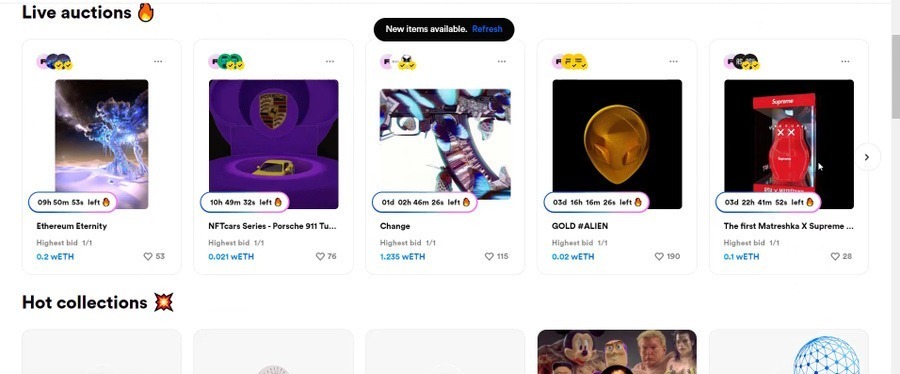
So it’s the very same thing that applies on the NFT market, the people are willing to spend money on NFTs that come from popular sellers. And there is a reason why Rarible has placed the top sellers on the front page. So obviously it is a huge battle for the sellers to be on the first spot so they can easily sell their arts. If I scroll below, you will see some live auctions below.
The live auctions and the hot collections
NFT Photography Tokens
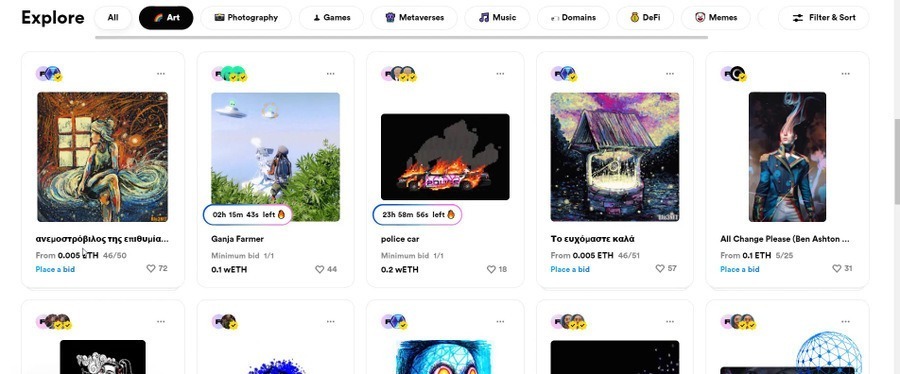
We have some hot collections. Explore, we can go through Art and you’ll see that some of the art starts from the minimum of 0.005, others 0.1, 0.2.
The Explore section
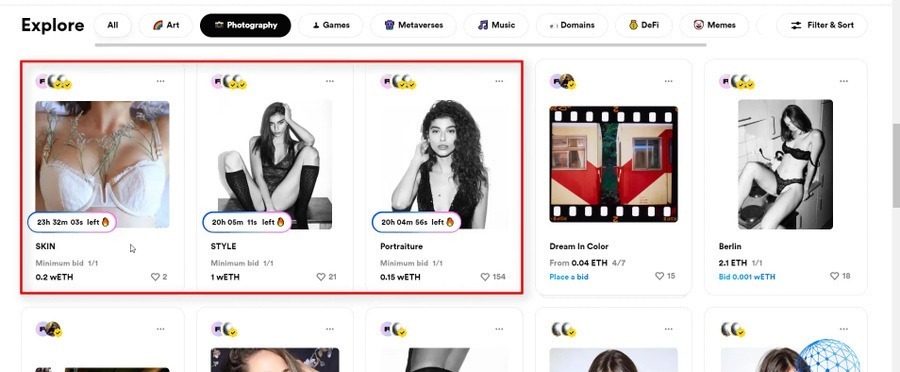
And you can notice what a variety of NFTs are out there. Then we have photography, and with the photography, you can see that the style is a little bit different, I can say it that way.
NFT Photography at Rarible
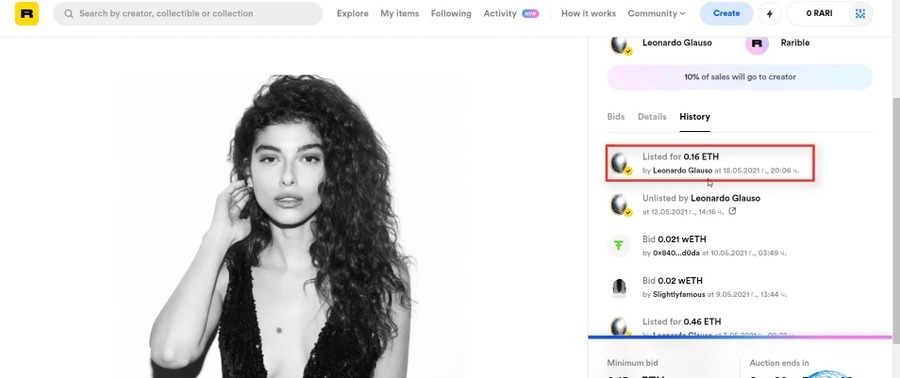
But for example, if you look at the first 3, you will see that the first one has 2 likes, the second one has 21 likes, and the third one has 154 likes. And if I click on it, you will see that the minimum bid is 0.15 of Ethereum and if I click on Details, you will see who is the owner. And if I click on History, you will see something interesting. It was listed for 1 Ethereum on the 1st of May.
Then the owner reduced the price to 0.6, then to 0.5, 0.46. Then there was a bid of 0.02 and now it’s listed again for 0.16.
The photograph history
So basically what happened? The creator probably realized that asking 1 Ethereum for this NFT is too much. So he has reduced the price a lot. In the NFT Masterclass course, I talk about how you can find valuable NFTs. But with simple words, we need to see an NFT that increases in value.
That there is interest in that NFT and people are willing to spend more money on it. Rather than seeing something like that, where the price actually decreases. Obviously, only by looking at that, you realize that even if you buy these NFTs for 0.16 Ethereums, probably you won’t be able to sell it for 1 Ethereum or even for half of the Ethereum because the creator failed to sell it at this price.
NFT Domains Tokens at Rarible
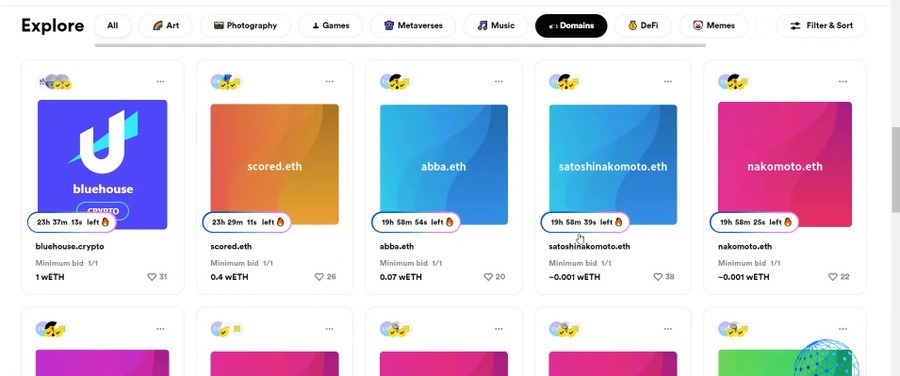
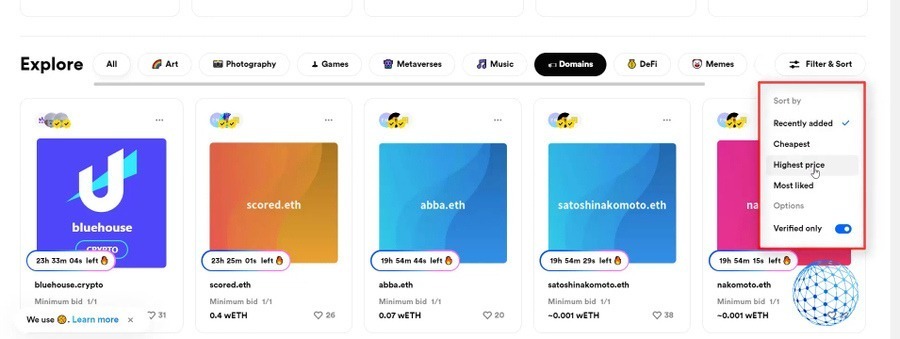
Now, going back to the Rarible front page, we see that there are many different NFT tokens. We have Games, Metaverses, Music. But what I want you to have a look at is Domains.
Domains
This is something attractive and I want to give you a few tips about Domains because they are very important for businesses. And now we have Domains that end on .eth or .crypto, and probably with time, we will see more websites and the Crypto space with .eth or .crypto.
However, what is very important here is that if you are looking to buy a Domain name, you should be looking for a shorter name. And of course, the shorter it is or the clearer the name is, it will cost more money. For example, very randomly here, you see that ‘nftpanda’ starts from 1 Ethereum and ‘rockandcoin’ starts from 0.1.
So ‘nftpanda’ has the name and has the NFT keyword inside, obviously, it is more suitable for a NFT platform or for a platform that is related to NFTs compared to ‘rockandcoin’. And if I click on load more, you will see many others. For example, cardano.eth, you see that it starts from nearly 400 Ethereums. Probably, this will be a valuable Domain name one day for the Cardano community.
And to see that on the current page where I am random, it has probably the highest price or I have missed seeing some other. So for the Domain names, it’s important to have a keyword, a popular one. It’s important for the name to be short and clear. If it is one word that is even better, if it’s longer, probably it won’t increase a lot in value.
Filter & Sort NFT tokens
And on the right side, we have the filter and you can sort them by the cheapest or the highest price, for example.
The filter
So you can see that current moment, the 0xb1.eth has a starting price of 100,000 Ethereums. And if I click on it and click on bids, I doubt that there will be any bids above that price. So what we have on the top is the Explorer section.
The summary
Then we have My Items. So if you have bought them then you will see them inside your wallet. Or if I have connected it to my MetaMask, they will be actually stored into my MetaMask. Then I have Following, so for example, if I go back and I click on any of the sellers very randomly, let me click on the Metakey, which is the first one. I can click on Follow and then I have to sign that I want to follow.
And then on following you will see that if I refresh, I will have the items from that creator. So this way you can follow the new NFTs from the creators you are following. Then we have the Activity where you will see simply the history of everything you have done. Then we have the section on how it works, which is a kind of FAQ section. Here, you will find answers to probably the most frequently asked questions. That’s the idea.
And then we have the Community if you want to check it out. So to summarize, Rarible is a platform where you can buy digital art as NFT tokens. And the most important thing here is that you can create your own NFTs.
In the NFT Masterclass course, I talk about how to create NFTs on Rarible and what are the costs. You can preview the course and enroll here. Because there are costs, I will compare it with OpenSea and share with you which one is better.
And, on the other hand, you can buy NFTs from different sellers. Usually, the people are willing to spend money on items that are created by popular people, influencers, someone they like to follow, and not that much for the NFT itself.
So if you have someone who you are following, you are a big fan of an artist and they are on Rarible, then you can just start following them and buy some of their NFT whenever they are launched on the platform.
Let me know if you have any questions about the NFT platform in the comments below. Thanks for reading and see you in another lecture.
Hello, everyone, I am on the CryptoKitties website, which is a relatively popular platform in the Crypto and NFT world. And what’s special about this platform is that you can buy Kitties as NFTs, you can sell them, you can breed as well. And I will go through all of that in this lecture. And, of course, if you have any questions, just let me know in the comments below.
So the first thing I’ll be doing is to click on the Start button and I will create an account with MetaMask.
Click on Start
I already have an account so I will put my email and I will put a nickname, for example, I will just use my name which is absolutely fine for me. I will tap on Continue. And almost there, as a final step, your wallet will ask you to digitally sign in to link it with CryptoKitties NFT platform, click the button to proceed, sign in.
Click Sign in
So here comes my MetaMask account. All I need to do is just sign in and here we go.
Click on Signature
That’s all I had to do. I am now connected with my MetaMask account so I have some Ethereum to use.
We can create new Kitties
And then what’s nice to see is that there are plenty of classes and guides. So, for example, if I start the Kitten class which is the first one,
I click on Start Kitten Class
you will see Kitten Class: Breeding.
Kitten Class: Breeding
So what’s the idea here? You can buy Kitties from the marketplace and just keep them as NFTs or we sell them. But with the CryptoKitties platform, you can do much more. You can play with them, you can breed them. And the first class is about breeding.
So it’s a demonstrational class and I would suggest you go over it if you’re interested, just to play around. And you will see that they give you 2 kitties. And if I click on Next, you can read the tips below. Each Kittie is unique and they give you the option to use the buttons to learn how to use the platform. So, for example, if I want to breed them, I will decide which Kitty is the lady, which, for example, I will tap on the pink one.
Then I will need to select the male one so I click on the next one and then, OK, give them some privacy.
Choose the male and the female kitties then give them some privacy to breed
And this is how the kitties will breed and they will do the magic, and you will see a new kitty born.
You will see a new kitty born
So this way, basically, you can create new kitties and after that, you can sell them or you can use them as a male on the platform.
Be sure to go through the CryptoKitties NFT guides
So others might use your kitty to breed with their female kitties and so on. It’s very entertaining. And if I tap on the egg, the kitty is born. It’s a new, unique, CryptoKitties NFT kitty and then you can sell it or you can store it or one more time, you can use it for breeding as well. So there are plenty of tips as well on the CryptoKitties website.
For example, it is recommended that you breed kitties from the same generation. So you see that these 2 that are examples here are from generation 2. And, of course, the more unique the kitties, that is better. I will go back to the main website and I will show you what’s more here.
So one more time, make sure to go through the guides. They will give you a better idea and understanding of how the CryptoKitties NFT platform works, how you can sell kitties, or breeding them. There are plenty of tips as well on how the cat features work, what are the Cattributes.
For example, you can see what a kitty we have here. Cattributes could be the eyes, the mouth, or anything around it. Then we have Cooldown Speed.
The CryptoKitties are a fun way to introduce children to the NFT world
So every time the kitties breed, they have some cool-down parameter. So, for example, it could be slow. And you see how much time it takes. Basically, this is how much time it takes from one breeding to the next one. So you can use the kitty again to produce a new kitty. This is about breeding, very entertaining especially if you have a daughter. This is how actually I got into the CryptoKitties website.
I played together with my daughter because she likes stuff like that and I wanted to teach her something that is connected to crypto, but at the same time will be interesting for her. Obviously, if I show her trading patterns and charts and my crypto trading or investing, it wouldn’t be interesting for her.
But when I showed her the CryptoKitties NFT platform, she got very entertained and she already has her own account where I’m sending some Ethereum and she is buying some kitties, selling them. I don’t know how many kitties actually she has right now. And in the same time, this is the future. Or we can say already it’s the present because there are thousands of people playing on the CryptoKitties website.
The gas fees
And something very important, every time we do a transaction, we buy a CryptoKittie or we breed kitties, there are gas fees. Pay attention to that because this is on the Ethereum blockchain and all the transactions are stored on the blockchain and we pay a gas fee.
So basically, for everything you need Ethereum.
The gas fees
And if I go again to the CryptoKitties main website, I will go back just to the main page, you will see that the marketplace is huge. It’s enormous. If I go to the catalog, you will see that we have the Cattributes which I already mentioned, we have the Fancy Cats, Exclusive Cats, and by the name, you can understand that this will be a more expensive cat.
The catalog
So the more exclusive the cat is, obviously, the more money it will cost. You can see how different these cats are. For example, I will click on that one that looks like coming from Hawaii. So this is the Papacatuanuku and you see the number.
An example of an exclusive cat
So this is a cat with the number 1,500,000. And usually, kitties with such a unique number, or we can say it’s a milestone number, cost a lot of money.
The catalogue
And the price is over 1,000 Ethereums. And by the time I’m creating this lecture, Ethereum sits nearly to $3,000. So, yes, that’s a lot of money, guys. And below you can see the birthday, March 31st, 2019. And we have some special features, as well, we have who the parents are. And I can click on the mother and I can see more details about the mother, which cost 0.5 of Ethereum, which is about $1,451 at the current moment.
And you can see what are her Cattributes and which are her parents, the children. So I can go now to her father or the grandfather of the initial kittie that I showed you, and right here you can see who is the owner as well. And below, we will see all the children. So you see how many children this kittie has, like many.
So in the catalog, you can go through the different kitties. You can go through some special editions as well. And one more time, the more unique the kitty is or the earlier generation it is, or if it has a unique number like a roundish number, it will cost a lot of money. But on the other hand, there are some kitties that are relatively cheap.
You can buy the cheap NFTs and grow their price
For example, if I click on Search and tap on For Sale, I will see all the kitties for sale. And you see that the starting point is 0.001 and they are sought by price. And if I click on the first one, you will see all the info about that kittie, it’s called Honey B.
I click on For SaleI click on the first kitty
It’s 15 generation, it has 7 likes. There are Cattributes, the birthday of the kittie, there are the parents and the children.
And I just noticed that the buy button is inactive. It says, ‘Auction Issue. Please find a new kittie on the market.‘ So currently I cannot buy that kitty for some reason. But what I wanted to show you and to conclude in the lecture is that even if you go through the expensive ones that sell for nearly a million dollars or even more, for example, if I click on another one, I see that the kittie sells for over 1,000 Ethereums, which is over a million dollars.
So the NFTs are not actually the market where you can get rich in a few days and you can buy the super cheap NFTs and then just change the price to thousands of Ethereums.
There are people doing it for sure. So there are people that are buying cheap kitties. They just change some key Cattributes and so on and they increase the price. But that’s OK.
Nothing is guaranteed in the NFT world
It’s a free market and you can set any price of the kitties that you own, but make sure to research very well the kitties if you are planning to spend more money. And what I wanted to say is that even if you choose the very good Kitty, and this applies actually for the whole NFT world, even if you spend a lot of money on an NFT, there is no guarantee that after that you will be able to sell it for more money and make some profit out of it.
So as I said, personally, I’ve been playing with the CryptoKitties NFT platform for some time. My daughter enjoys it. So if you have a daughter, it might be a platform where she could play around if you have some extra Ethereums to spend, of course. And, of course, if the kitties are not their thing, you can read the other lectures.
Thank you, guys, for reading, and I will see you in the next lecture.
IOST, this is the coin that I’ll be looking at today and I will share with you what is my realistic price prediction and what was my investment with the IOST. And as well, what are the levels that I’m looking to buy some more and the targets where I’ll be happy to sell it.
IOST price prediction
In today’s lecture, I’ll be focusing on IOST as one of the cheap cryptocurrencies that I have added recently to my cryptocurrency portfolio. So if I go to CoinGecko, one of the websites I’ve been using to analyze and choose new cryptocurrencies to invest in and as well they have the TradingView option which enables me to do an accurate price action analysis.
CoinGecko has TradingView option
And I’ve been sharing many lectures on how I look at the charts, how I draw trendlines, counter-trendlines, support and resistance levels, Fibonaccis.
I will go through all of that in this lecture and at the end, I will share with you what is my realistic price prediction for the IOST and I will be super happy to hear your thoughts in the comments below.
IOST Community
So before I purchase a cheap cryptocurrency as IOST, I look at a couple of things. First of all, I look at the community. So IOST has a decent community on Reddit as well on Twitter, Facebook, and Telegram.
But, for example, on Reddit, they have over 50,000 followers. And on Twitter, they have nearly 250,000 followers by the time I’m creating this lecture. And if I go to the official website at iost.io, you will see that it’s really a professional website that says, “Unleashing the power of blockchain.”
IOST website
The thing I liked about the IOST is that it is a next-generation crypto algorithm that is based on Proof of Believability.
Impulsive move
And I’m not going into details about the IOST, you can go around the website or you can go around the social network they already have and learn more about it. What I want to focus on is the IOST price prediction based on what we have seen since the beginning of 2021. This is when I have noticed IOST after this impulsive breaks that it did together with many other small coins. But we can see that the first impulsive move was this one over here, right at the beginning of January 2021.
The first impulsive move
So what I usually do to analyze the cryptocurrencies and see where they might reach, I go to one indicator called Fibonacci. I have shown how to draw it in many of my price prediction lectures. I will do it briefly in this lecture as well so if you are new you will learn how to use Fibonacci. At Trading Academy we aim to educate the people, not that much to speculate on the market and make profits from our lectures but we aim at pure education.
Retracement levels
So what I do, I draw a Fibonacci starting from the first impulsive move which was this one over here. I will take the top and I will draw Fibonacci to the lowest point.
I draw the Fibonacci
So this was the first impulsive move if you look at the daily chart starting at the beginning of 2021. And then what you see is that we have some levels with Fibonacci, if you are a beginner you will see that there are retracement levels.
So this is the move, automatically it displays 5 levels and these are retracement levels. And you can see that after that the price did a retracement exactly to the 0.382 level which I use the most. So this way you can buy the dip after an impulsive move. What’s more with the Fibonacci is that we have 4 targets on the top and I usually use the second one which sits at 2.618, in this case, it is at 2 cents and 78.
And after the price reaches the level, what I do is I take another Fibonacci and I draw it down to the lowest retracement which in this case was this one over here.
The 2nd Fibonacci
And then again I will have new retracement levels with new targets. And in this case, the price reached perfectly the second target.
The second target
And as I have mentioned in many of my lectures, I use the most the second target because with my experience I noticed that it is just super easy for the price to reach and this is how I usually take profits and then I’m looking for the retracements to buy the dips.
In this case, the IOST price reached this level, the second target of the Fibonacci and I take a new Fib and I draw it to the lowest point, which is this one over here, which is the bottom of this candlestick.
The 3rd Fibonacci
And then what I have is new retracement levels with new targets. And the new targets that I have. But let me just draw it precisely so I will give you an exact value for the new targets and that would be my IOST price prediction. And I say always this is our realistic price predictions, I don’t want to say in my lectures that this coin will reach $10 or $50 or $100 and it will be another clickbait lecture rather than give you a realistic idea of where the price can reach in the short term or eventually in the next months.
Depends on where the Bitcoin, of course, will go after some negative tweets from Elon Musk that forced many investors to sell their cryptocurrencies. However, I didn’t do that. I stick to my technical analysis and I’m not driven by emotions and by tweets that are super speculative. So my new targets with the IOST is $0.1982 or we can say $0.2 or this is 20 cents.
When ot buy IOST
So my next target is the 20 cents right over here and you can see where the third and the fourth target reaches to 30 cents.
But one more time, I prefer to use the second target and then when the price does another move, I usually do another Fibonacci from the new top.
Let’s say it will be right here and then I’m looking for the new retracement levels, I’m buying the dip and I’m looking for the new tops.
But this was a hypothetic Fibonacci that I would be looking at. Now I’m looking at the current Fibonacci which was formed based on the moves that we already had. And you can see on my cryptocurrency portfolio spreadsheet that I have bought the IOST at $0.0533.
My Cryptocurrency spreadsheet
So on my spreadsheet that I share on my Patreon’s page, this is where as well I share my cryptocurrency investments, I give crypto buy and sell alerts. So you’ll see by the time if you are happy with my signals or not. And if I focus on the IOST investment, I have bought 2,000 small $100 investment.
Counter-trendlines
And my average price was at $0.0533 and I remember very clearly when I have bought it, it was right on the 26th of April. Let me confirm it. So go back to Patreon and yes, on the 26th of April I said that I have bought the IOST. And it was on this impulsive move over here. You can see that we had these 2 doji formations, and I will just go down to the hourly chart so I can see in details what happened in there.
The 2 doji formations
Usually, I use the counter-trendlines. Let me fix the Fibonacci exactly on the top, so usually, I use counter-trendlines and more aggressive counter-trendlines for the IOST future price prediction. So here it is and then we had another one right over here.
The counter-trend lines
This is what I have used and usually, I’m looking for the break of the counter-trendline and I always want to see a break of the recent high.
So after the IOST price broke that high which is at $0.0533 and as I said my average price was at $0.0533, you can see it matches perfectly. This is when I enter into the trade. So right here I had three confirmations. I had these doji formations on the daily chart, let me find it quickly. So right over here we had that doji and then another negative one and then another doji.
Doji formations
So basically, 2 doji formations are quite significant and usually, they show a reversal. So the price drops and they show that there might be a reversal.
Then I went down to the hourly chart and I had my counter-trendline coming from the top and for the counter-trendlines, I explained the system in detail in my Cryptocurrency Investment Strategy course.
And then I was looking for this top to be broken because when the price broke it we had a new uptrend on the hourly chart. Because if you know what the uptrend is, its definition is a series of higher highs and higher lows.
So to see a new uptrend, we had to see a break of this level which is exactly at $0.0530 and I have bought it somewhere over here. After that, what happened is the price went a little bit higher it reached to $0.0764 and then it went downwards, it’s just below my price. Now, if I increase the counter-trendlines you will see that now I have the opportunity to draw another counter-trendline starting from that top and going through the recent highs on hourly chart.
New opportunity
So if the price breaks, I might add some more to my portfolio as well what I’m using are the retracement levels from the Fibonacci. So my last Fibonacci right over here as I said shows me the levels at which I’d be happy to buy. Usually, I draw a rectangle that is locked between the $0.50 and the $0.236.
The zone at which I’m comfortable buying IOST
So these 2 levels usually form a zone at which I’m comfortable buying it. This Fibonacci, one more time for the beginners, it came after the impulsive move.
And after that, these levels are zones at which I am comfortable buying it so you see that the price retraced to that zone exactly. If I increase it, you will see that I have bought within the box and now gained the prices within the box. So usually, when the price goes above I’m not buying anything else. I don’t want to add to the position when I’m on profit.
I would only add to the position if I have the confirmations, if I have some reversal patterns, if I have a break from the counter-trendline and if the price is in this box, which one more time comes from the retracement levels of the Fibonacci. Hope that’s not too complicated.
If you’re keen to learn more about price action trading go ahead and check out the Cryptocurrency Investment Strategy course that I’ve mentioned above. Or just follow along our videos on YouTube, make sure to subscribe to the channel. And I often explain the system in the price prediction lectures for the different assets that I have in my cryptocurrency portfolio.
Counter-trendline break
And right now I have this counter-trendline, I will just draw it precisely, here it is.
The counter-trendline for IOST
Why call it counter-trendline? Because it’s against the major trend which is still upwards and if the price breaks the counter-trendline within the box then I’m happy buying it. So ideally, I want to see the price going a little bit lower, then what I’m looking at is to form a higher low, right this way. And then I want to see the break.
So first, I will zoom it more. First, I want to see a higher low than the previous one. Just like what happened in April 2021.
You see that there was a higher low than that one. I’m in the box and I have the break of the counter-trendline. So right here I want to see as well a break of the counter-trendline in the box with a higher low than the previous one. Or if it happens in the next hours, it might look like that. I have already a low and if the price forms a new higher low than that one and it breaks the counter-trendline, I’ll be happy buying somewhere in this level.
And if I have a higher high than that one, so at the levels of $0.05, I’ll be happy adding some more IOST coins into my portfolio.
Look for multiple confirmations
So this is what I’m usually looking at, I’m looking for confirmations from a few things, not just one indicator or one line or one moving average. Depends what you’re using. If you are using a couple of things make sure they confirm each other before you are investing.
And of course, if the price drops lower then I’ll need to be patient and I’ll be looking for new buying opportunities at the lower level so I can improve my average price. But for the moment, until we are above that level of $0.0420, we are still in an uptrend. Now, if I switch to daily chart, you will see that if the price breaks this level and it goes below, we will be in a downtrend.
Just like what the Bitcoin is at the moment, it’s already in a downtrend after the recent negative tweets that we had from Elon Musk.
But for the IOST, if the price remains above that level over here, then we are still an uptrend and I’m looking to buy some more for my portfolio. If the price drops lower then I’ll just pause it, I will look for a new uptrend to be formed on a daily chart and then I’ll add to my portfolio.
Strategy
And one more time, the target or the price prediction that I have where I’ll be happy selling the IOST tokens is at $0.20. This is where I’ll be happy selling it and if the price does something like that, reaches the second level and then I’ll be looking for the new retracement, the new drops, I will have a new Fibonacci and I’ll be buying it cheap.
So this is my strategy. I always sell the new record highs with the Fibonacci targets and I’m looking for the retracements to buy the dips. And this is how I succeeded to achieve some great profits in 2020 and in 2021.
And one more time, in my portfolio spreadsheet you can find only the assets that I’m currently holding. So many of those I have sold and if you’ve been following me on Patreon, you know what exactly I have done. I’m super honest with my investments, I am very happy when my followers are making profits as well. I will do my best to keep it up.
So if you want to follow along, make sure to check out my Patreon’s page or subscribe to our YouTube channel so you’ll know what exactly are the levels I’m looking at and what are the realistic price predictions for the different assets. I’ll be happy to hear your thoughts in the comments below about the IOST price prediction in 2021, 2023, or even 2025, and as well what are the levels where you are comfortable buying it.
I will see you guys in the next lecture. Take care and enjoy investing on the cryptocurrency market.