Blog

  • Beginners Guide to MetaTrader 4 Indicators

    Beginners Guide to MetaTrader 4 Indicators

    Most people jump into MetaTrader 4 trading with the idea of using indicators as a primary tool but there are some concerns when using indicators, so stay with me and I will show you what I mean. Actually, the indicators on the different platforms are very similar, so no matter if you use MetaTrader 4 or another platform, you will encounter the same issues when using indicators over the charts. Later in this lecture, I will show you how to install indicators on the MT4 chart, and by the end of the lecture, you will have a better understanding of the indicators in MetaTrader 4.

    Why use indicators in MetaTrader 4

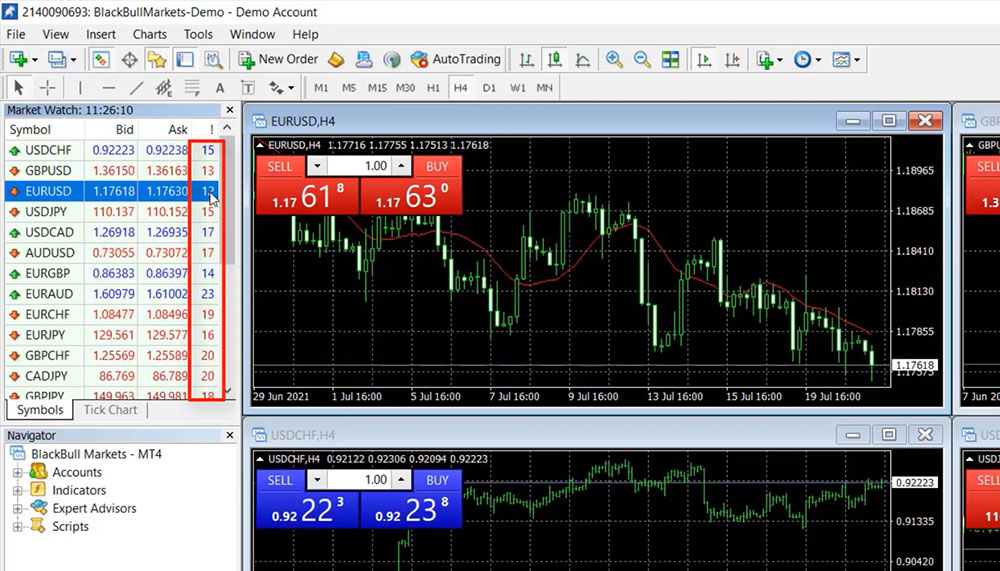
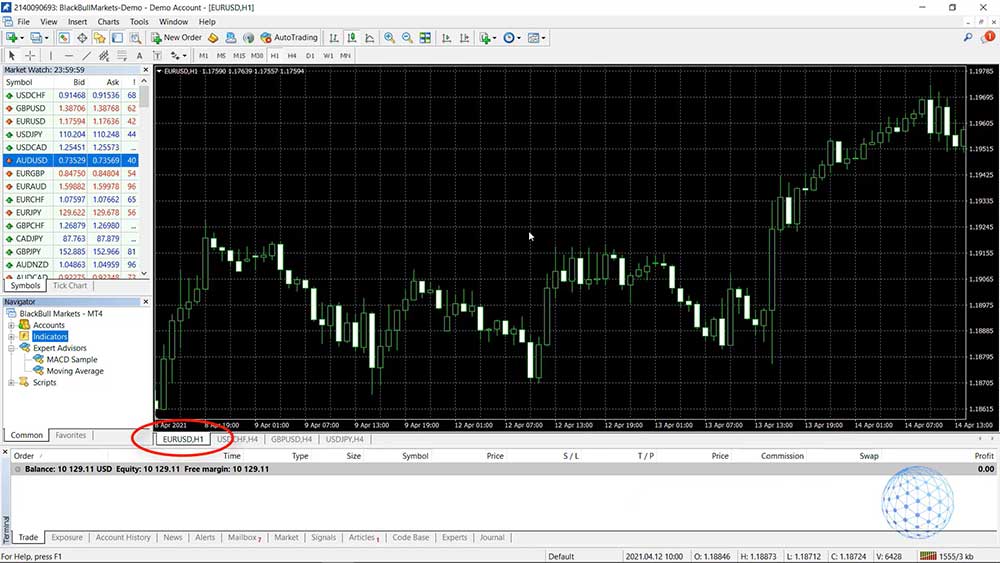
    For the purpose of this lecture, I have selected to use BlackBull Markets which is a trusted broker from our regulated brokers that we use in the Academy. You can check them out on our website if you have no idea which broker to use, so this will be useful for you if you have a hard time finding a broker.

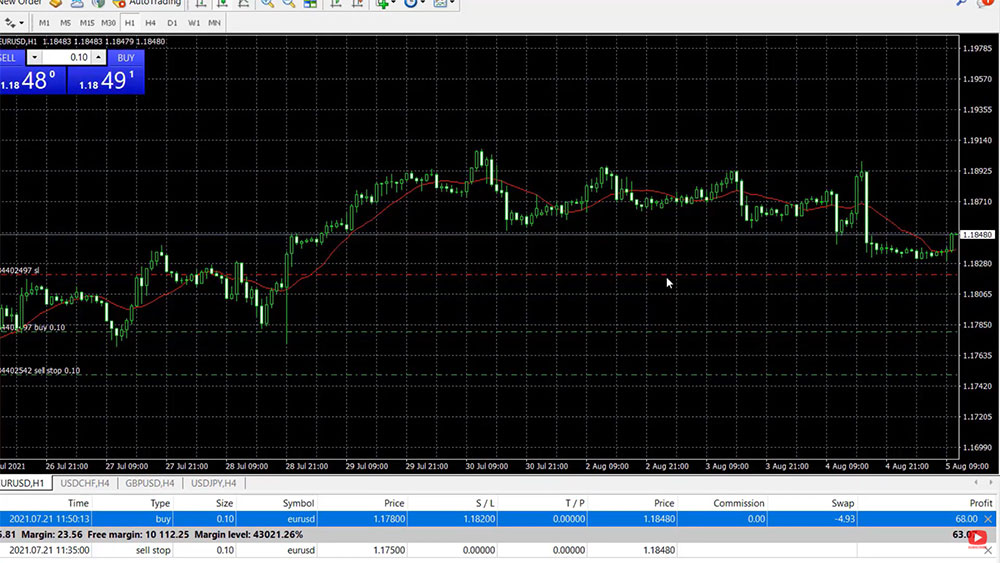
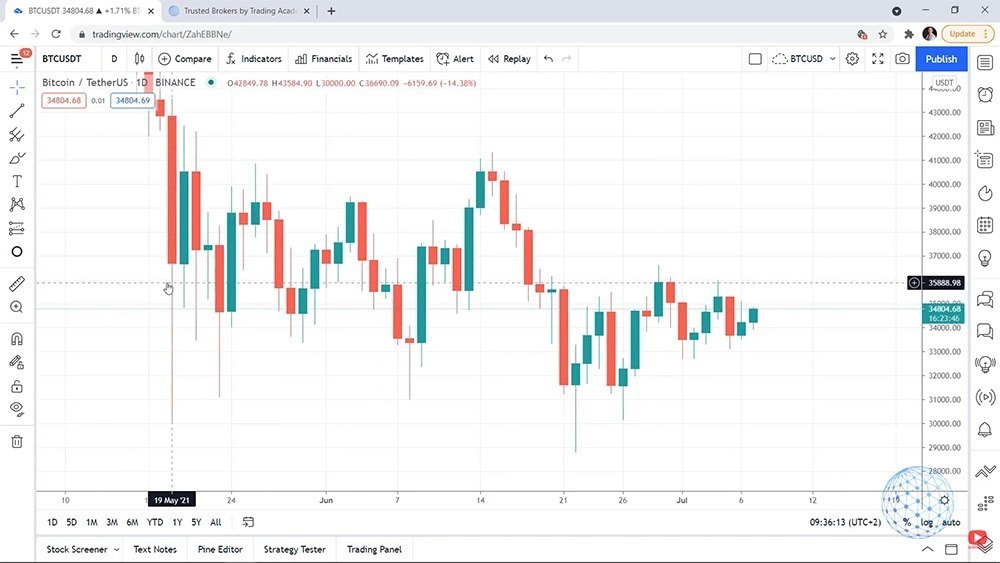
    So in front of me, I have the EURUSD chart for 1 hour which means that every candlestick represents 1 hour and this is a plain chart. We don’t have any indicators and if you are a beginner probably the chart doesn’t mean anything to you and you are frustrated. But even if you are advanced, even for me sometimes when I look at the charts, I don’t know is it a good time to buy or is it a good time to sell.

    The EURUSD chart for 1 hour on MetaTrader 4
    The EURUSD chart for 1 hour on MetaTrader 4

    For example, if we look at one moment back in April the market just goes up and down, up and down, up and down and what is it now? Is it time to buy? Or is it time to sell? Without an indicator over the chart, it’s really hard to say where the market is going and even if I go to a lower time frame like M30, you will see the very same thing, even if I switch down to M15, it’s hard to say.

    Chanigng the timeframe on MetaTrader 4
    Chanigng the timeframe on MetaTrader 4

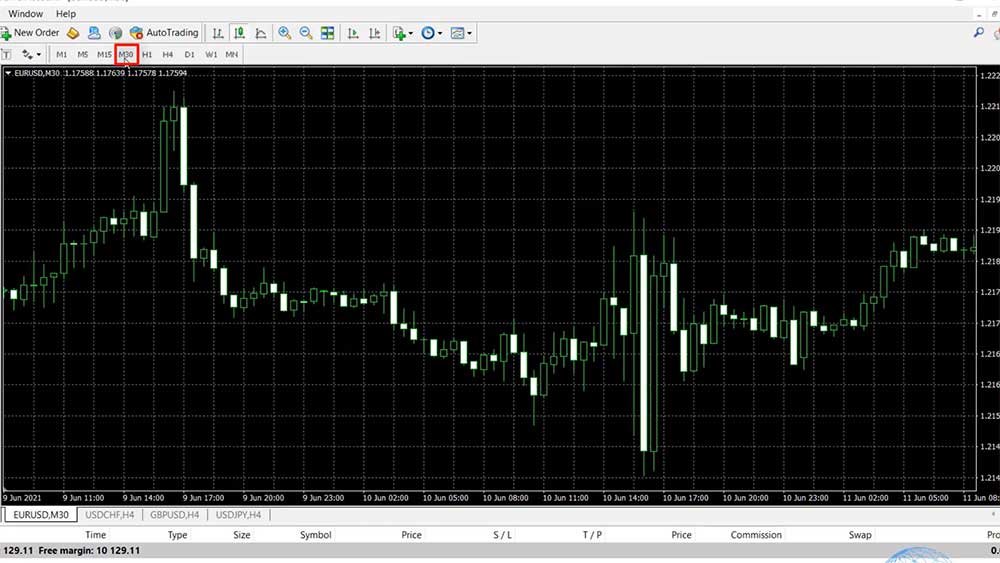
    There are moments when the market goes in one direction and it’s easier to understand and to do some prediction but when the market is just going up and down and we see the chart without looking at the bigger picture on a daily chart, it’s really really hard to say where the market is going.

    Types of MT4 indicators

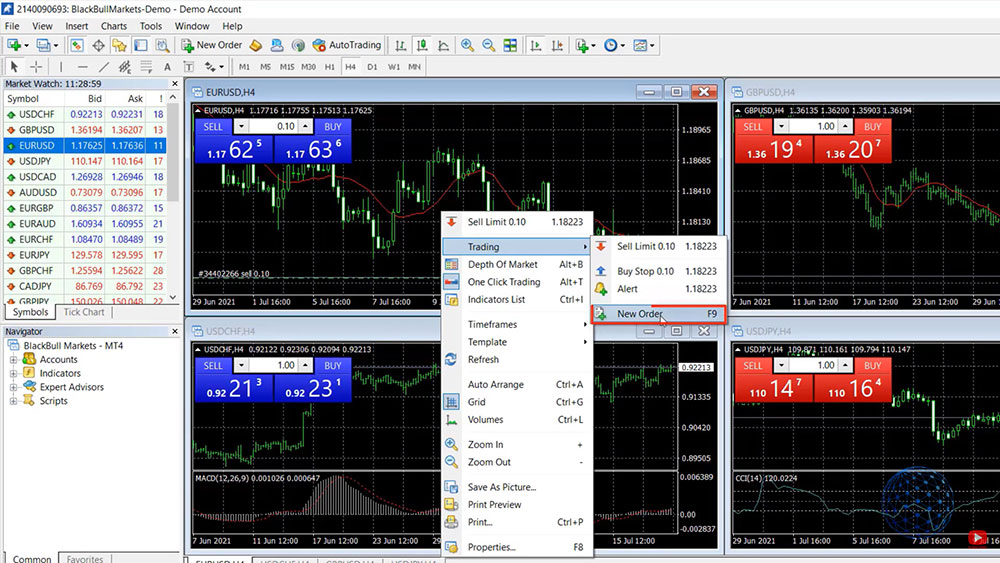
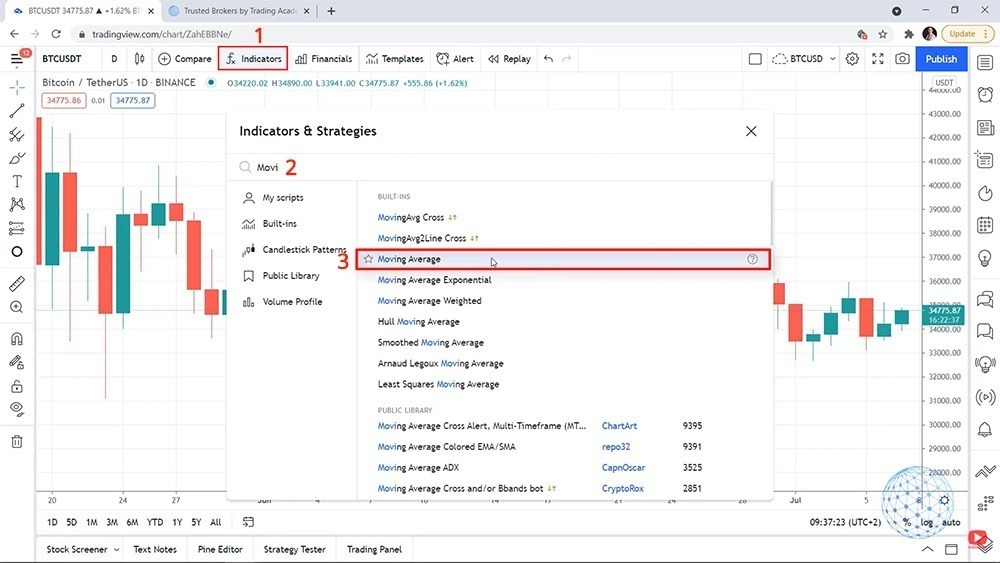
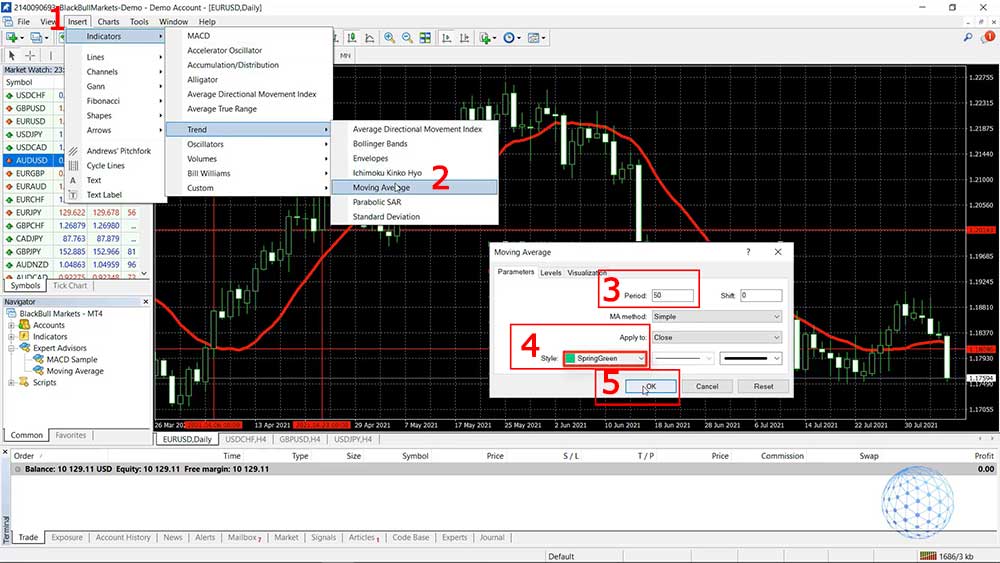
    Alright, so let me put now one indicator over the chart, I will click on Insert and this is where the MetaTrader 4 indicators are located. They are available as well in the Navigator but if I click on Insert and I go to Indicators, you will see that they are grouped in different categories. We have the Trend Indicators, we have the Oscillators, the Volumes, the Bill Williams and we have some Custom Indicators.

    Insert a Moving Average indicator in MetaTrader 4
    Insert a Moving Average indicator in MetaTrader 4

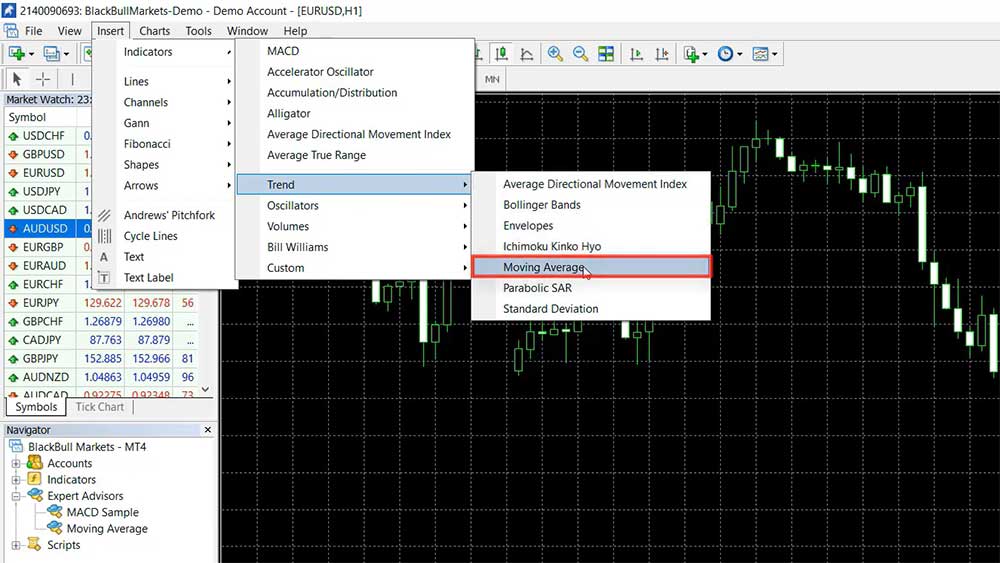
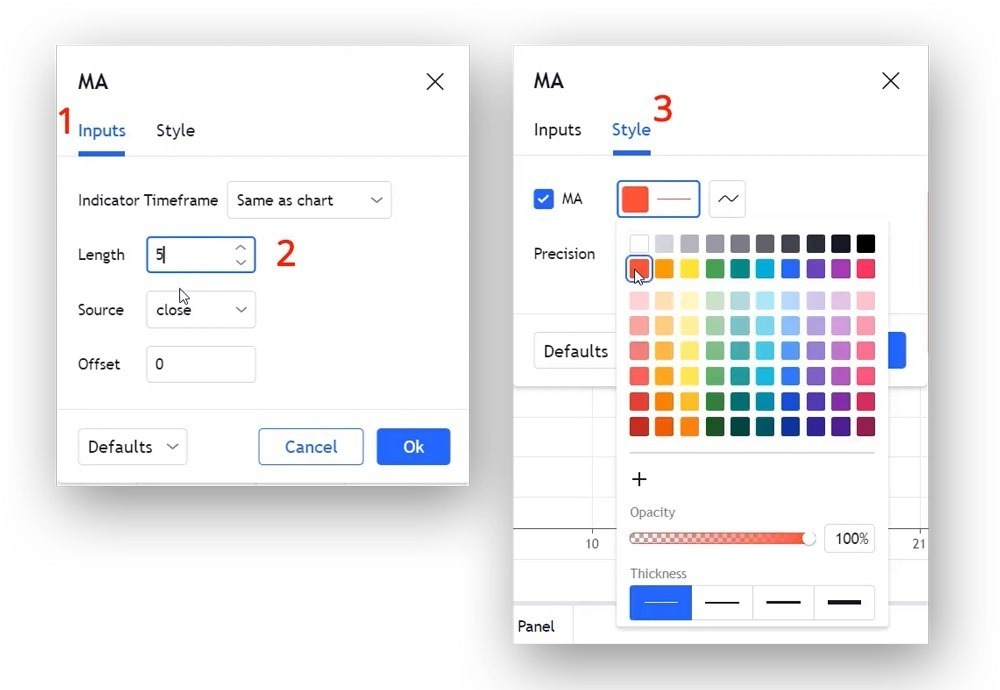
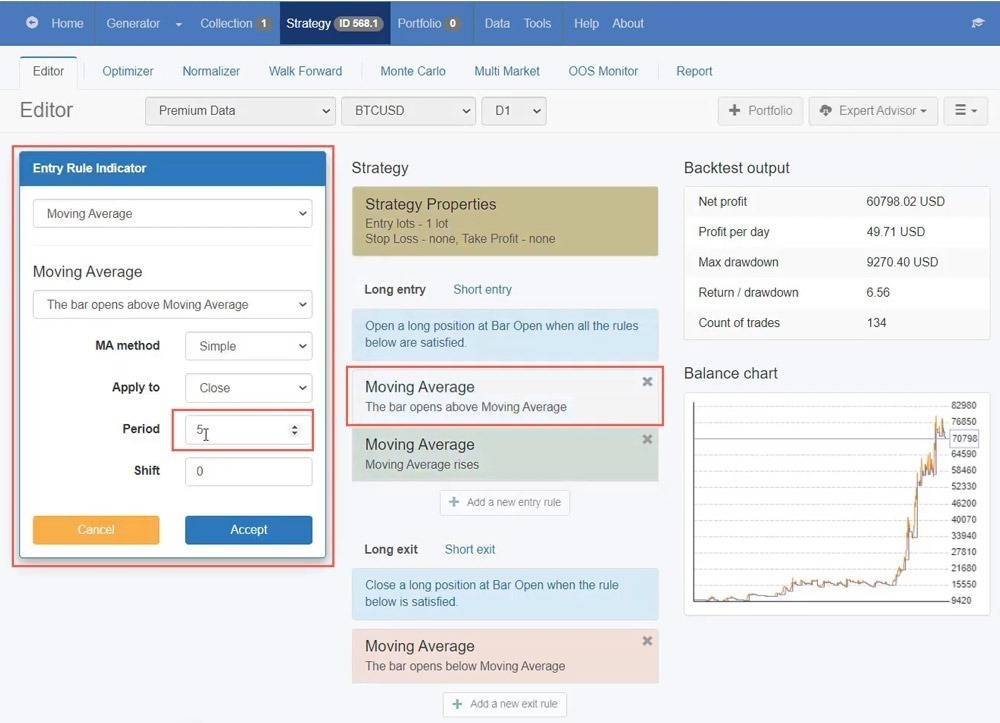
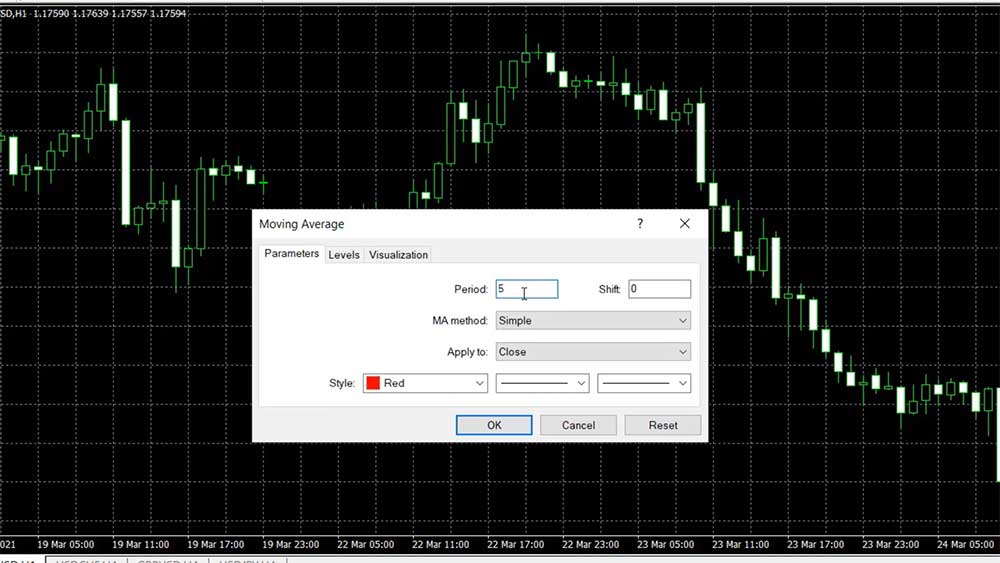
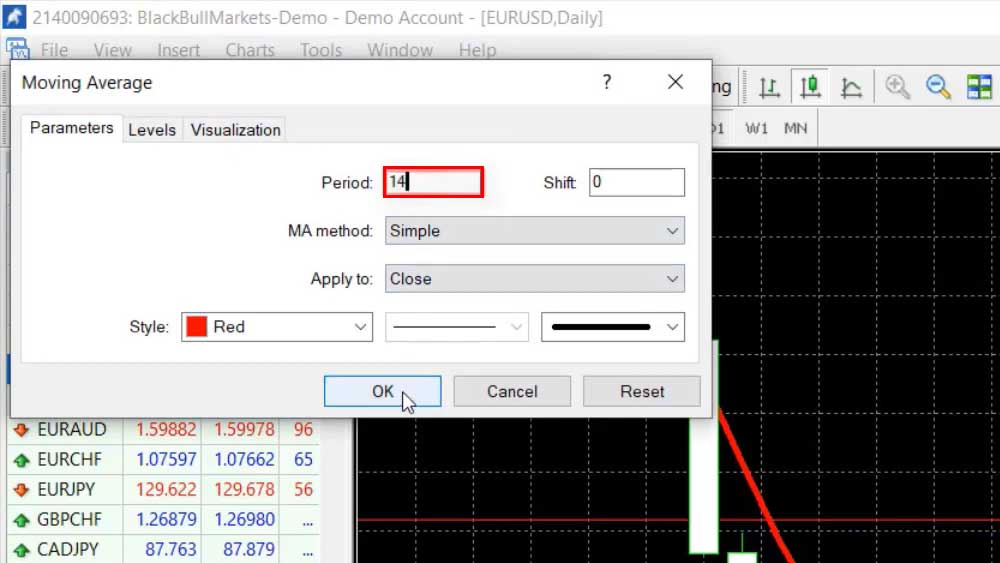
    Now, the Trend indicators are probably the most popular ones and I will choose the Moving Average which is one of the first Indicators out there and for me one of the best indicators. Okay, now we have by default a period of 14 but I will select a period of 5, just to explain better what that is and to give you a better idea about how we use these indicators.

    Change the Moving Average period
    Change the Moving Average period

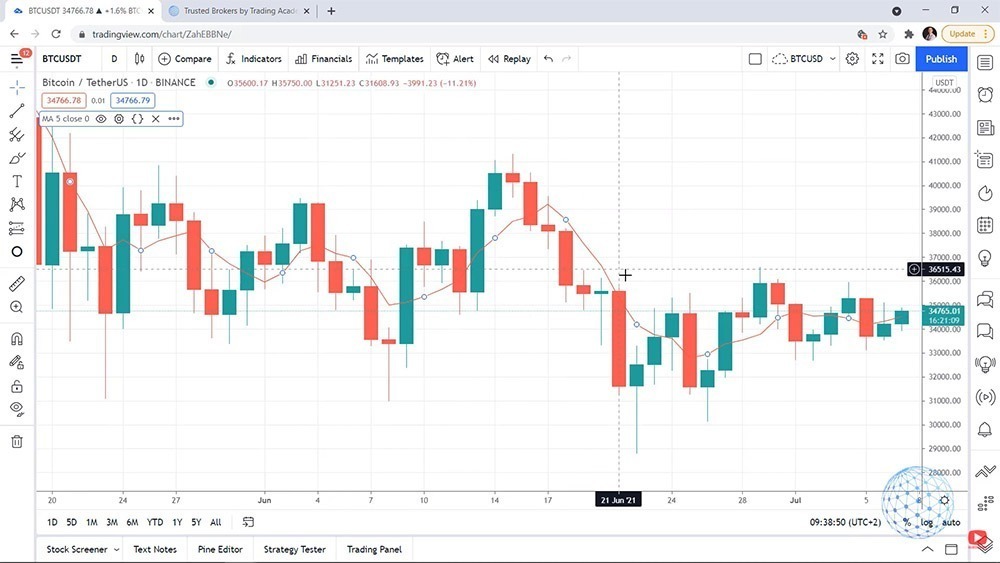
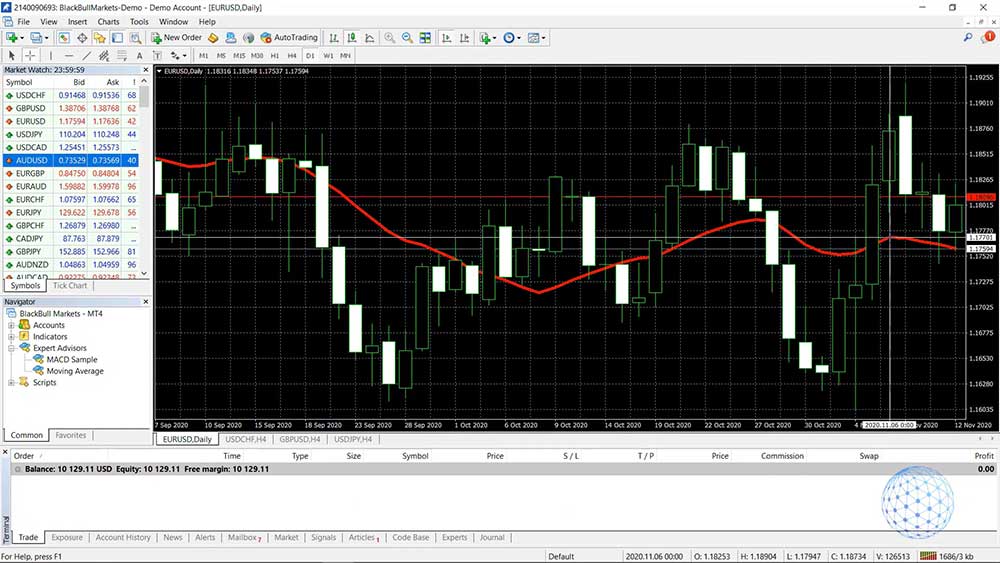
    So after you click OK, you see a line over the chart that goes below the price when the market is bullish and it stays above the price when the market is negative.

    The Moving Average indicator line on the MetaTrader 4 chart
    The Moving Average line on the chart

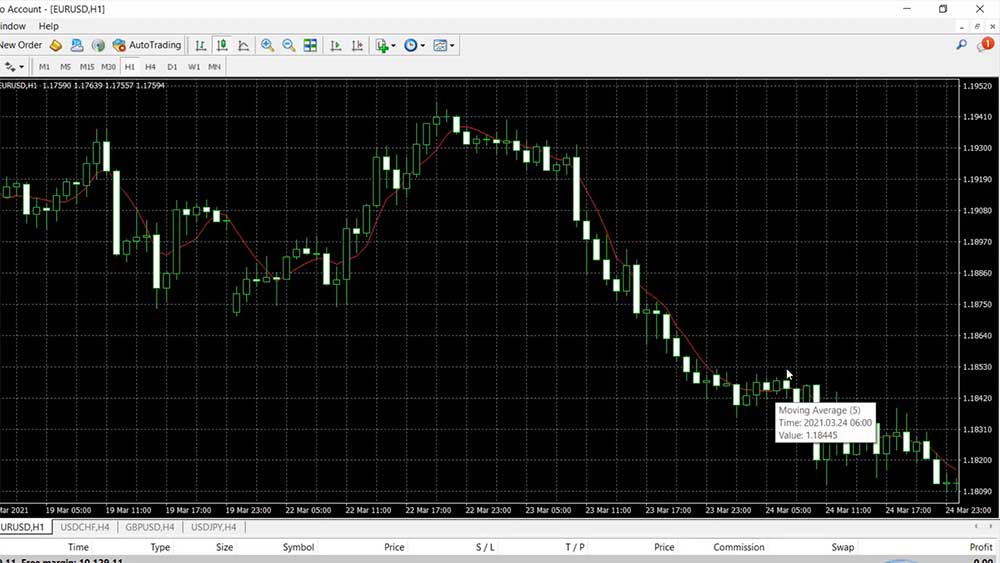
    Okay, and if I scroll the chart, you will see that sometimes this Moving Average goes through the candlesticks. So how do we know when it’s a good idea to buy or to sell?

    When to buy or sell based on indicators

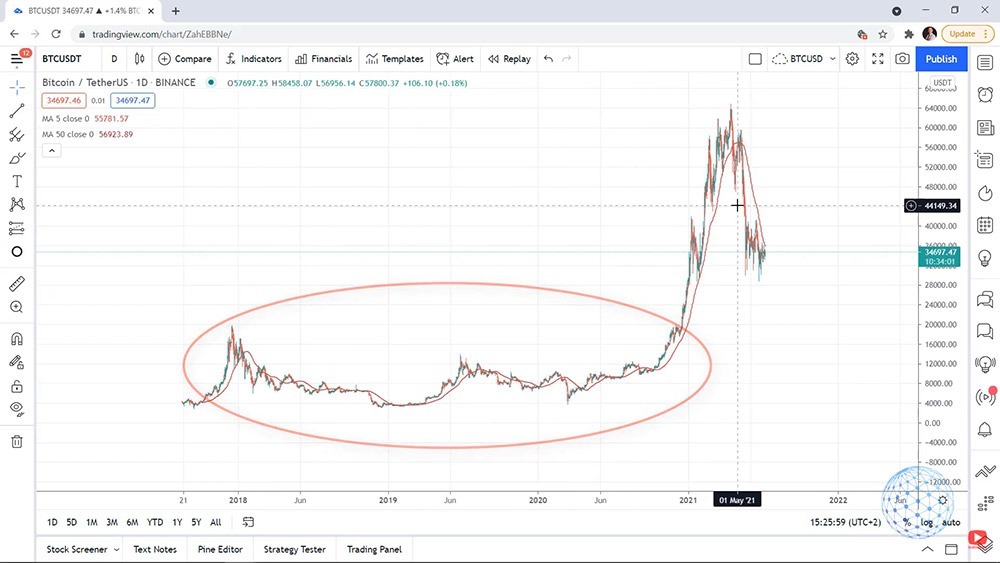
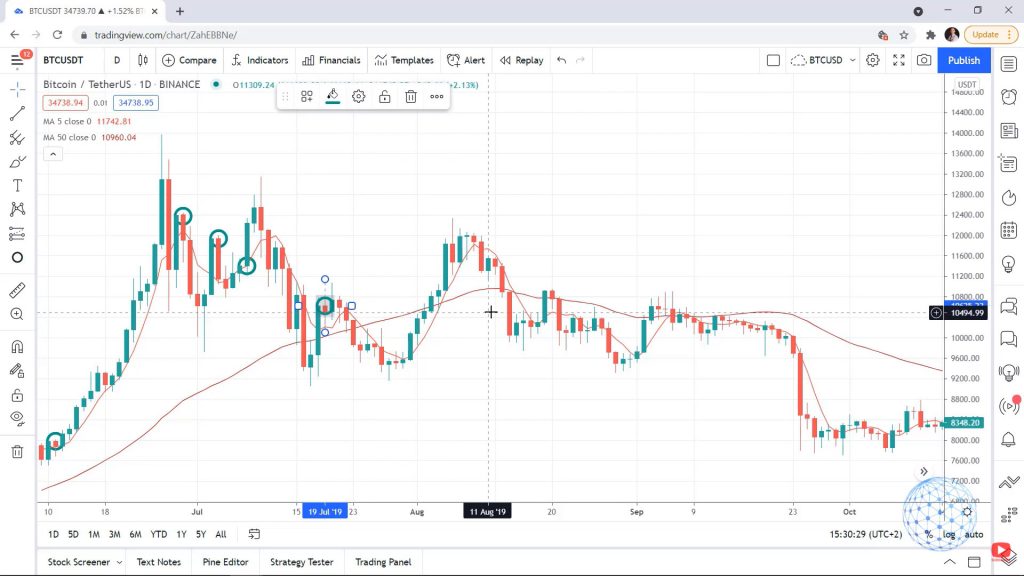
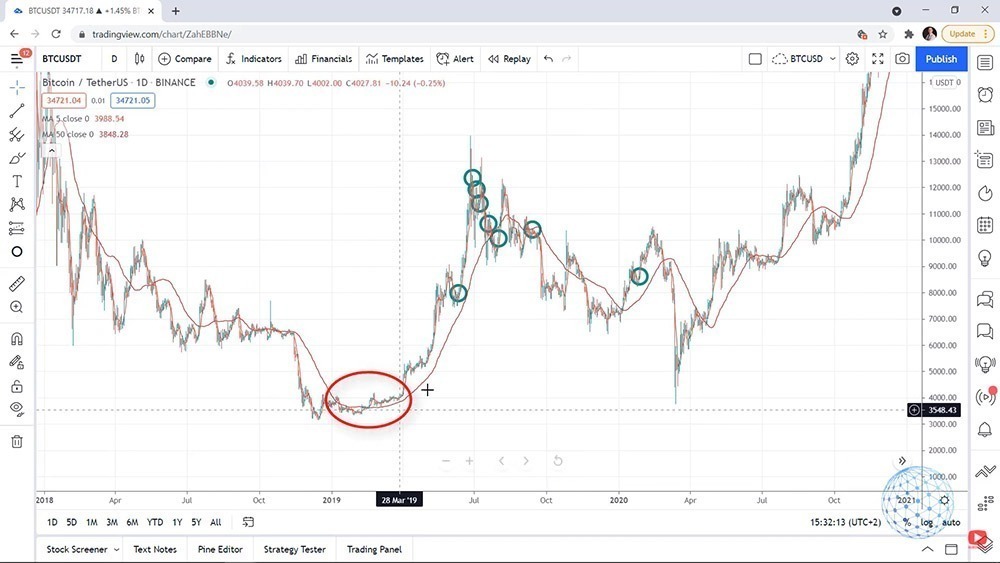
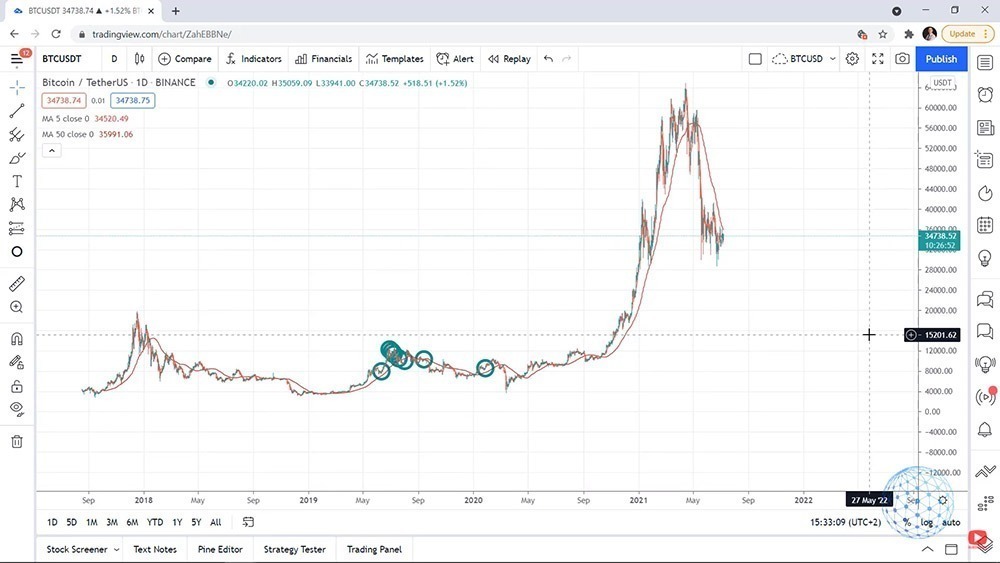
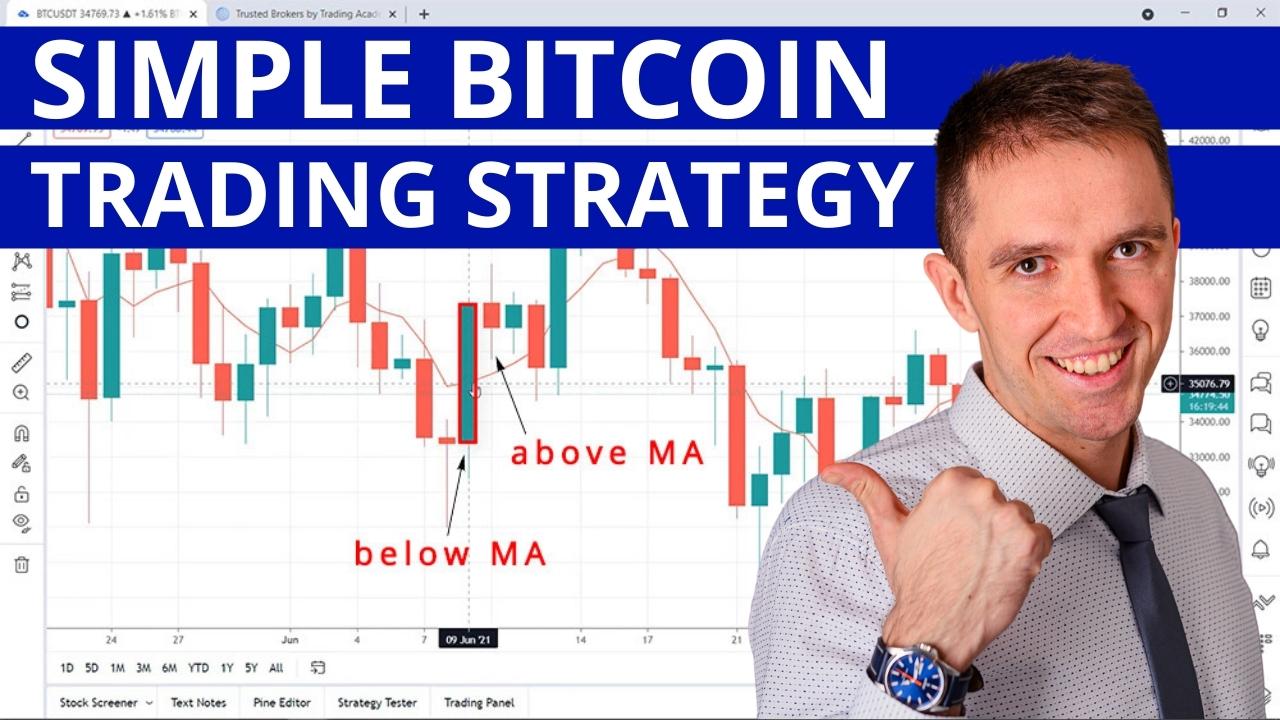
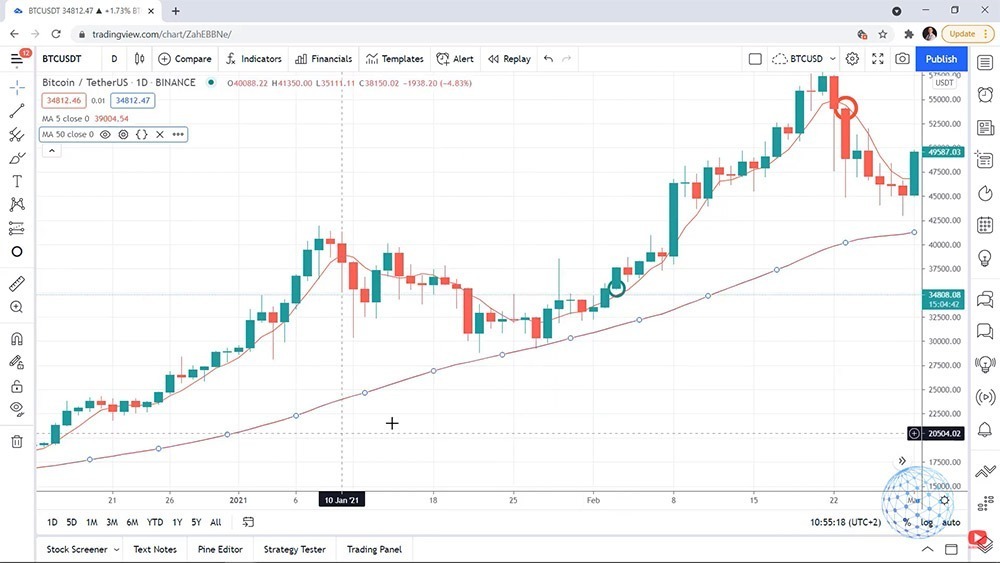
    Now, when using MetaTrader 4 indicators, there are a variety of strategies with each indicator, so with this Moving Average, I can give you a lot of trading strategies but I will give you an example of one right now. It is a decent trading strategy and I’m using this strategy a lot with Bitcoin actually.

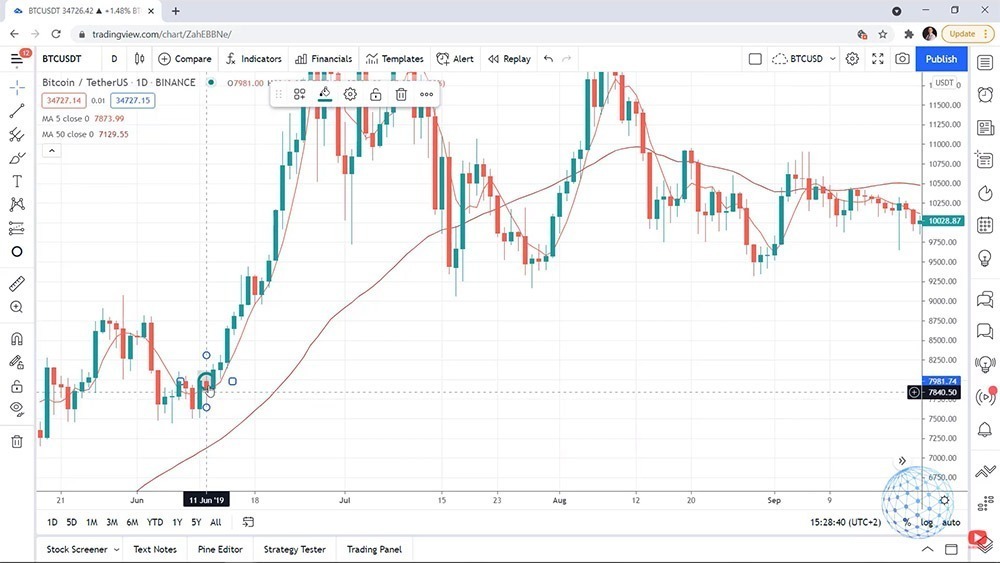
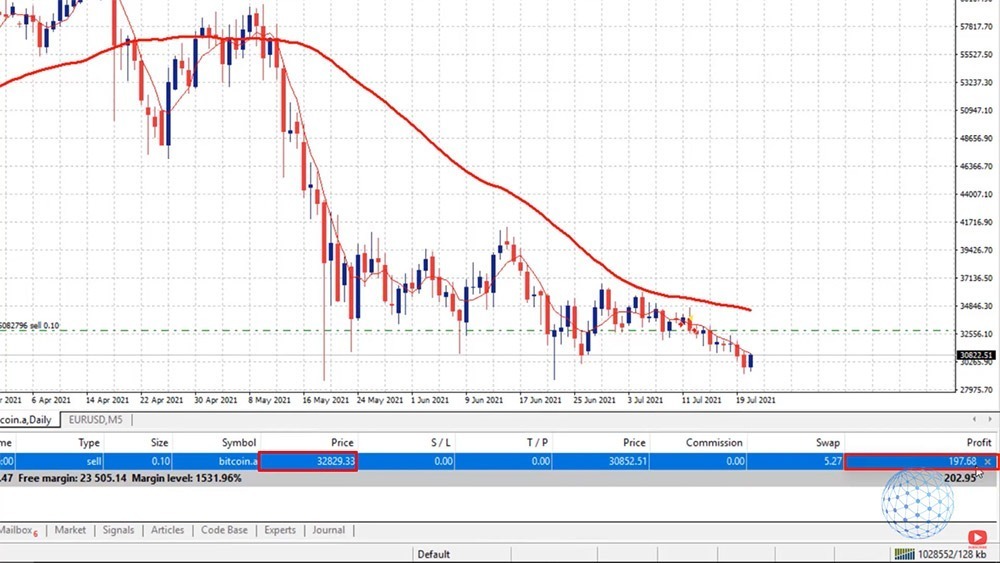
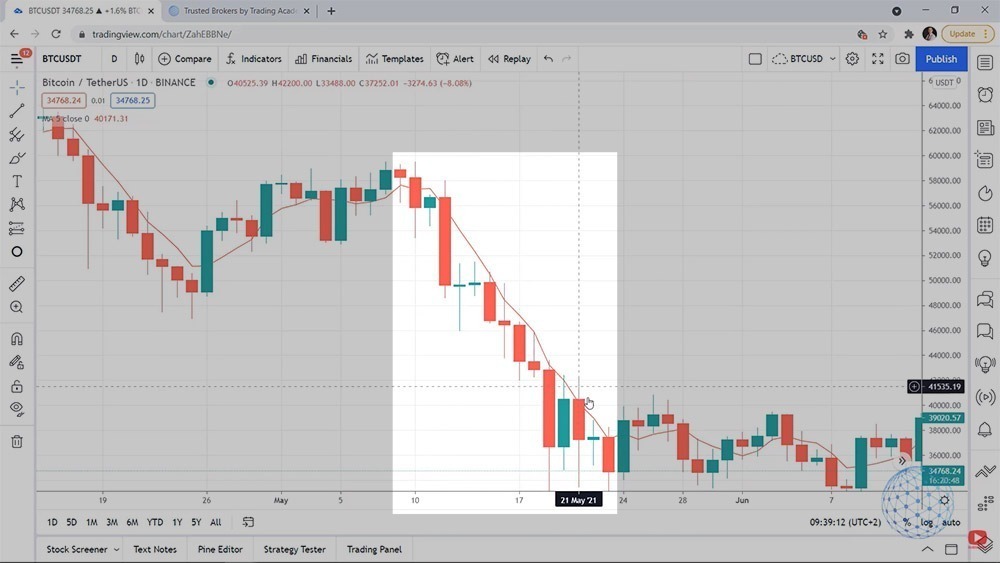
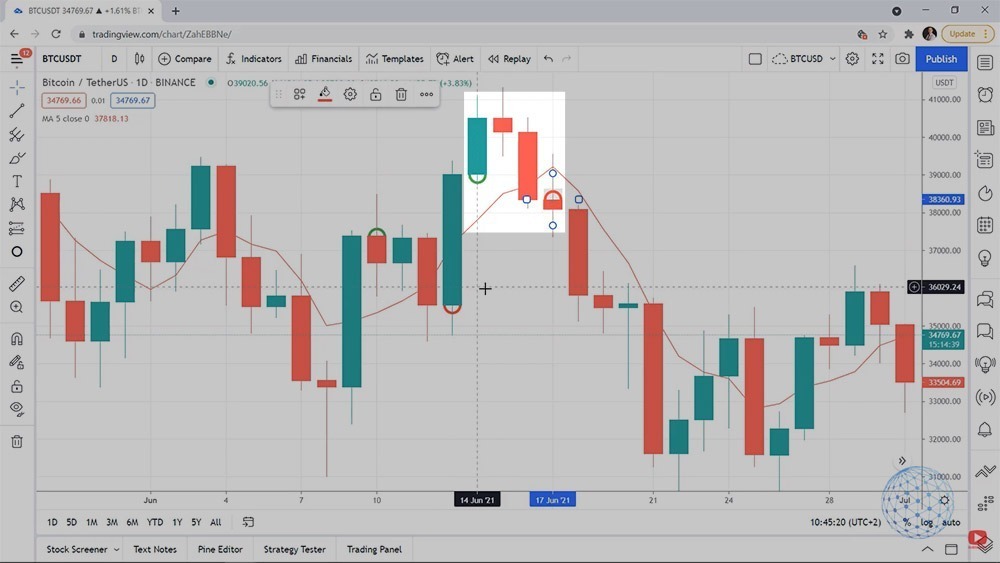
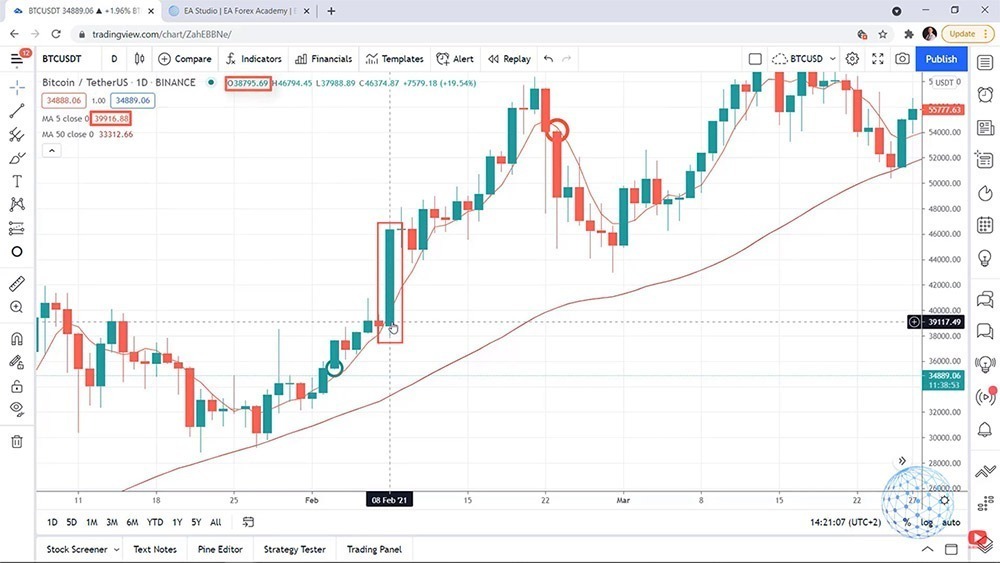
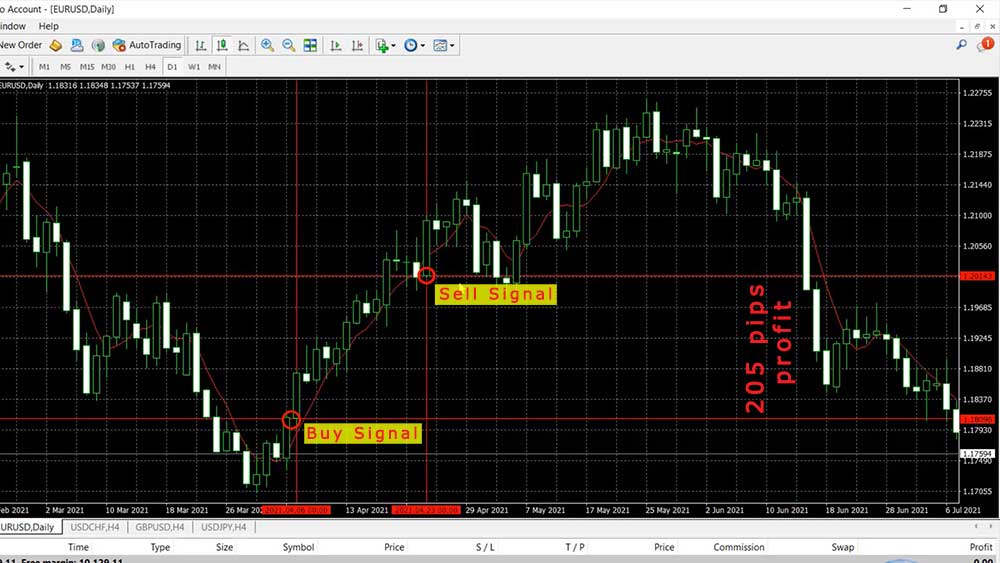
    Every time when the bar opens above the Moving Average actually for the Bitcoin, I’m using it on a daily chart but right now I just want to give you an idea of how I’m using the strategy. I will take a cross here to make it more visual, so every time we have a bar that opens above the Moving Average we have a buy signal.

    For example, we have a candlestick that opened above the Moving Average so this is a buy signal at that moment. I can put one horizontal line and I can put a vertical line.

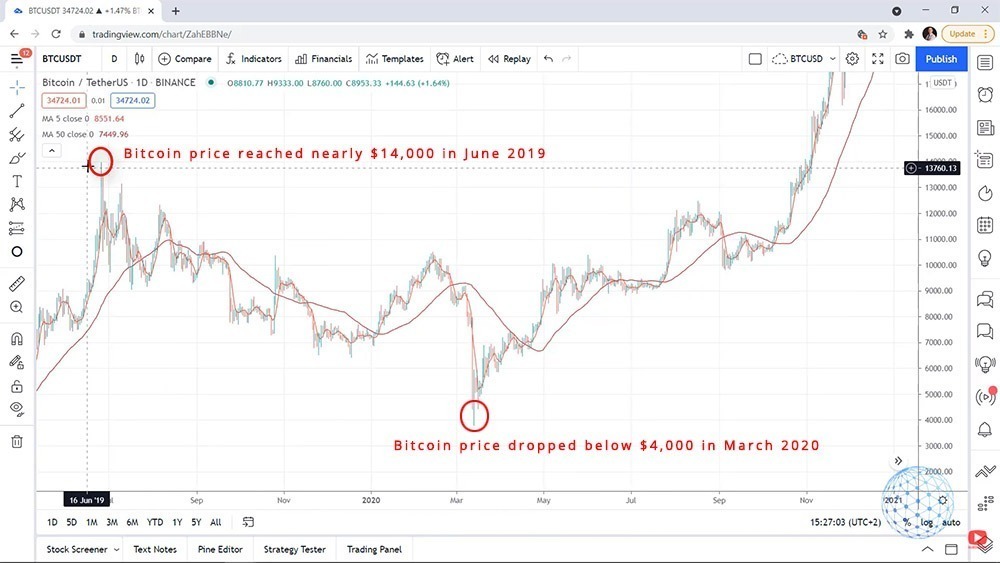
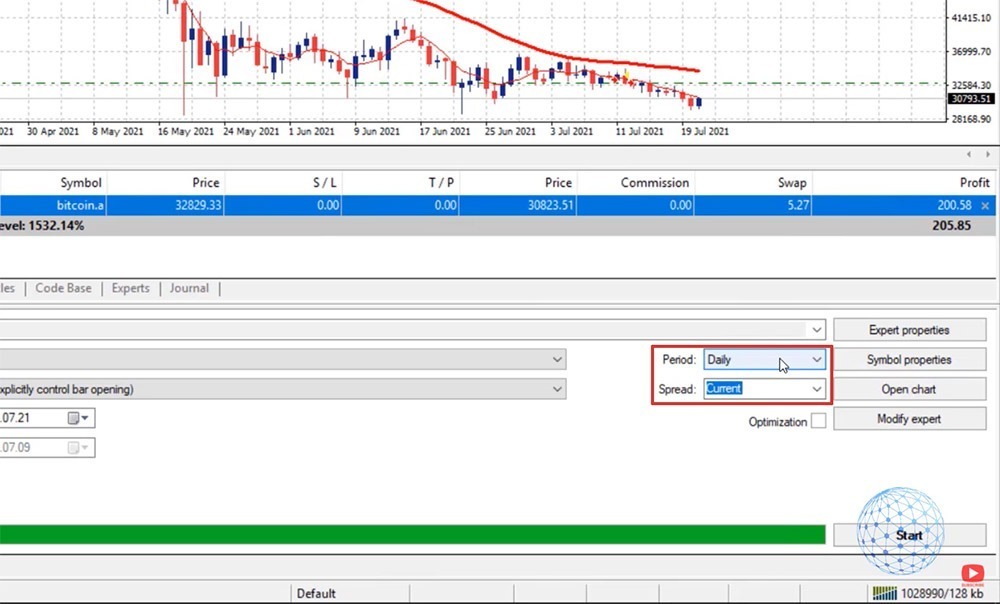
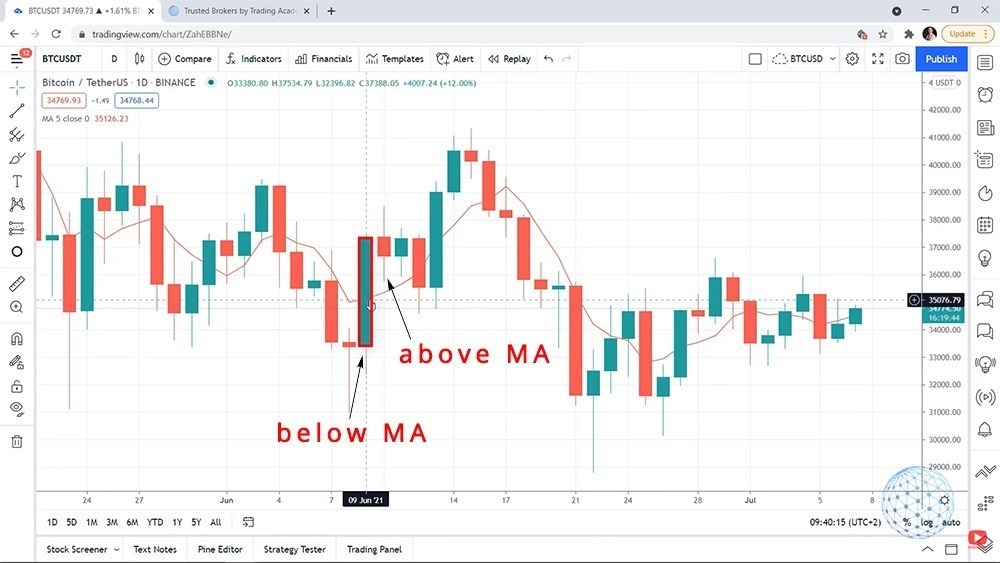
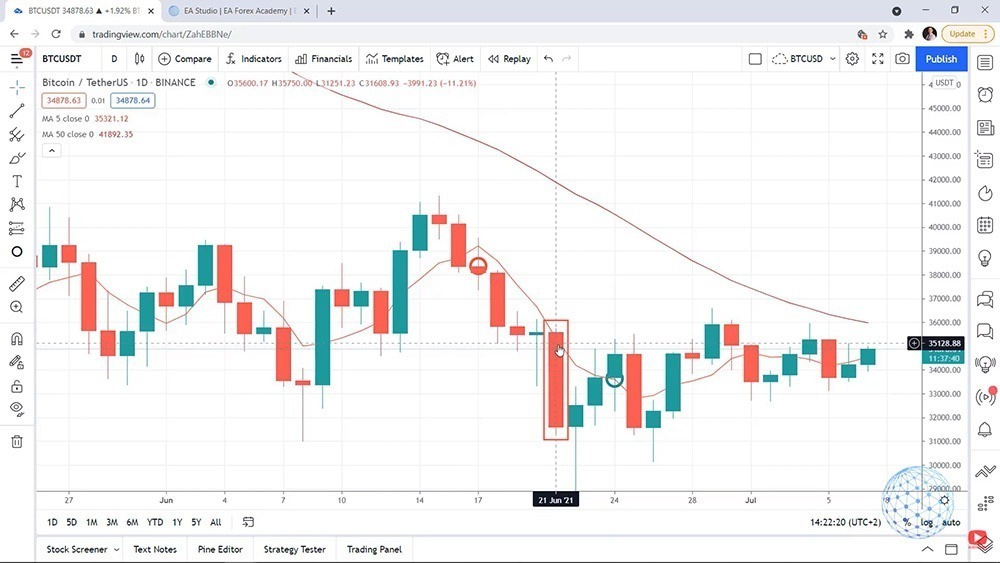
    Here we go, at that moment we have the buy signal, and then when we have a bar that clearly opens below the Moving Average, we close the trade and we take the profit. On the chart below, you can see that this bar, or this day, this candlestick opened below the Moving Average so in this case, we would make a profit of over 200 pips, actually, if I have to be precise it is 205 pips on a daily chart.

    The trading strategy which uses Moving Average indicator
    The trading strategy which uses Moving Average indicator

    I have explained this trading strategy recently in one of my Bitcoin courses. It is called the Simplest Bitcoin Trading Strategy because it’s super simple indeed but I use one more Moving Average to confirm the direction. I’m not going into this strategy right now because I want to explain for beginners what are the MetaTrader 4 indicators, how useful they are, and at the same time what are the cons.

    MetaTrader 4 indicators are repeating

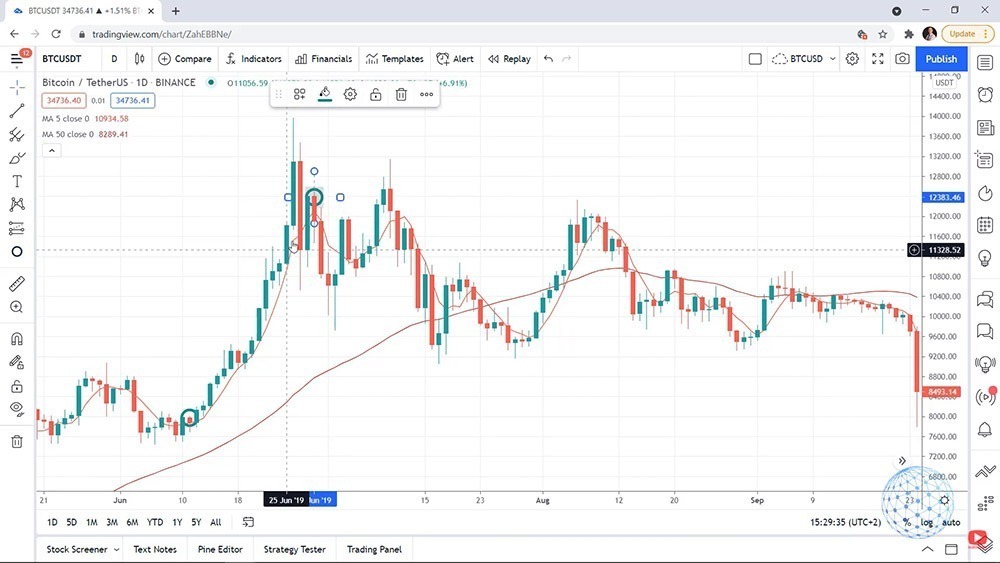
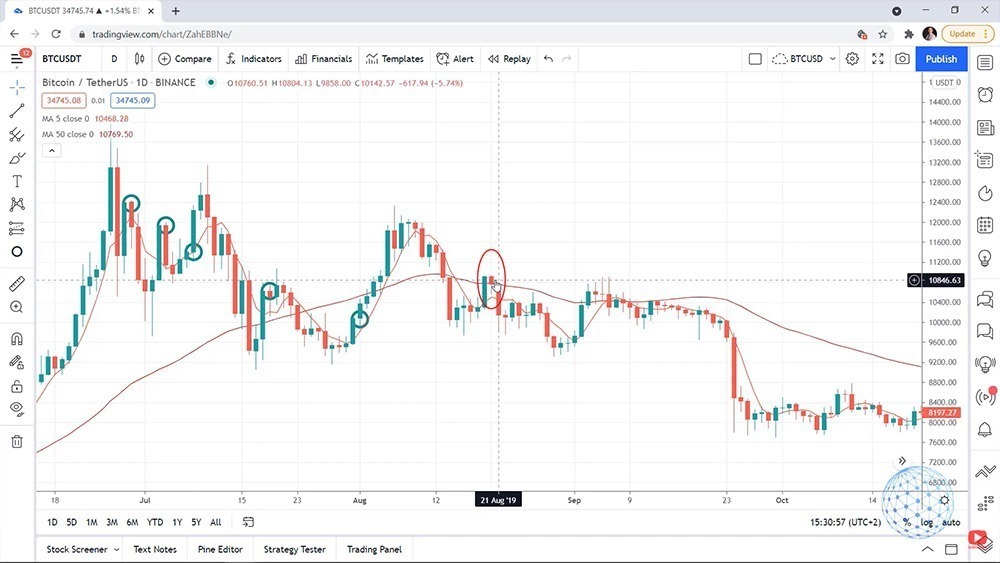
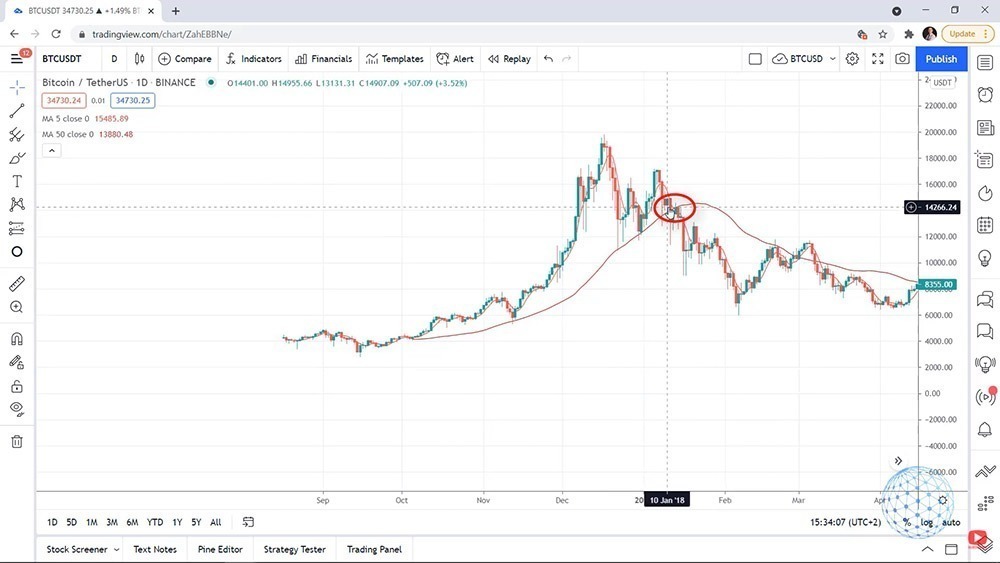
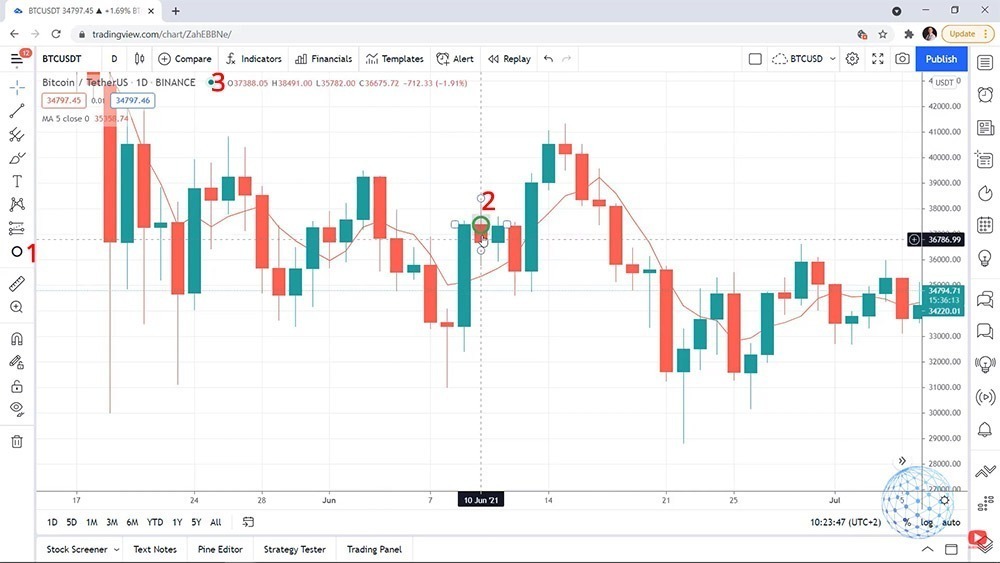
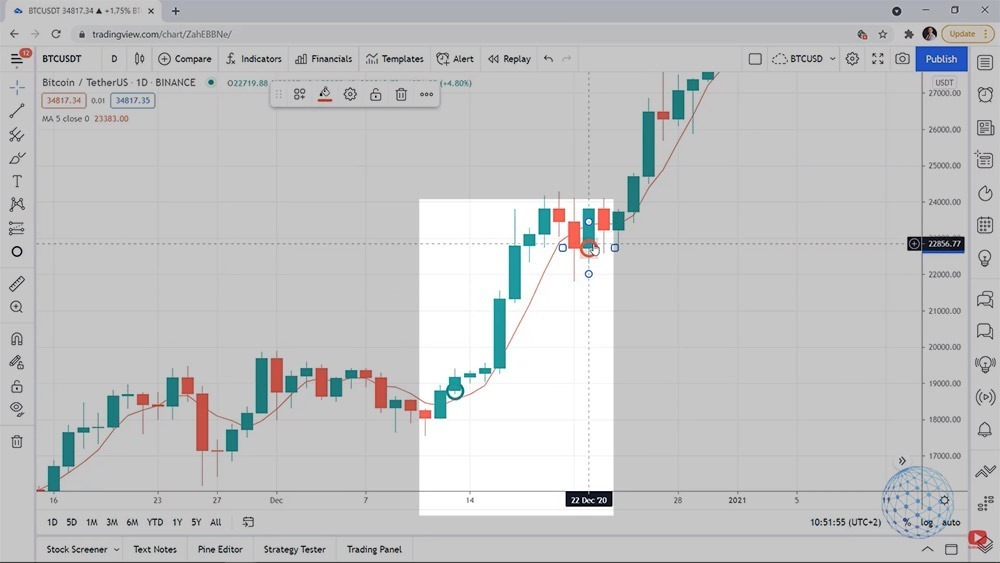
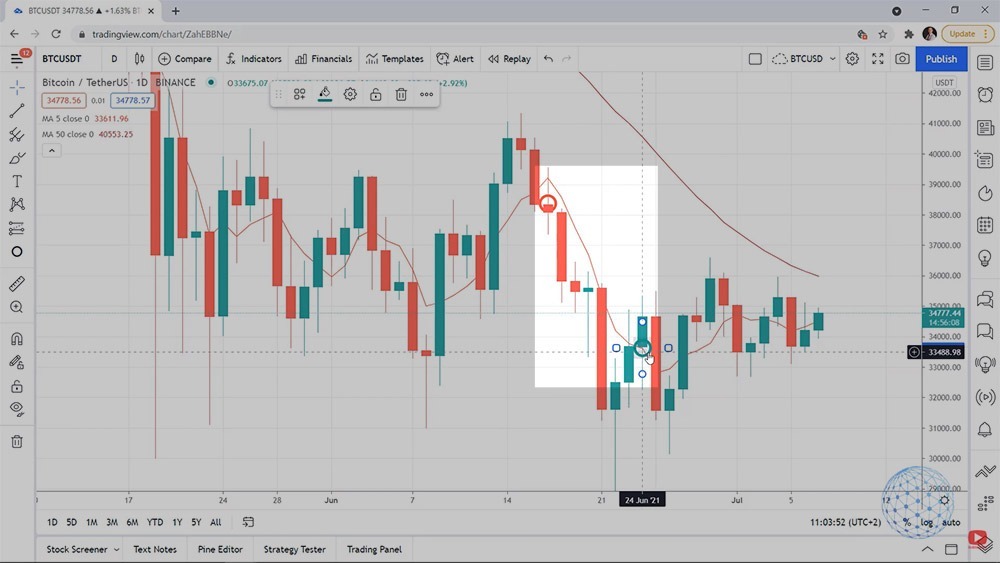
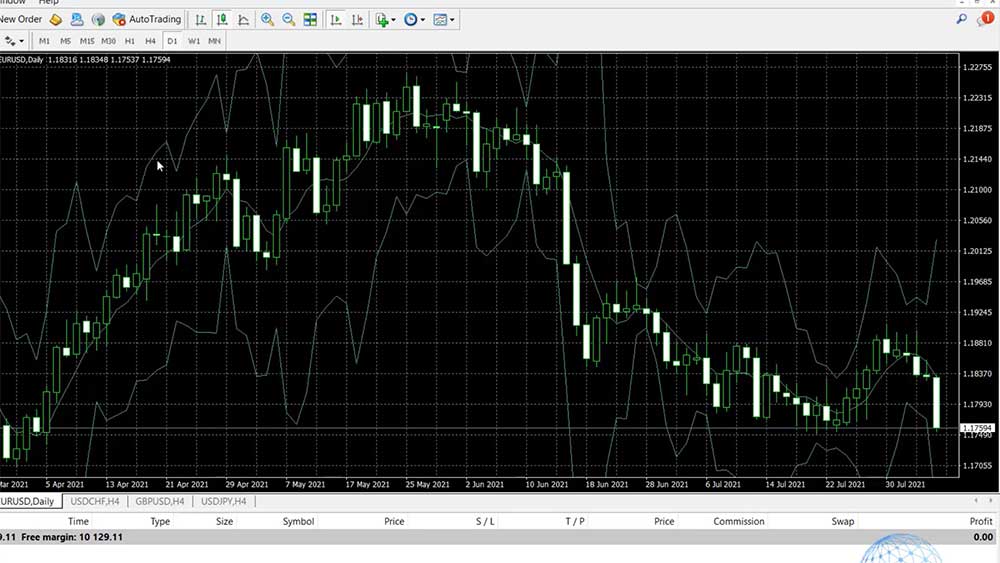
    Now if I zoom the chart over here with the example I picked it super randomly, one more time that’s not a strategy for EURUSD, it’s for Bitcoin and I’m showing it over the EURUSD just for demonstrational purposes, but I want to show you something. If we look back at the chart have a look at this candlestick.

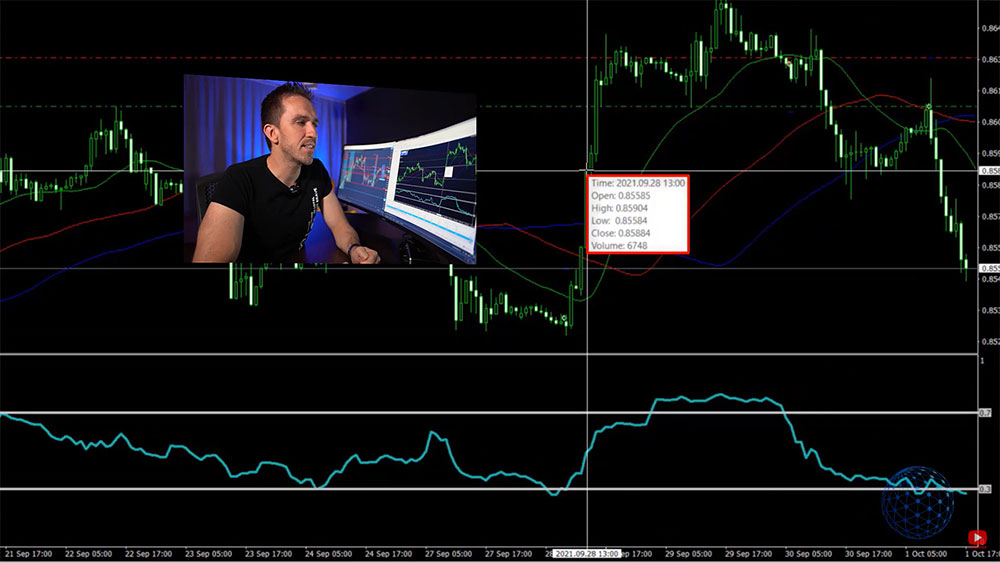
    I said that when the candlestick opens below the Moving Average we should be closing the trade. Now I will ask you something – did this bar open below or above the Moving Average? It’s super hard to say because if I put the mouse on it we can see the 4 values that we have – the open, the high, the low, and the close prices. So the open price is at 1.1888 right but the Moving Average has the value of 1.1890, a little bit higher but pay attention to this.

    Looking at this chart it's hard to say whether should we buy or sell
    Looking at the above chart it’s hard to say whether should we buy or sell

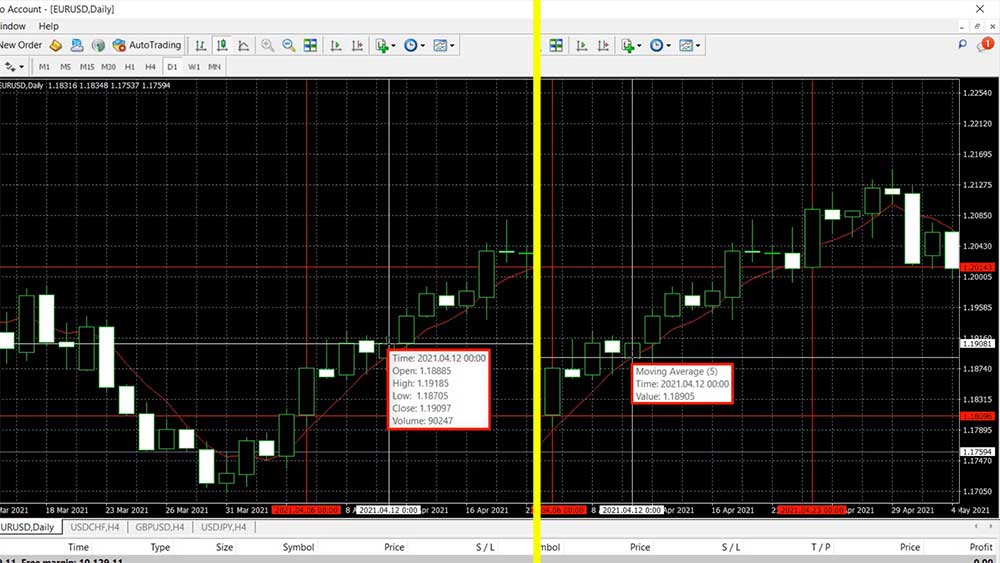
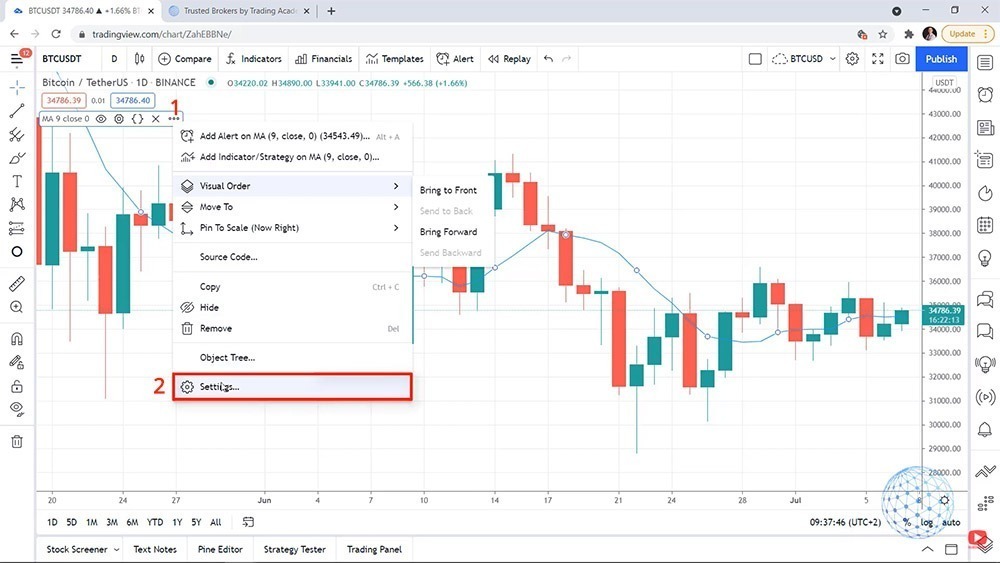
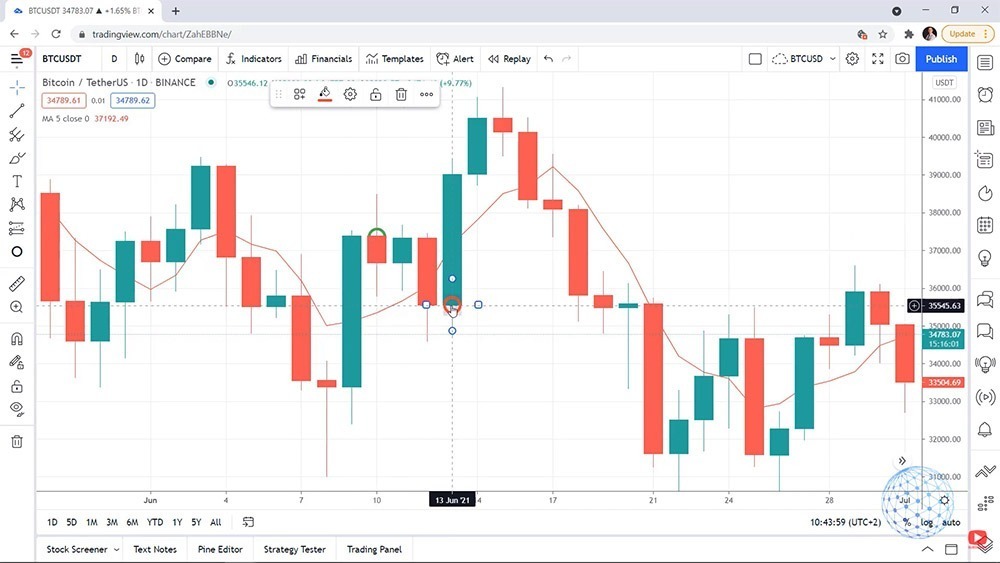
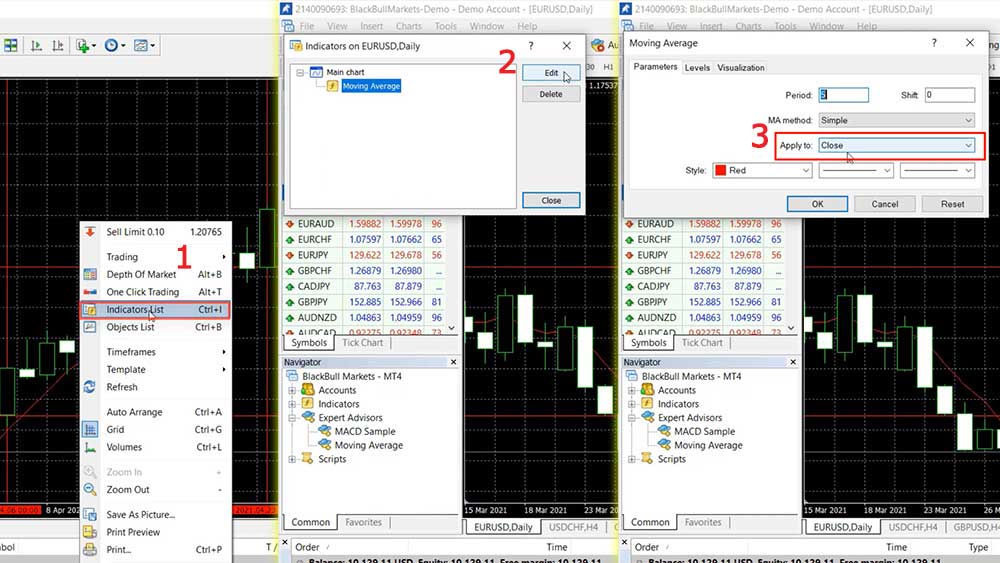
    If I right-click over the chart and I go to the indicators’ list, I will go to the settings of the Moving Average, I will click on edit and you will see that it applies to close which means that the value of the Moving Average is at the closing of the candlestick, not at the opening, so we don’t really know where the Moving Average was when the bar opened.

    The Moving Average indicator applies to close price on MetaTrader 4
    The Moving Average indicator applies to close price on MetaTrader 4

    We can assume that it was the value from the previous bar because when the previous bar closed, there should be an opening, but because this is a daily candlestick there is a difference between the closing and the opening of the next bar. So just to summarize it, probably the Moving Average was lower than the opening at this candlestick, but we cannot say this with certainty. We don’t know this from the chart and a lot of traders and mentors build their strategies just by looking back on the chart but that is wrong.

    What you need to know about the Moving Averages and about most of the MetaTrader 4 technical indicators is that they are repeating. So we don’t know what exactly happened at the opening of this bar. If I go to the end of the chart by pressing this button on the top which says scroll the chart to the end on tick incoming, you will see that the price is not moving simply because it is Saturday.

    The end of the MT4 chart
    The end of the MT4 chart

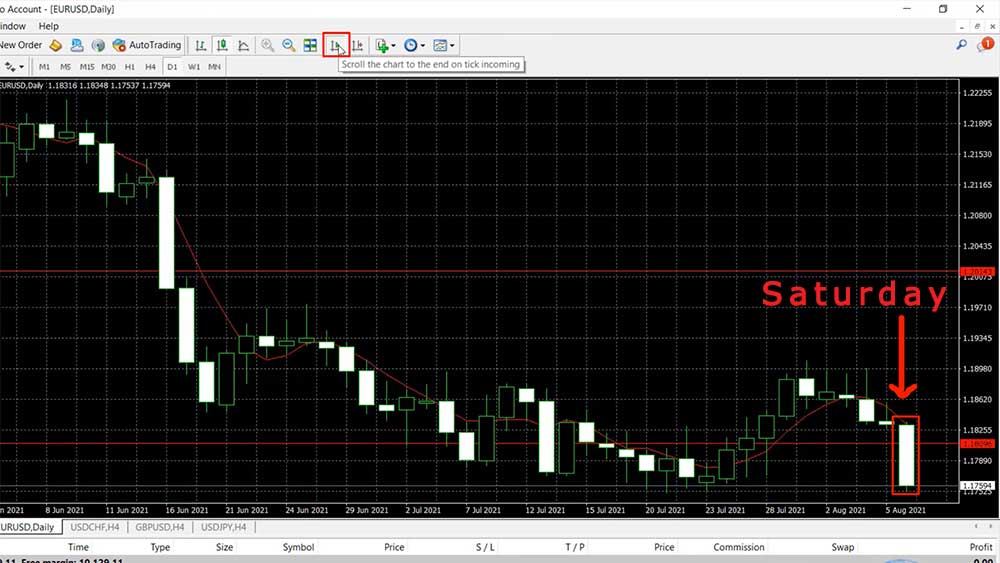
    I’m preparing this lecture about MetaTrader 4 indicators on Saturday. I usually take my time during the weekends to record as many examples as I possibly can when I’m not trading and you will see that we have a current value for the Moving Average that sits at 1.18323, but this value was different at the opening of the bar and it’s totally different at the closing of the bar.

    So during the day on Friday, this value of the Moving Average indicator was changing, and then on Monday when the market opens, we will have a fixed value of the Moving Average technical indicator in MetaTrader 4. Alright, so how the Moving Average is calculated? I wanted to bring out the first concern which is the major concern when we are using Moving Averages and other MetaTrader 4 indicators. But of course, there is a solution to this problem which I will mention just in a second.

    So for you to understand me better I want to tell you how the Moving Averages are calculated. What actually the Moving Average does, it makes the chart smoother. I will increase the Moving Average right now, I will make it thicker, I will pick the thickest option, I will click on OK and here it is.

    making the Moving Average indicator ticker
    How to make the Moving Average indicator ticker

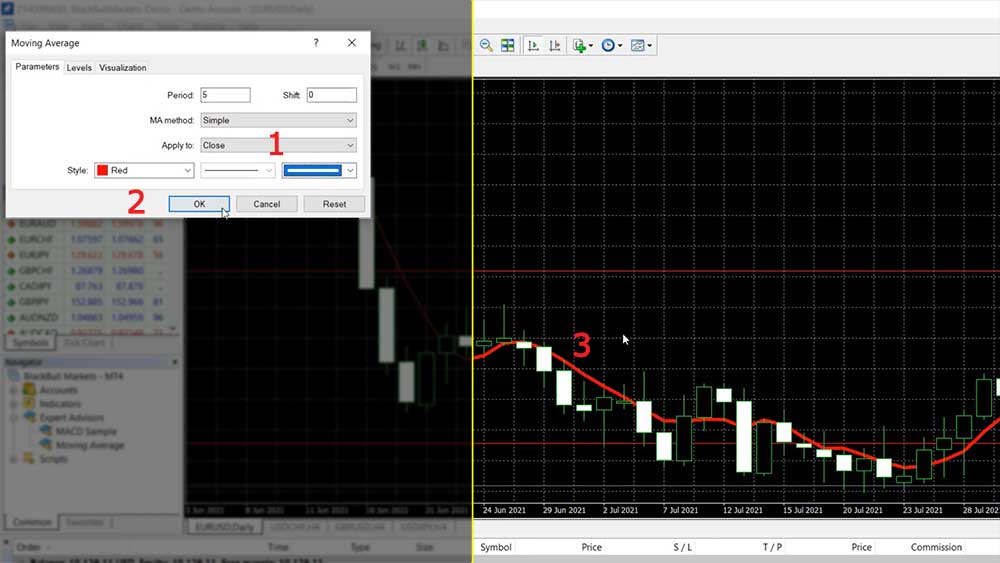
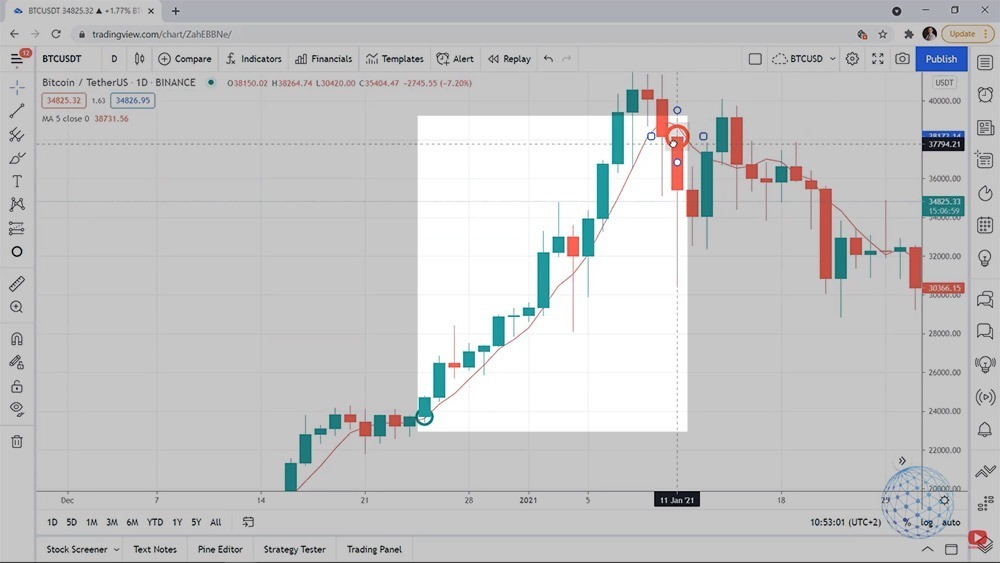
    So if you try to ignore the candlesticks and just look at the line you will see that it makes the chart smoother. Right there the market goes down, after that it goes up and you see with our example we have positive candlestick, negative, positive, negative, positive, positive, positive, negative, positive, positive.

    We have a kind of Gravestone Doji formation or something like that and here the market just goes sideways. But you see that the 5 Moving Average clearly shows that direction is upwards and the market continues until that moment. Then we have a drop, then the market continues higher.

    Simply said, the Moving Average makes the chart more understandable, smoother and we have an idea of where the market is going. Is it going down, is it going up, is it staying just flat or it’s just sideways, right you can see that the Moving Average really shows the direction.

    So the first concern is that it is repeating, it changes its value on the current bar and the first pro is that it makes the chart smoother so we can clearly see the direction.

    Now how the Moving Average is calculated? The Simple Moving Average is calculated based on the closings of the candlesticks and because I selected a period of 5, it means that the last 5 days are summed and divided by 5. So it is the closing of that day, plus the closing of this day, plus the closing of this day, plus the closing of this day, plus the closing of this day, divided by 5, it’s that simple.

    calculation of Moving Average technical indicator
    Calculating the Moving Average indicator value

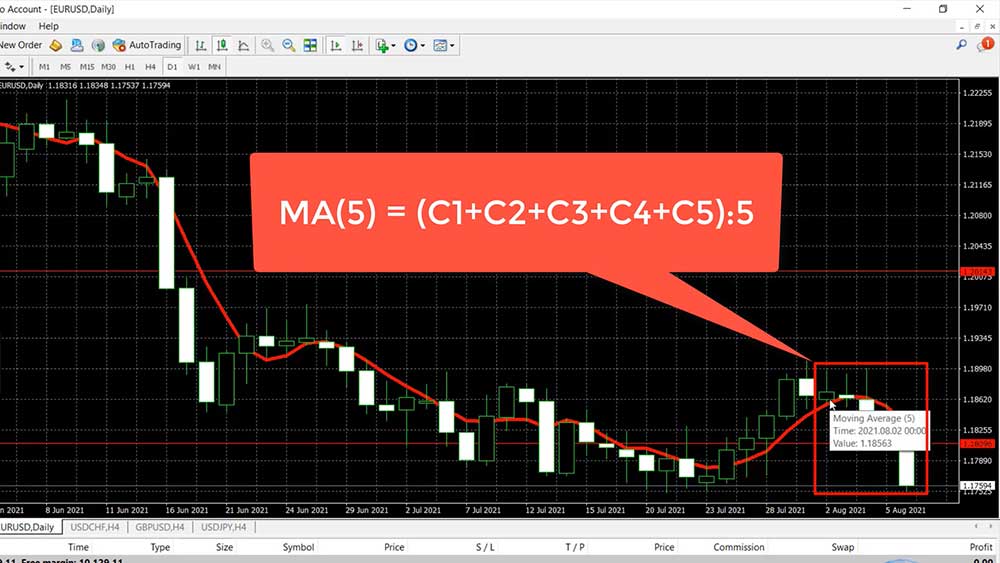
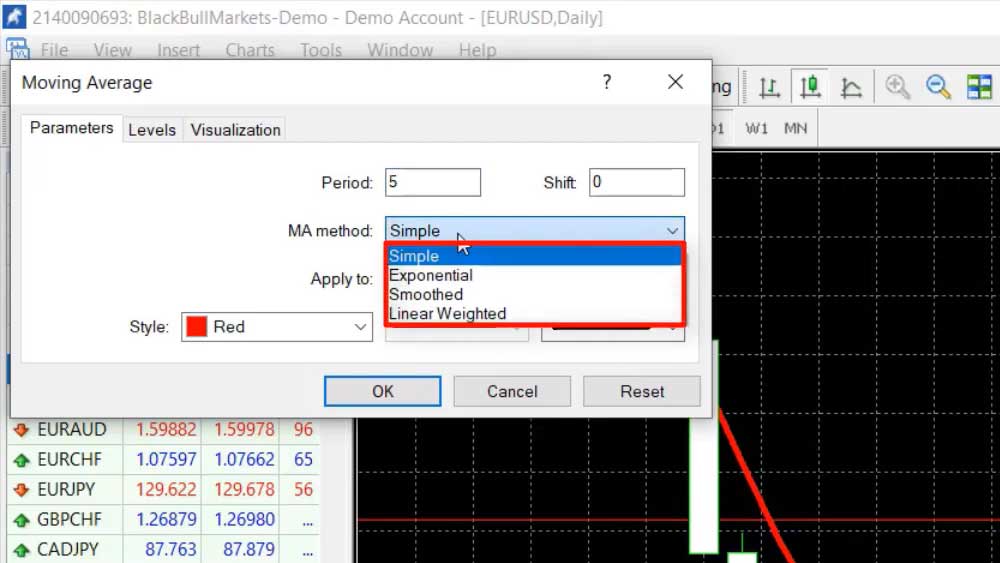
    This is how the Moving Average is calculated, it’s super simple and that’s why it’s called a Simple Moving Average. We have a few different Moving Averages by the method they are calculated, so it could be a symbol, it could be exponential, it could be smoothed or it could be weighted but I’m not going into details on how they are calculated.

    Types of Moving Average indicators
    Types of Moving Average indicators

    If I switch to exponential you will see no big difference, look at the chart here it is a very very small difference. It depends on what your strategy is and where are the entries, the exits, some strategies work with the Simple MA, some strategies work with the other methods. One more time, not a huge difference over the chart.

    The default indicator parameters

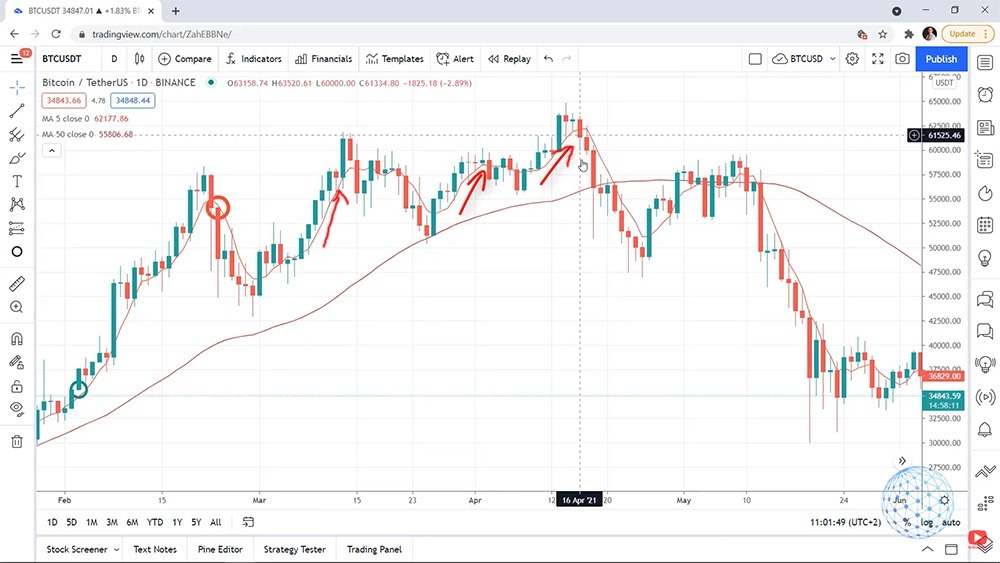
    Alright, so the different MetaTrader 4 indicators are calculated with different formulas. You don’t need to go into details about the indicators but the second concern that you need to know about the indicators is that the default parameters don’t really work.

    So by default as you saw with the Moving Average, there was a period of 14 but these default parameters were created from the brokers and if you use the default parameters, probably you’re about to lose money. I don’t say certainly but I say probably.

    Default value of Moving Average indicator on MetaTrader 4
    The default value of the Moving Average indicator on MetaTrader 4

    Look at that example with the default 14 – if you buy when the price goes above and you sell when the price goes below, you will be buying and selling a few times. Well, it’s hard to say right, depends on the strategy one more time but the default parameters doesn’t really work.

    The MetaTrader 4 chart with the default value for the Simple Moving Average indicator
    The MetaTrader 4 chart with the default value for the Simple Moving Average indicator

    Combining different indicators

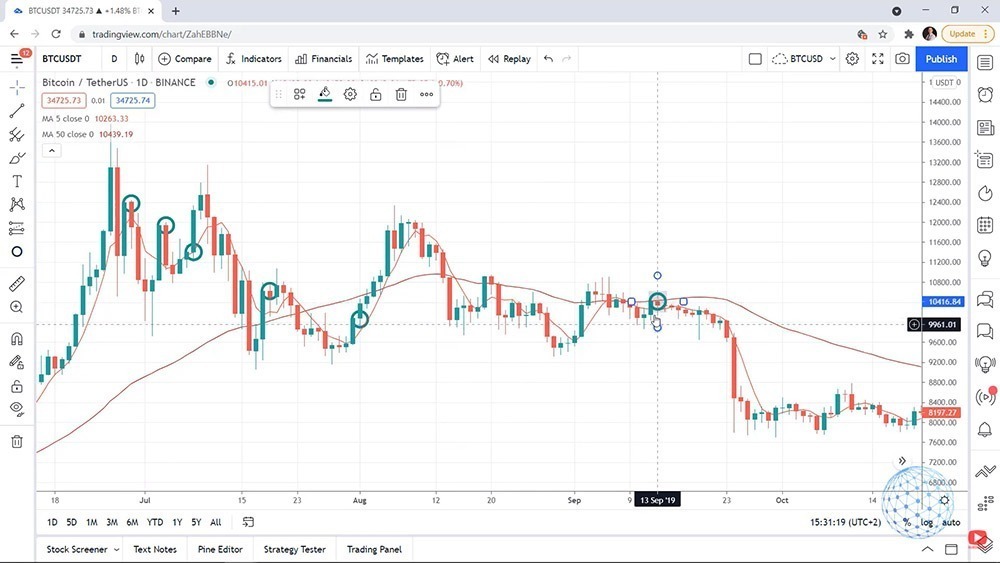
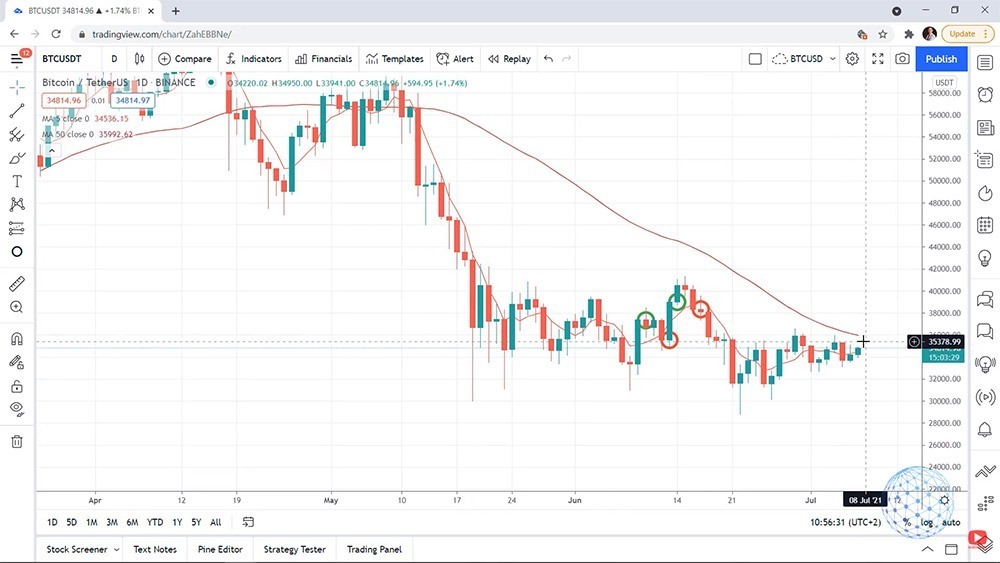
    Now the second pro I want to give you is that you can combine different indicators. For example, I will add a Moving Average of 50 and I will click on OK. We’ll make it thicker again, let’s change the color to green and I will click on OK.

    Placing another Moving Average indicator on the MetaTrader 4 chart
    Placing another Moving Average indicator on the MetaTrader 4 chart

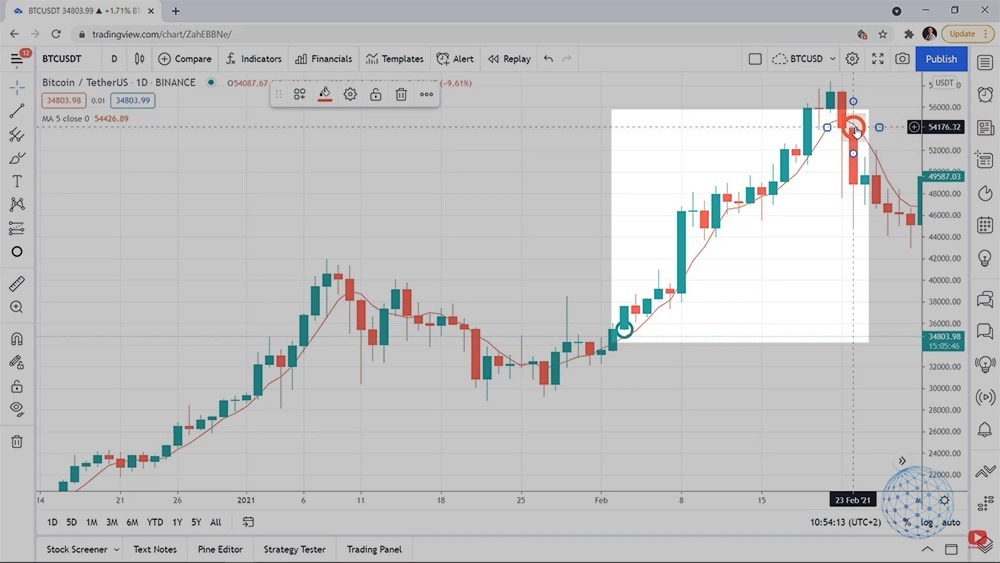
    When we have 2 Moving Averages it’s one of the first methods to build a trading strategy. We can use the cross so when the Slow Moving Average crosses the long one it’s a decent buy entry and then when they cross we can sell but I would prefer to do the following. When they cross I would buy and when the fast or the 5 Moving Average turns downwards I would sell.

    A simple strategy to buy when the 5 MA cross the 50 MA and sell when the 5MA turns down
    Example of buying when the 5 MA cross the 50 MA and selling when the 5MA turns down

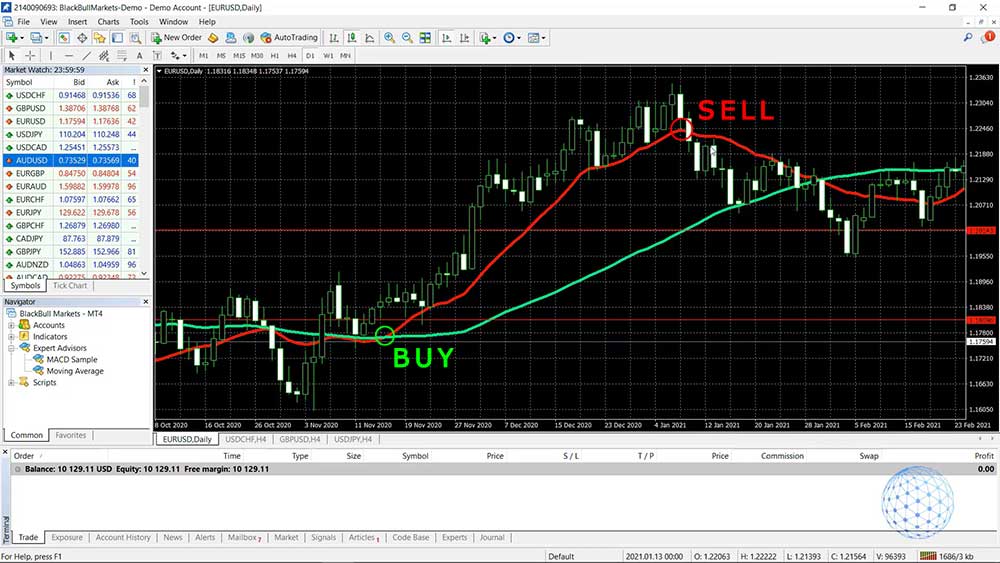
    So for example with this one, it would be an entry at about 1.1858 and it would be an exit at 1.2213. But one more time that’s not a precise trading strategy, I’m just giving you an example of how the MetaTrader 4 technical indicators could be used and there are a variety of strategies. So when we have two or more indicators over the chart we eliminate the false entries and we build trading strategies.

    Using indicators in EA Studio

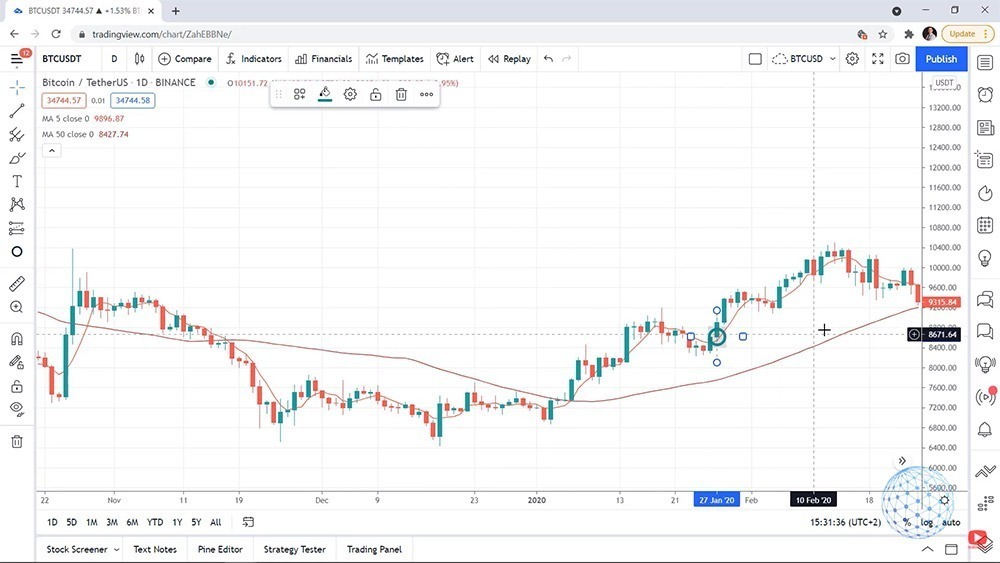
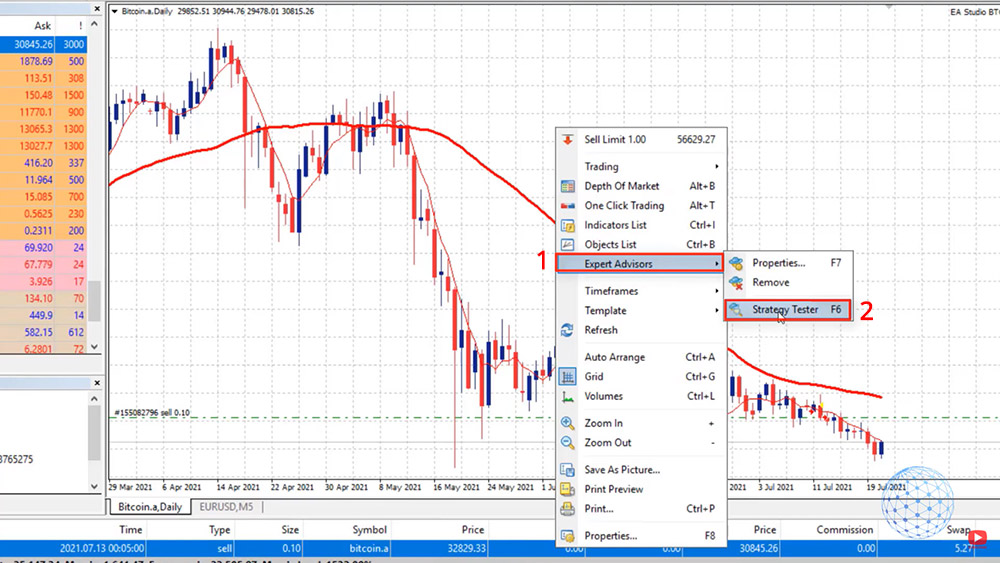
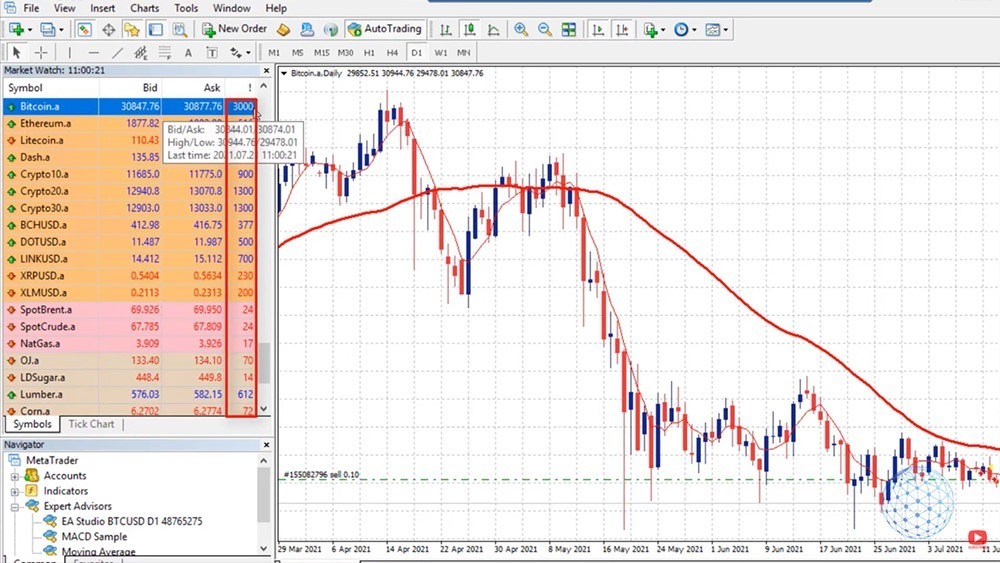
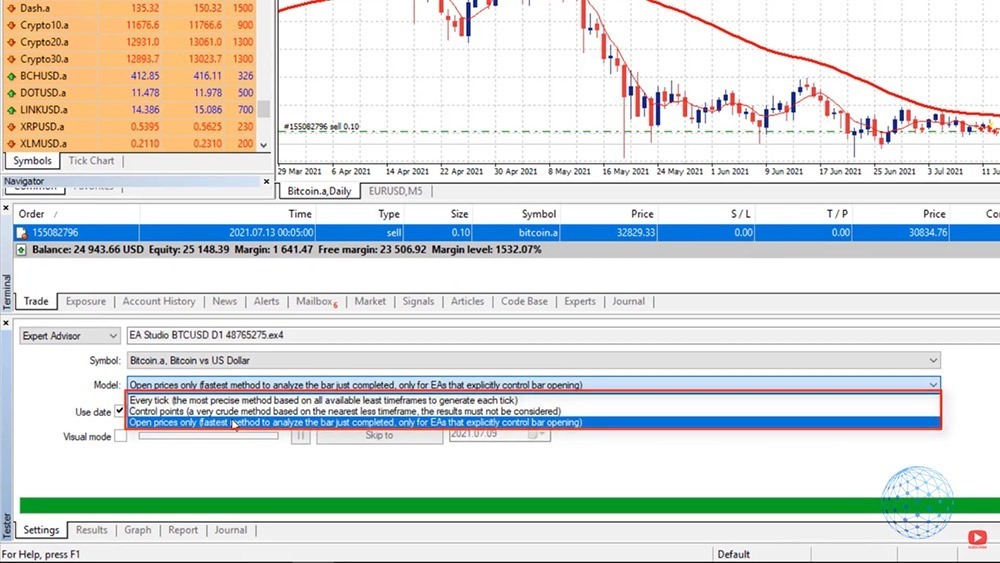
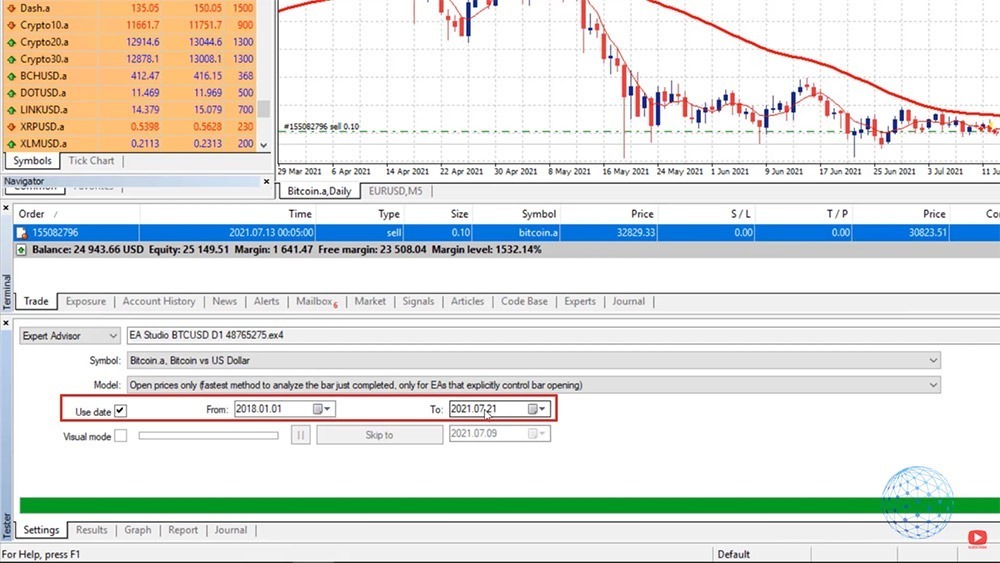
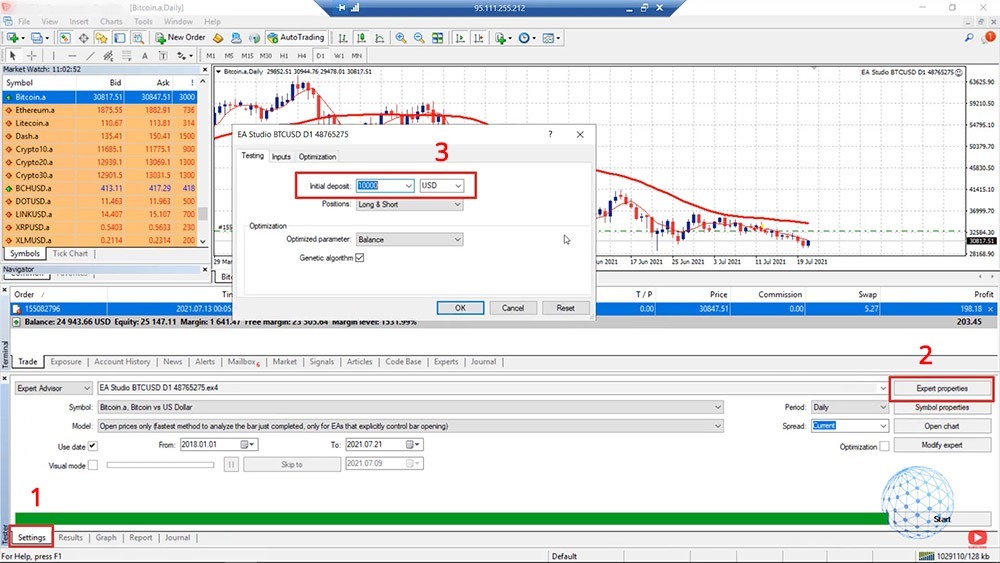
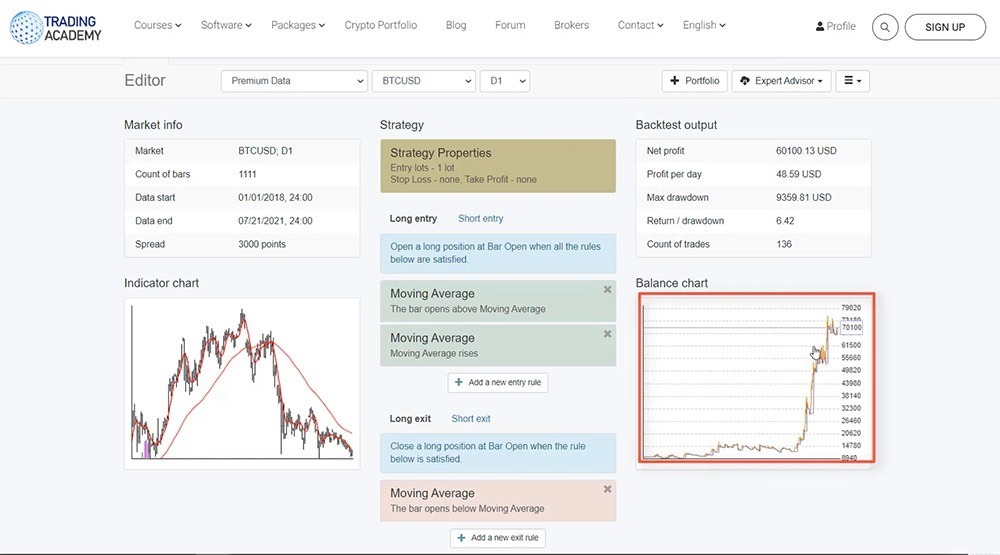
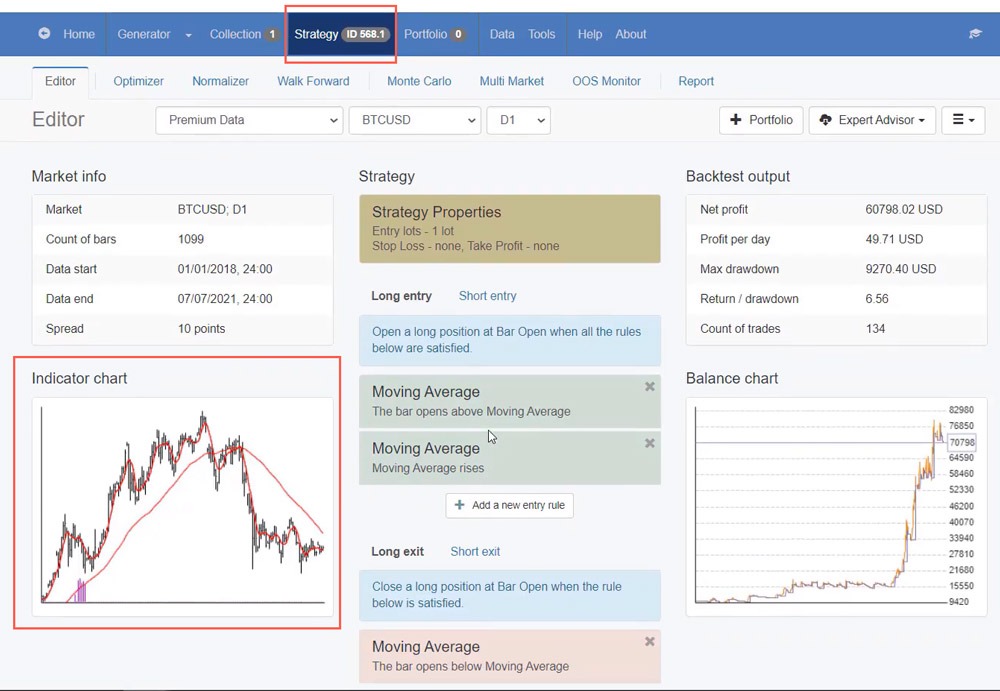
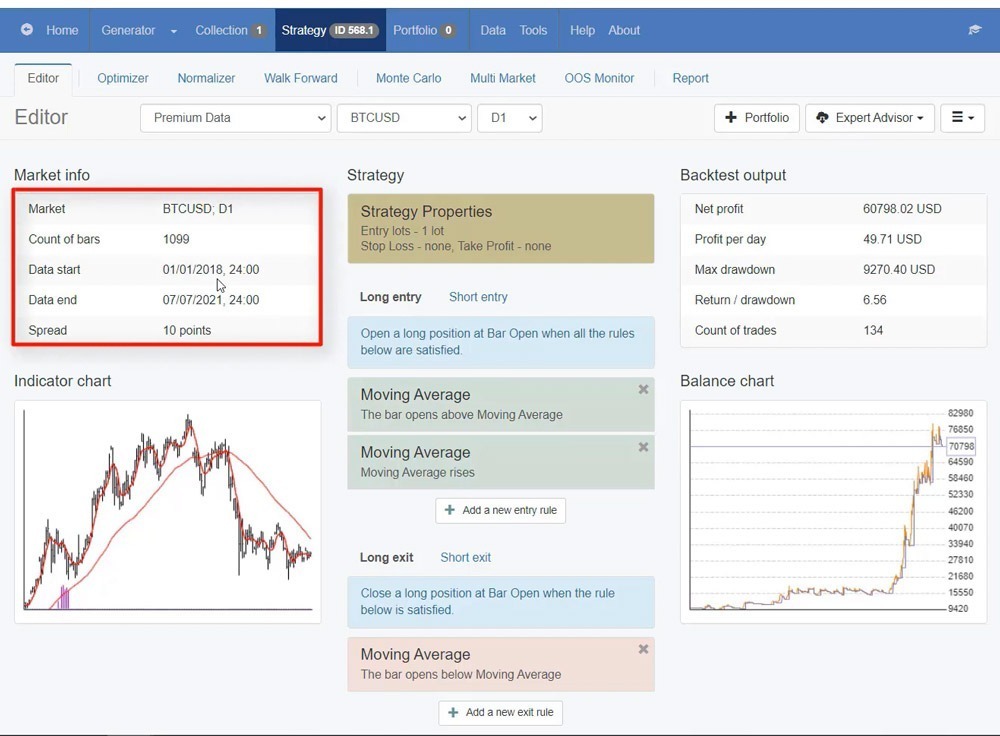
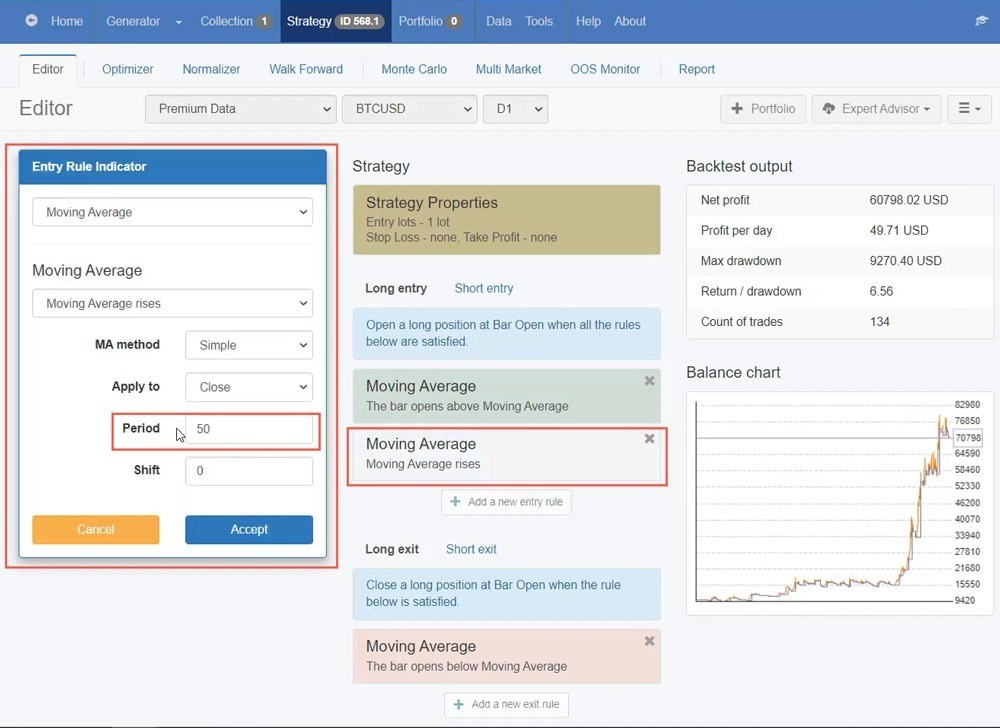
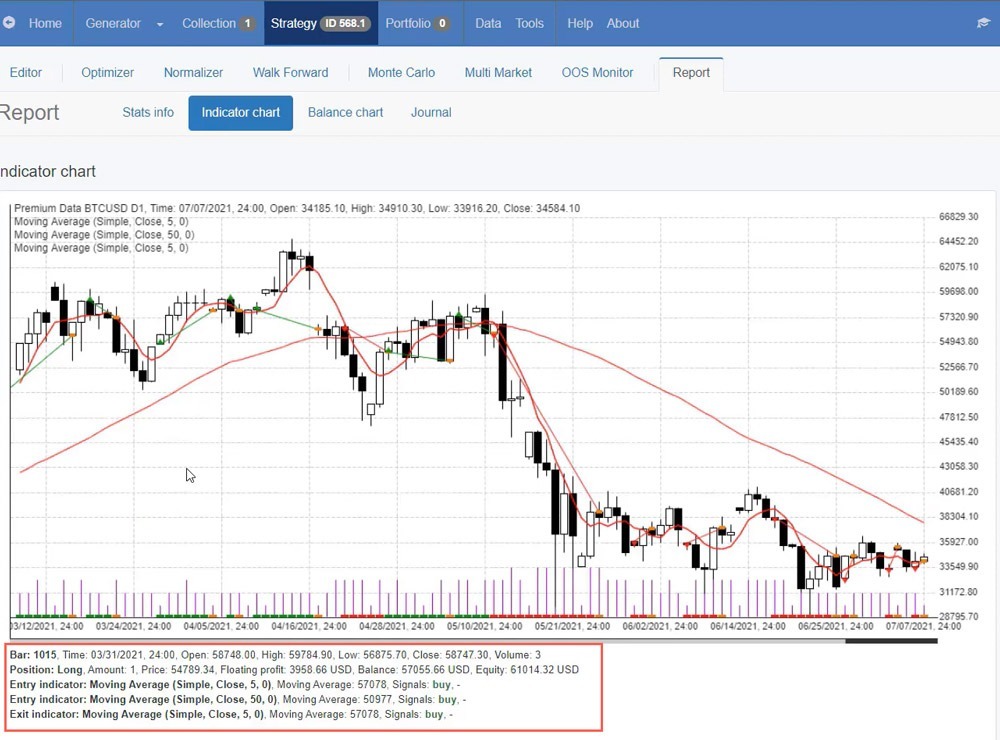
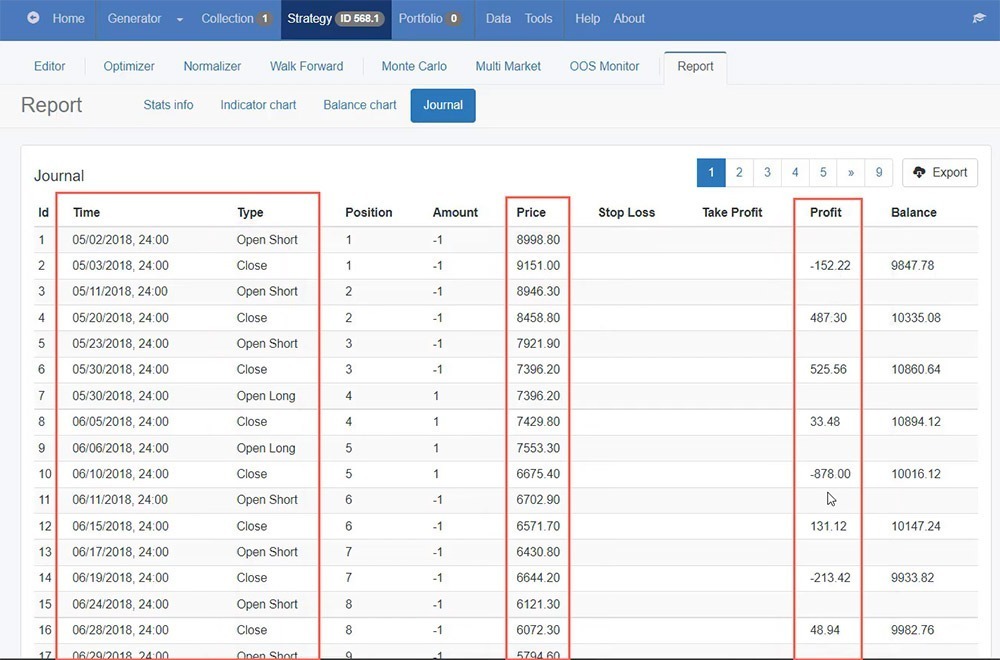
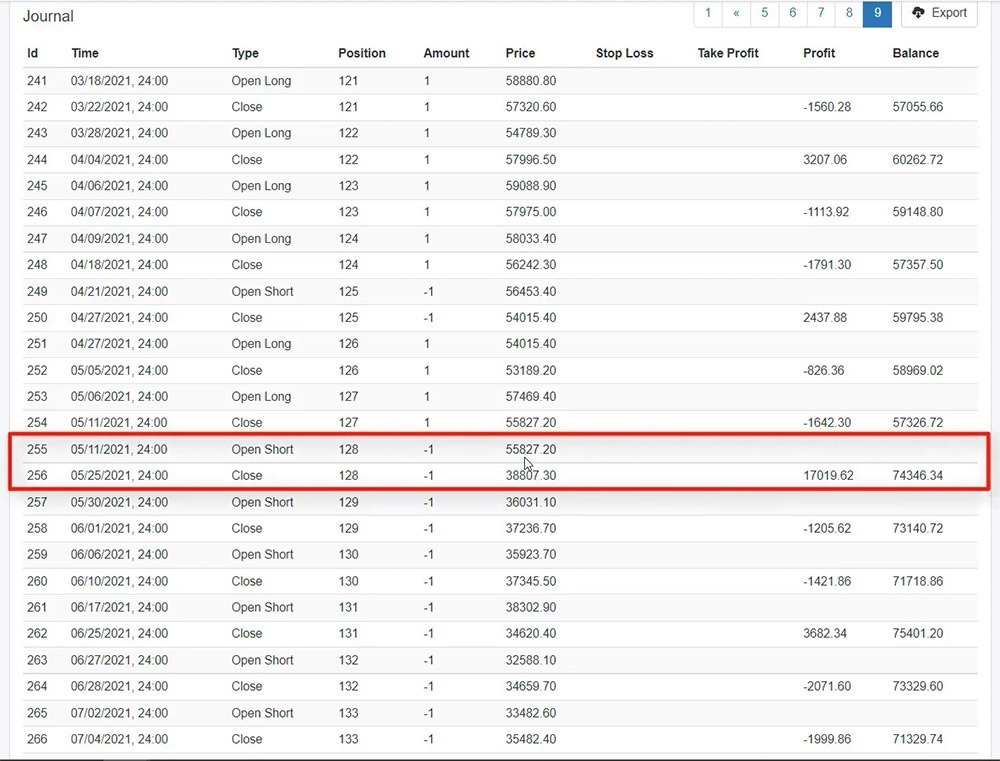
    In upcoming lectures, I will be talking about building a strategy, how we know exactly where the entries are and where are the exits. I personally use a professional strategy builder called Expert Advisor Studio and you can find it on our website. You can test it and build strategies during the free 15 days trial which is super useful. So in EA Studio, I have the 5 Moving Average and you can see the 50.

    The Moving Average indicators in EA Studio

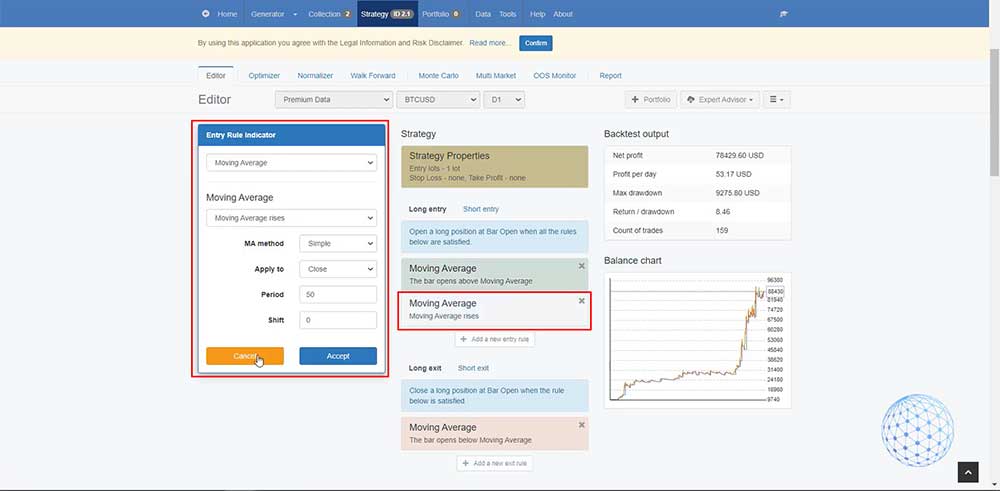
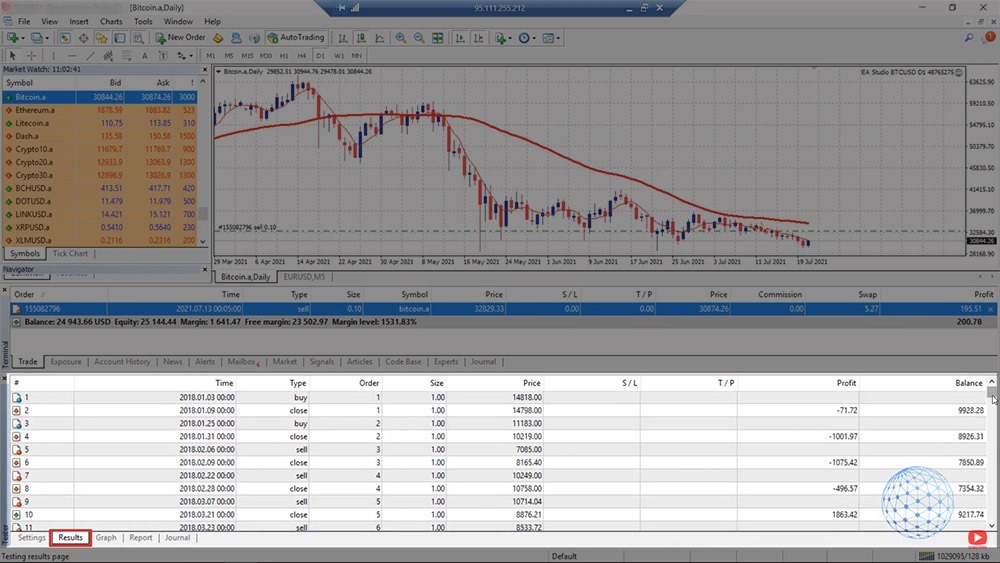
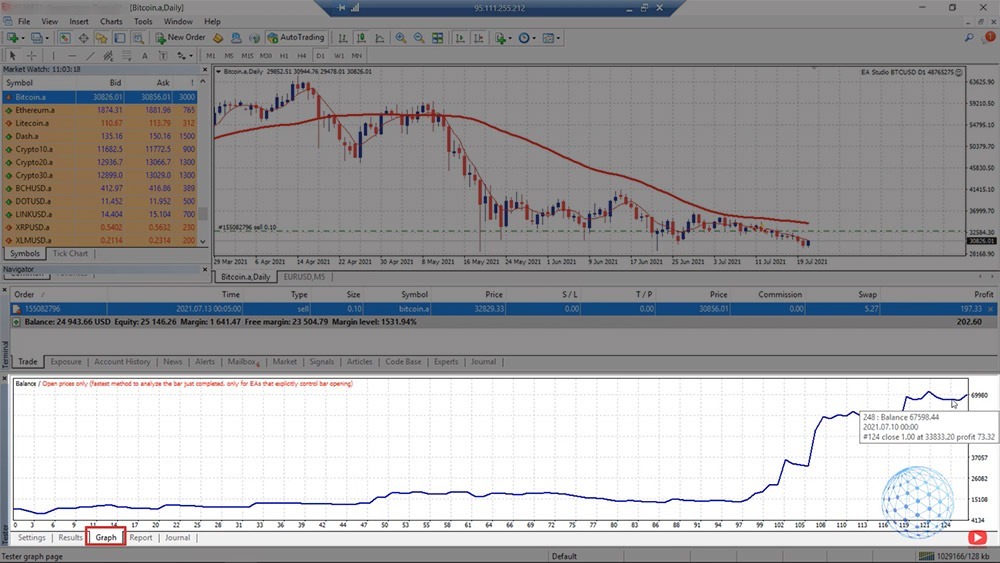
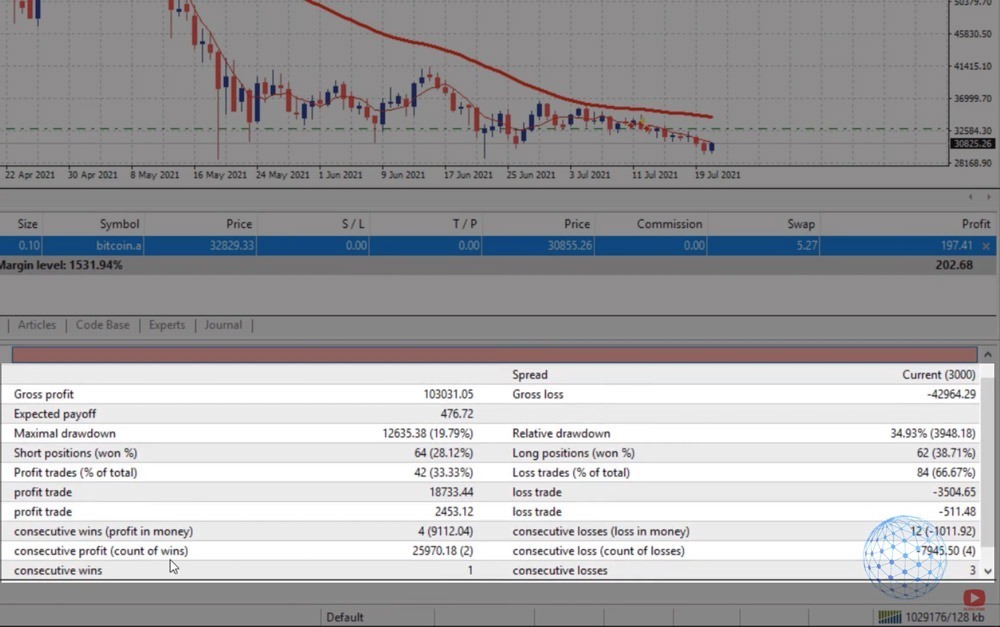
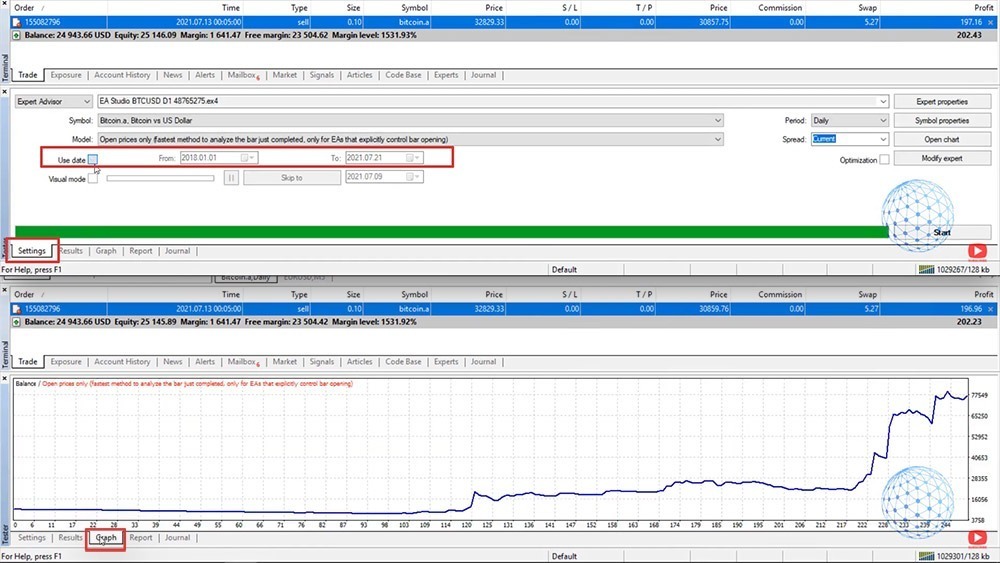
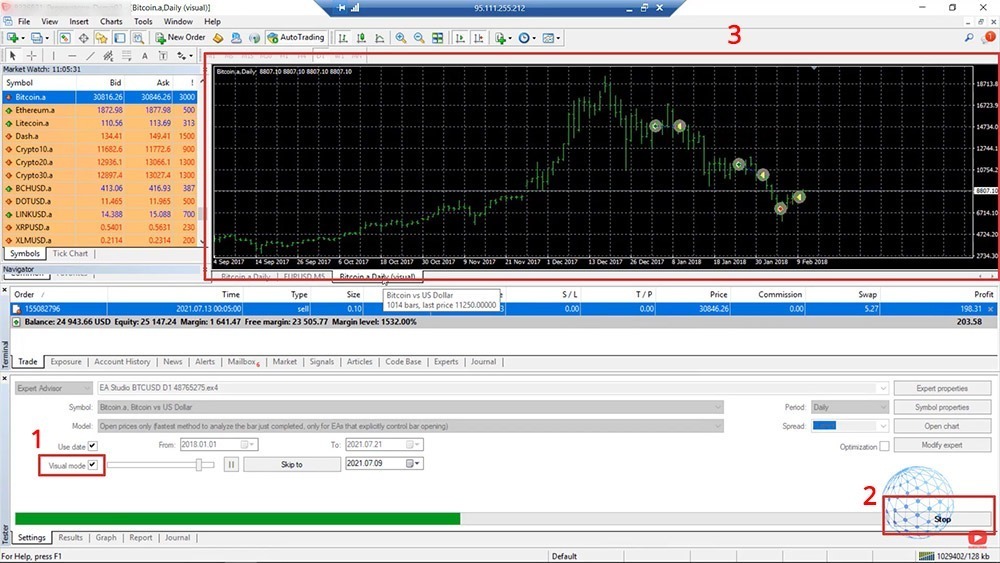
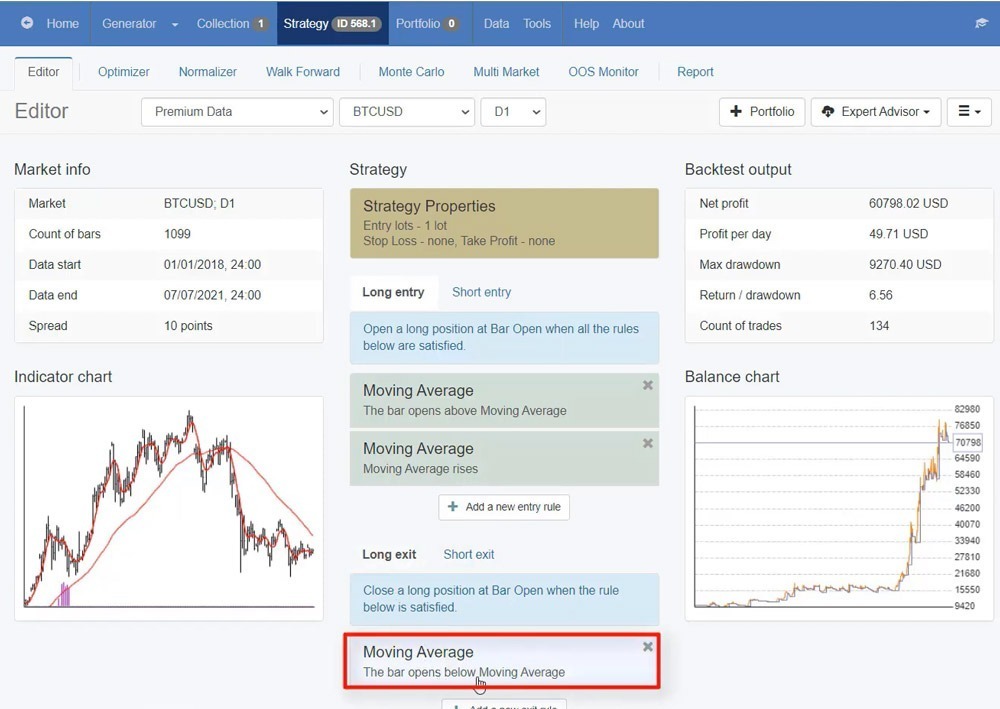
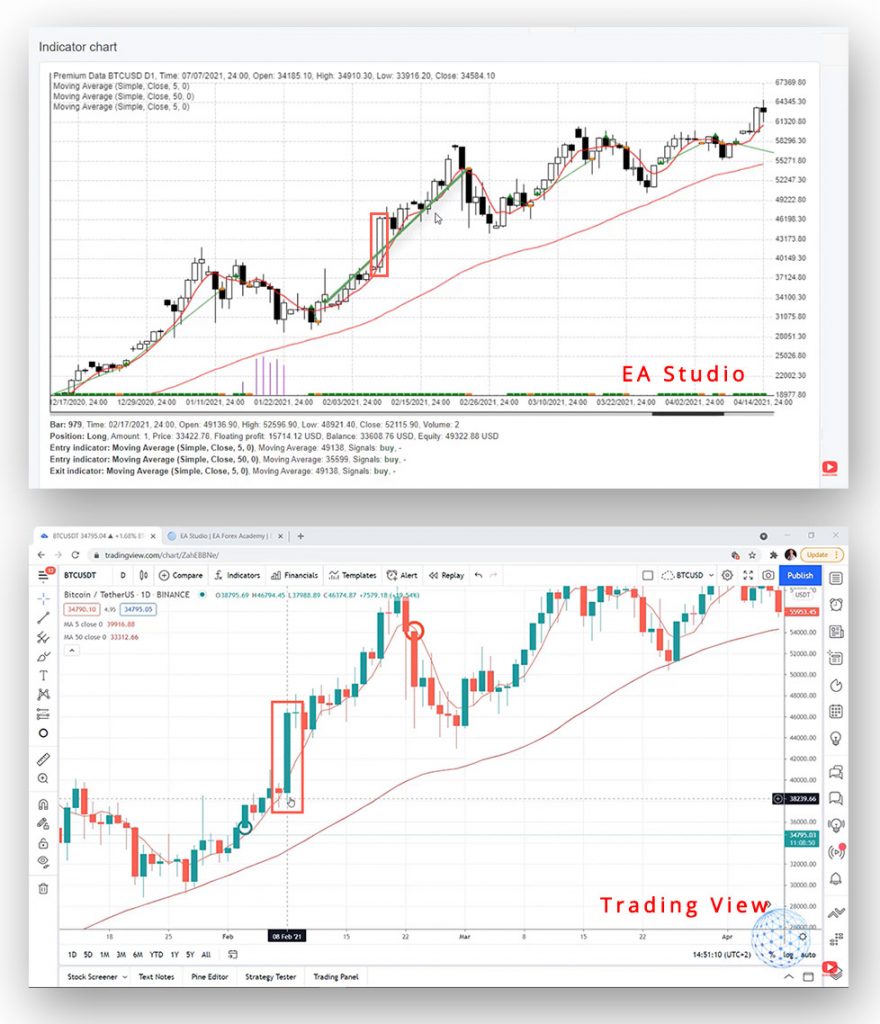
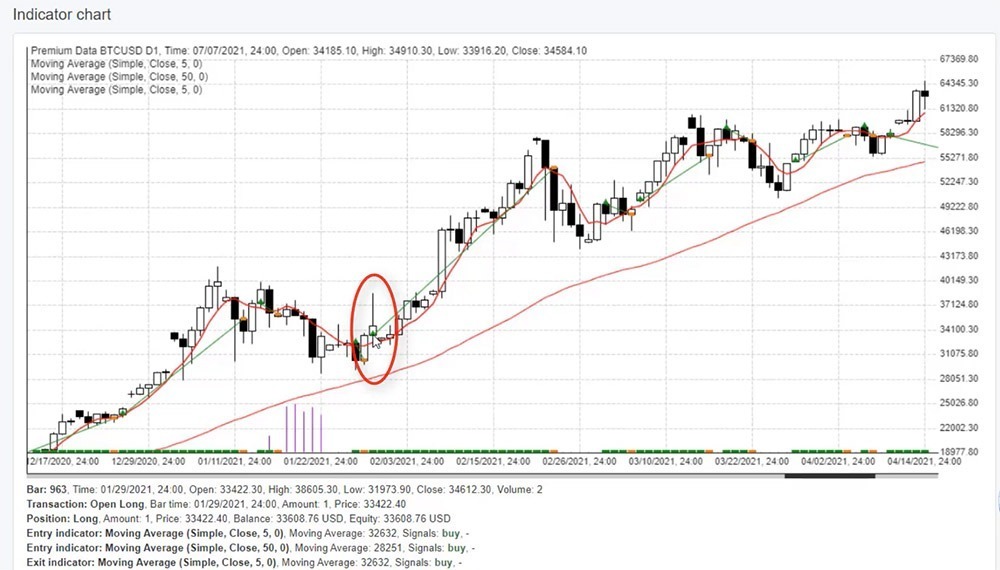
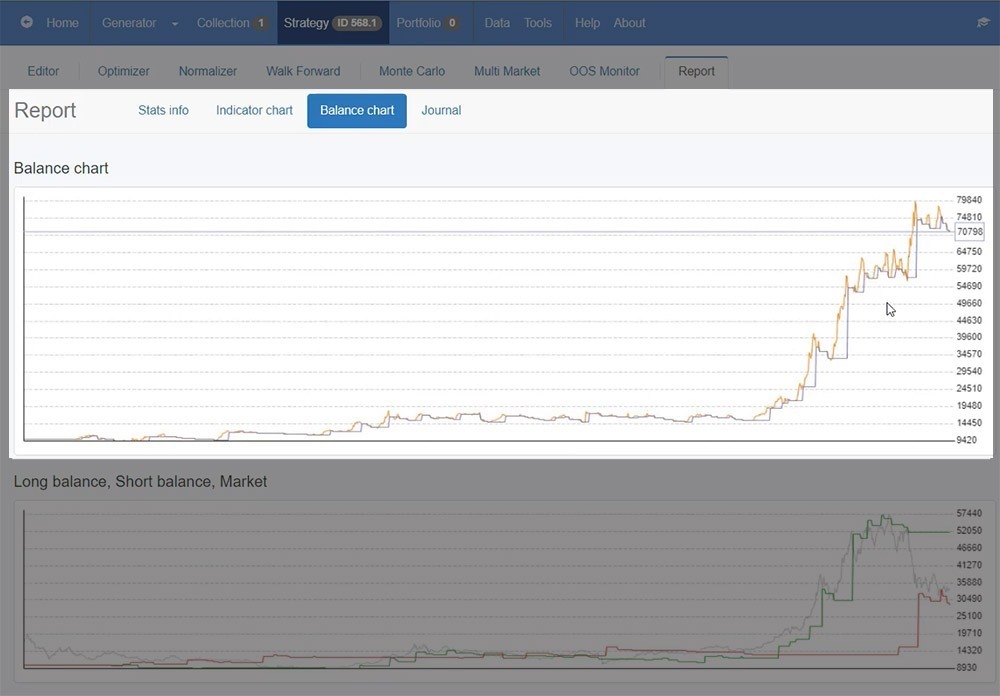
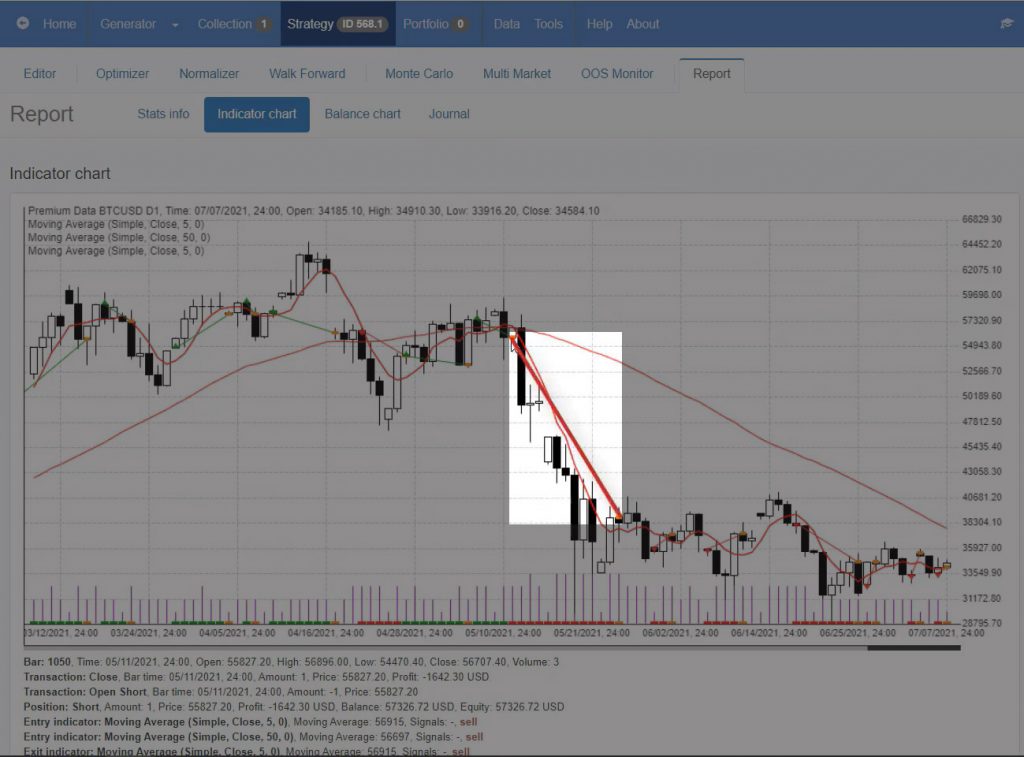
    This strategy applies to Bitcoin and you can see the backtest so we can see clearly what is the performance, we can see clearly all of the trades that open and closed. This saves a lot of time because we can build the strategies and we can even automate it as an Expert Advisor and trade it automatically on MetaTrader 4 but without that, I wouldn’t know what are the right parameters for the strategy.

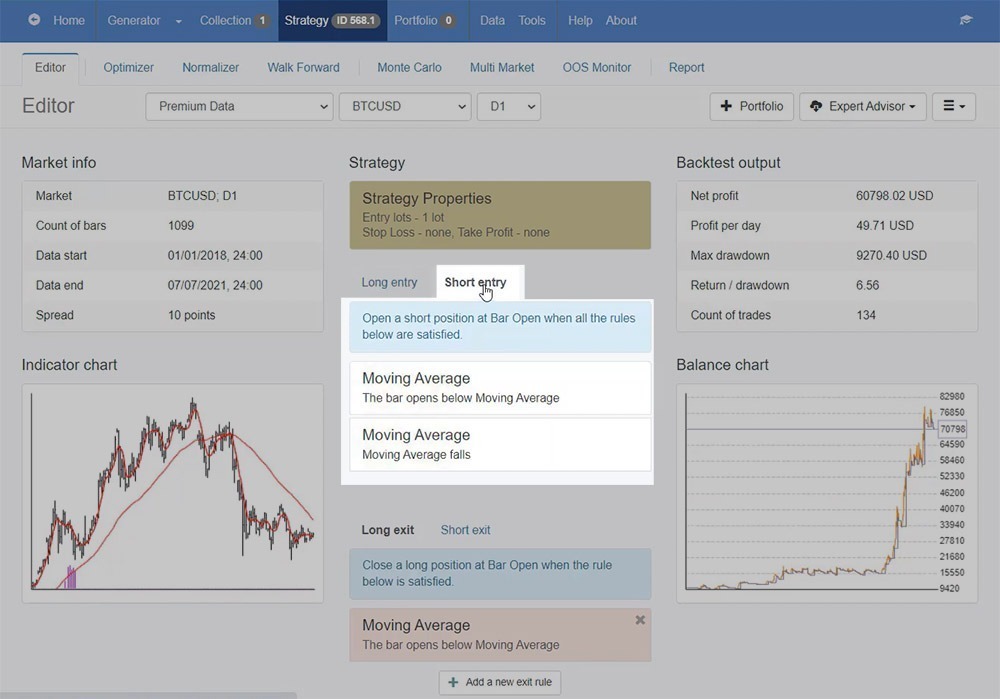
    If I switch for example to EURUSD, you will see that this strategy doesn’t really work that well, it’s just going up and down and up and down, not as good as with Bitcoin. So again I wouldn’t know that without a strategy builder.

    How to install indicators on MT4 chart

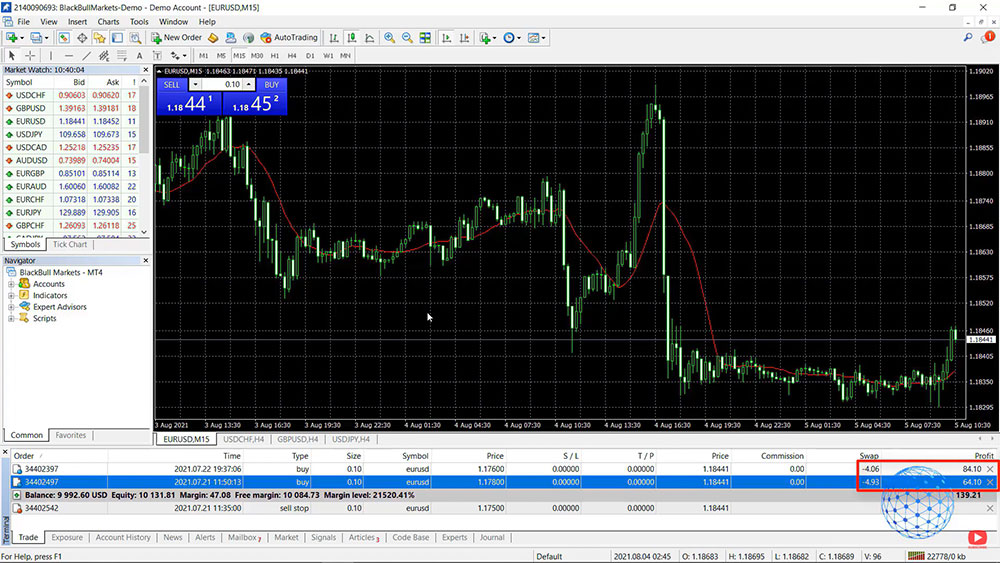
    Now, I will show you how to install MetaTrader 4 indicators over the chart. I will give you some tips when using indicators. In front of me, I have the MetaTrader 4 installed using the BlackBull Markets which is a regulated broker from our trusted Broker’s page, so if you’re ready because I am. Let’s go for it.

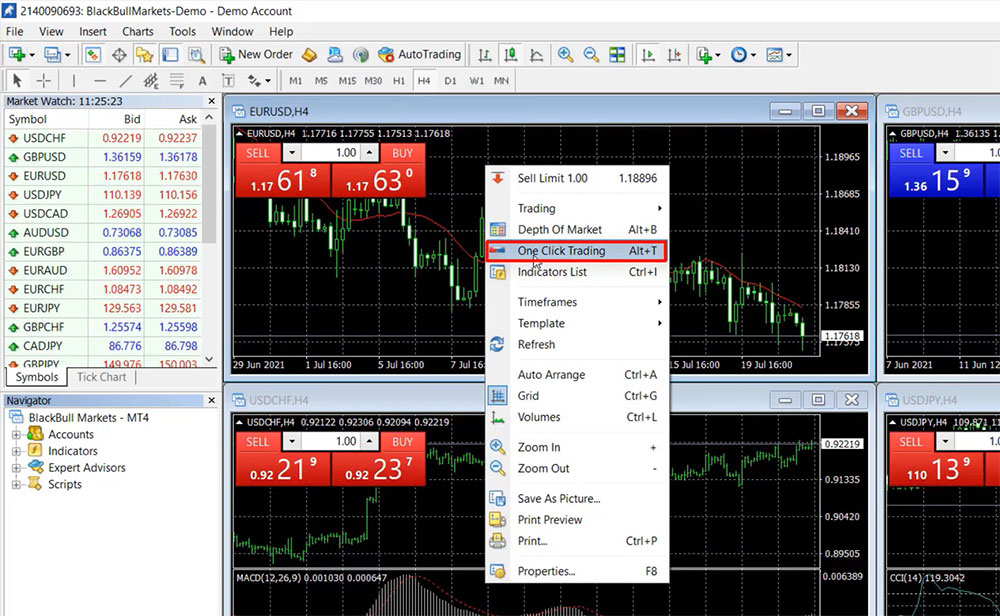
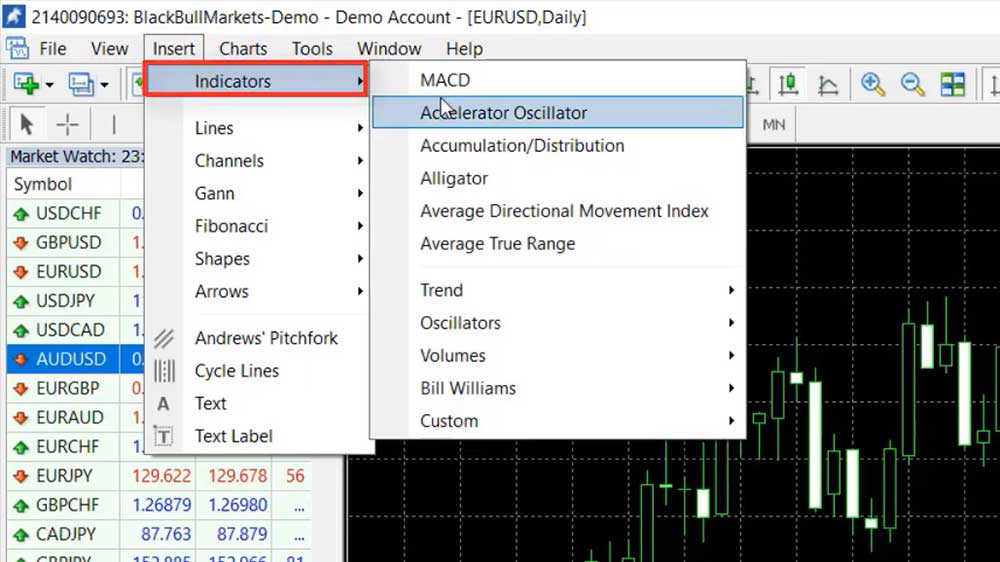
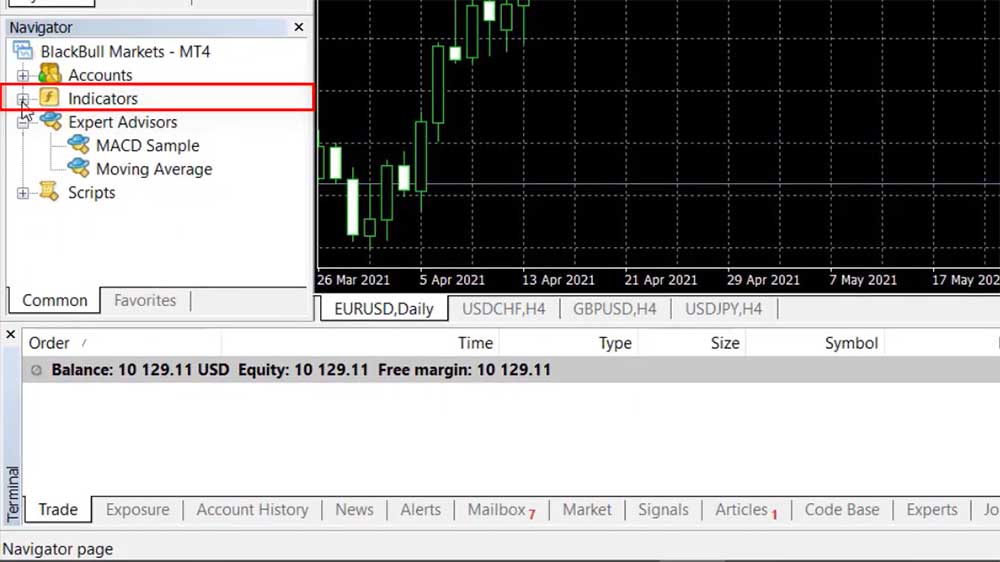
    So, the MetaTrader indicators are available in two places on the platform. One is you can insert them from the top menu, just on the first pop are the Indicators and we have a few that are probably the most common for the Broker, and then we have the Trend Indicators, the Oscillators, Volumes, Bill Williams, and Custom. With the different brokers, you can notice a small difference but this is the common MetaTrader 4 indicators list.

    It’s super easy to install MetaTrader 4 indicators, all you need to do is click over one. For example, I will select Bollinger Bands, and here comes the menu.

    how to install indicators on mt4
    How to install indicators on MT4

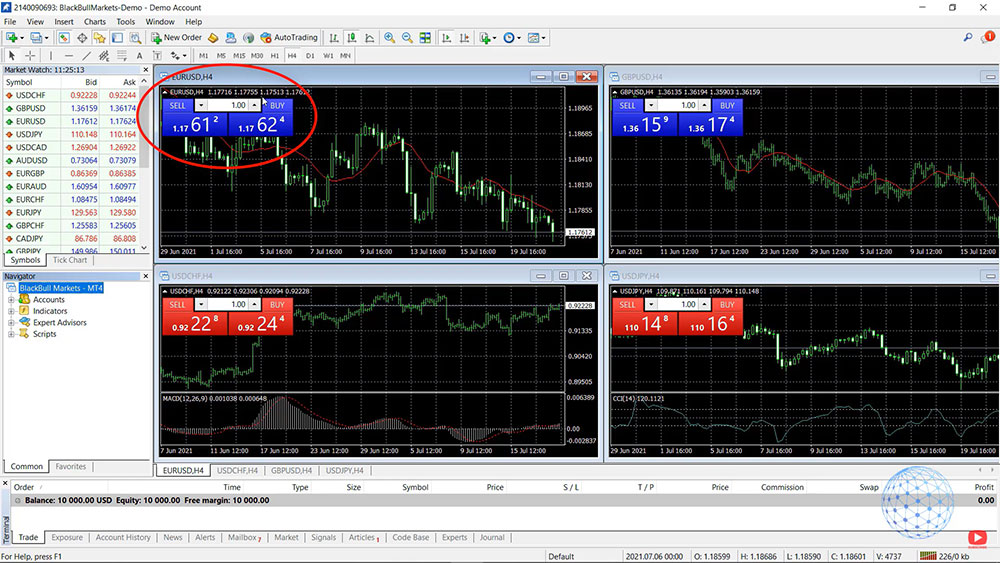
    I will close it for a second and I will show you the second option we have in the Navigator. You will see under the Accounts, we have Indicators and here we have them grouped in the very same way. All you have to do to install the MT4 indicator is to double-click on it or you can drag and drop it over the chart.

    So with the different indicators in MetaTrader 4, we have different inputs and periods, different deviations. It depends on what the indicator is all about and depends if it is a part of your strategy.

    MetaTrader 4 indicators properties

    Now, the Bollinger Bands is one of my favorite indicators, a very useful one and it has two parameters, Period and Deviations.

    How to install Bollinger Bands indicator on the MT4 chart
    How to install Bollinger Bands indicator on the MT4 chart

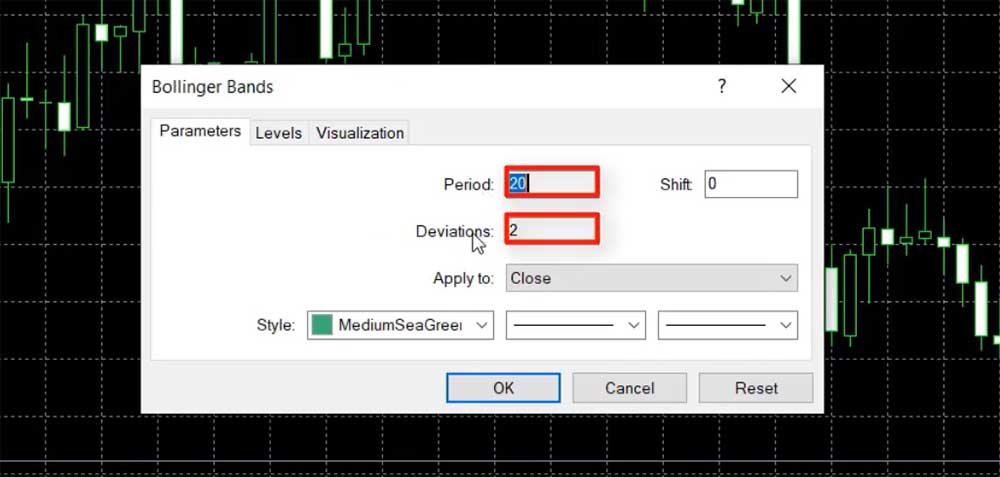
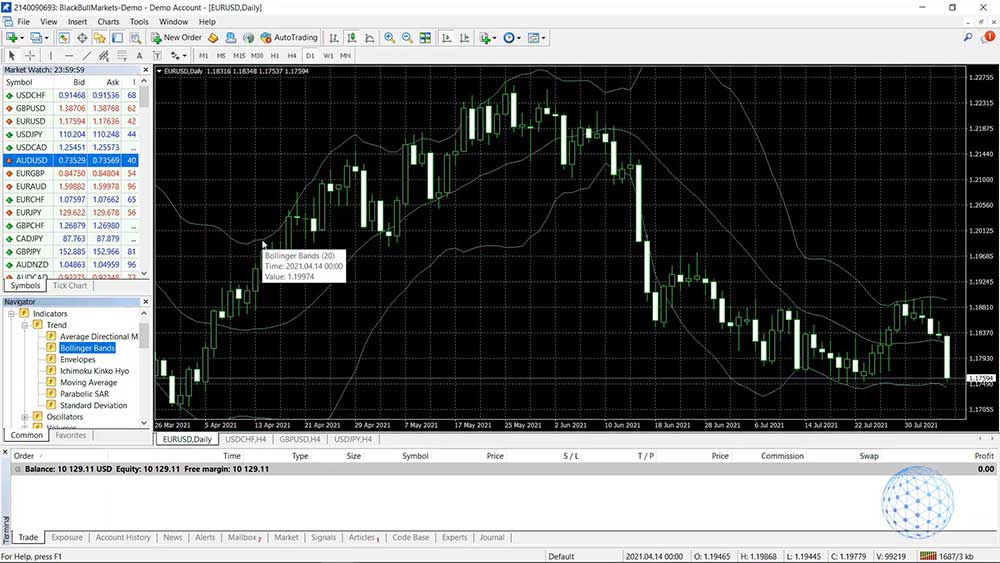
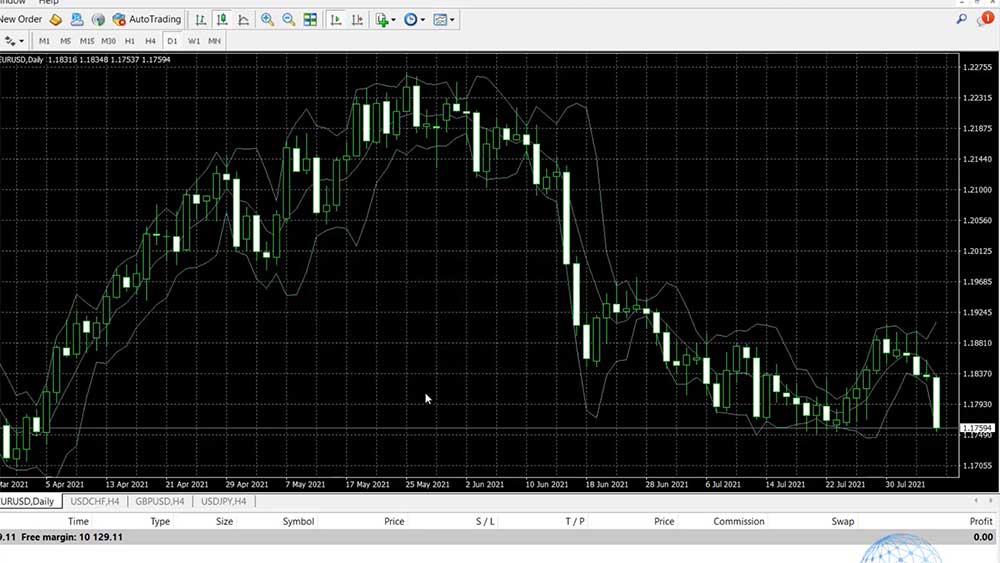
    I will leave it by default and I will click on OK and you will see how it looks like. Basically, we have those Bands that are above and below and we have this kind of Moving Average, going up and down around the price.

    The Bollinger Bands indicator on the MT 4 chart
    The Bollinger Bands indicator on the chart

    So if I click one more time on the Indicator Properties and for example, if I decrease the period, let’s say I will leave it to 5 and I will click on OK, you will see that it gets much closer to the price. The Moving Average is faster so the Bands are getting closer to the price.

    The Moving Average is faster so the Bands are getting closer to the price
    The Moving Average is faster so the Bands are getting closer to the price

    Now, let me change the Deviations, instead of 2, I will increase it to 5 and I will click on OK. So what you have noticed is that the Moving Average didn’t change but just the Bands went further from the price.

    Okay, so, it really depends on the properties and the parameters that you will be using for each MT4 indicator. The visualization over the chart will be different and this depends, again I say, on the strategy that you will be using.

    If I increase the deviation to 0.5, for example, I’ll click on OK, you will see how small the Bollinger Bands become and it’s really just going over the chart. So if I go back to 5, you will see that I can give you a variety of strategies that you can apply but what is interesting about that indicator is that we don’t use much of the Moving Average going through the price but when the price touches the Bands.

    For example, when the market is just going sideways, if the price touches one of the upper Bands, it could be a decent sales signal and when it touches the other Band, we can close the trade and take the profit.

    Bollinger Bands indicator in action
    Bollinger Bands indicator in action

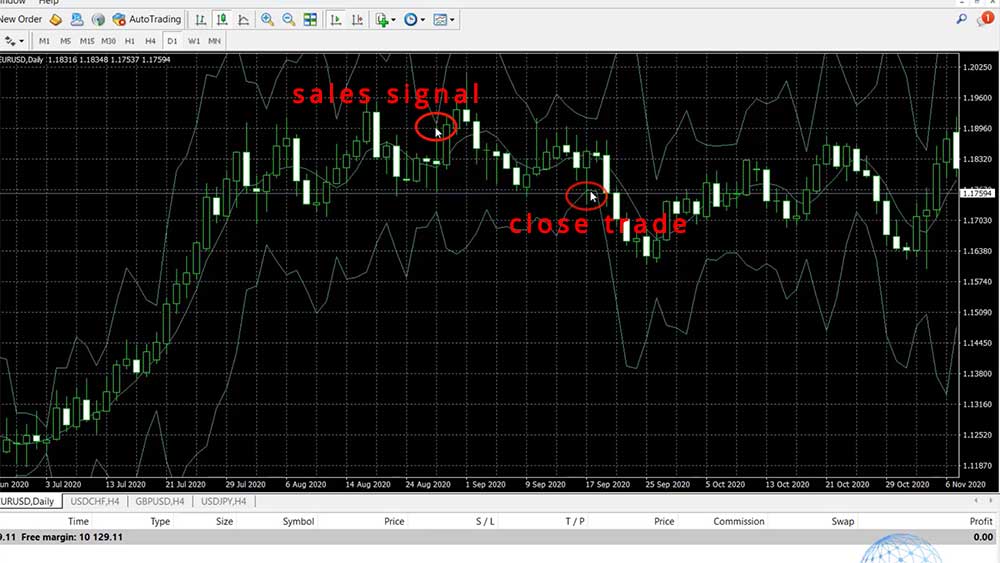
    What you can notice as well is that, when the price is going sideways, the Bands are getting closer to the price and when we have an impulsive move, they open and get away from the price.

    So this is about Bollinger Band which I took as a random example for the purpose of this lecture where I wanted to show you how to install trading indicators over the MT4 chart. Let me remove it and I will add another Indicator called MACD.

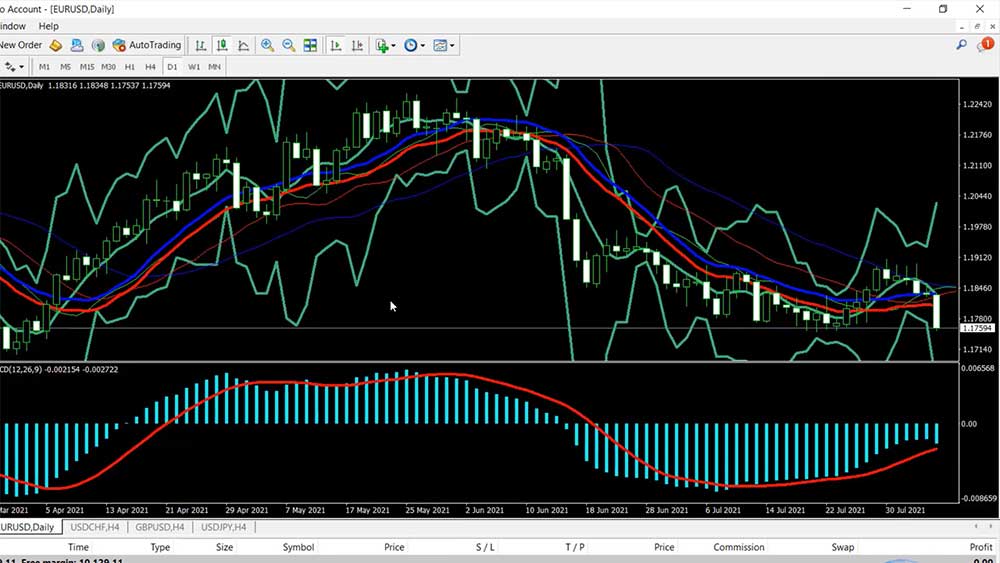
    So, the MACD is again a super popular indicator but what I want to show you is that, when we install it on MetaTrader 4, it displays below the chart. It’s not over the chart like the Moving Averages in the Bollinger Bands, it’s below the chart in a separate box with a histogram.

    MACD indicator is displayed below the MT4 chart
    MACD indicator is displayed below the MT4 chart

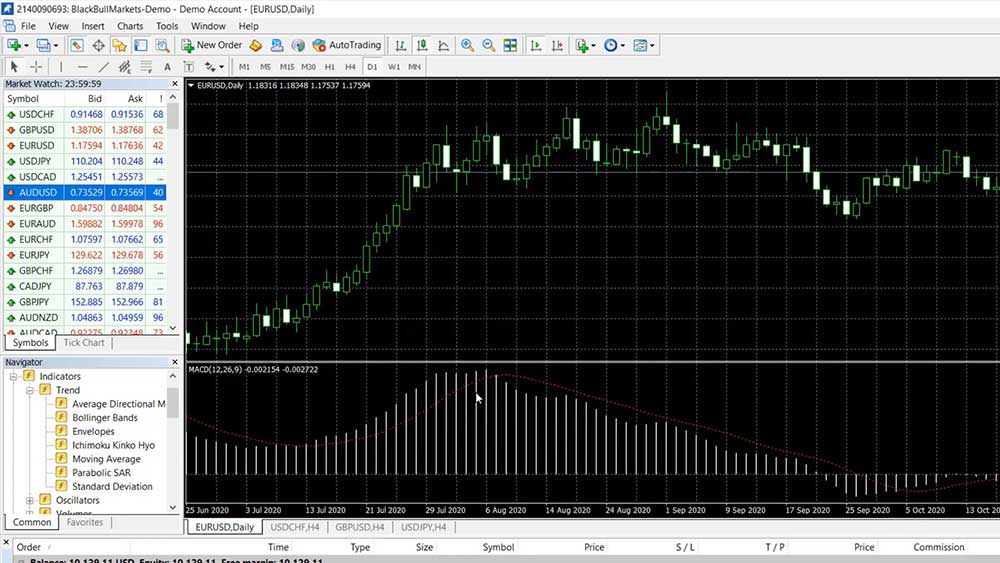
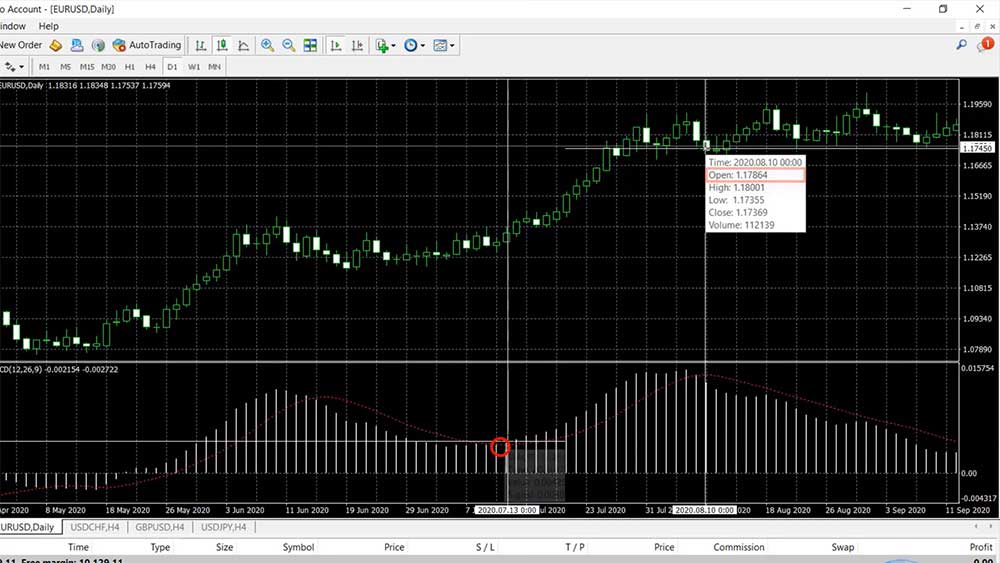
    We have three things here, one is this red signal line that goes up and down, then we have the MACD which on MetaTrader 4 is displayed by bars and if you imagine connecting those bars, you will see that there is a line that crosses the signal line downwards, then it crosses the signal line upwards and it gives signals that way.

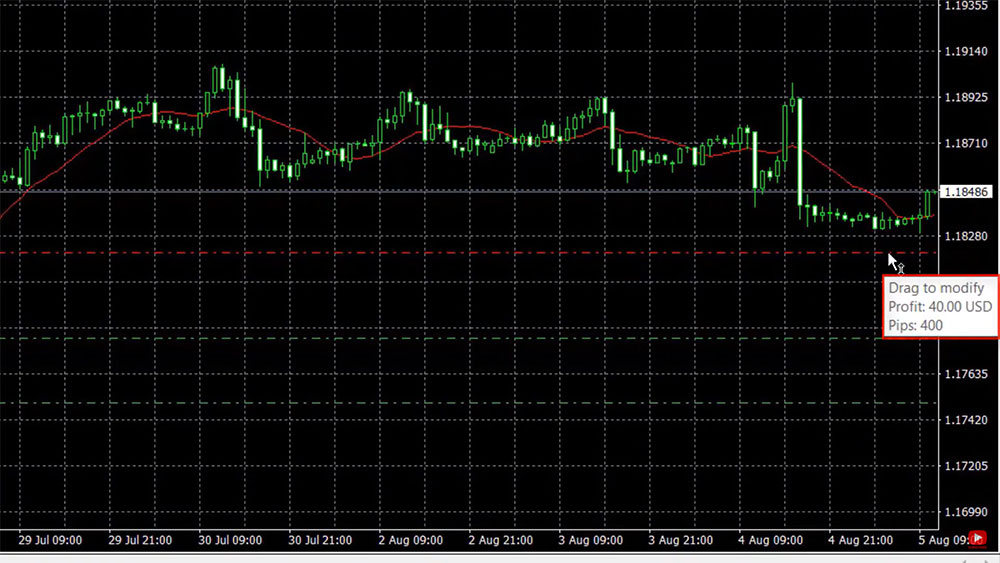
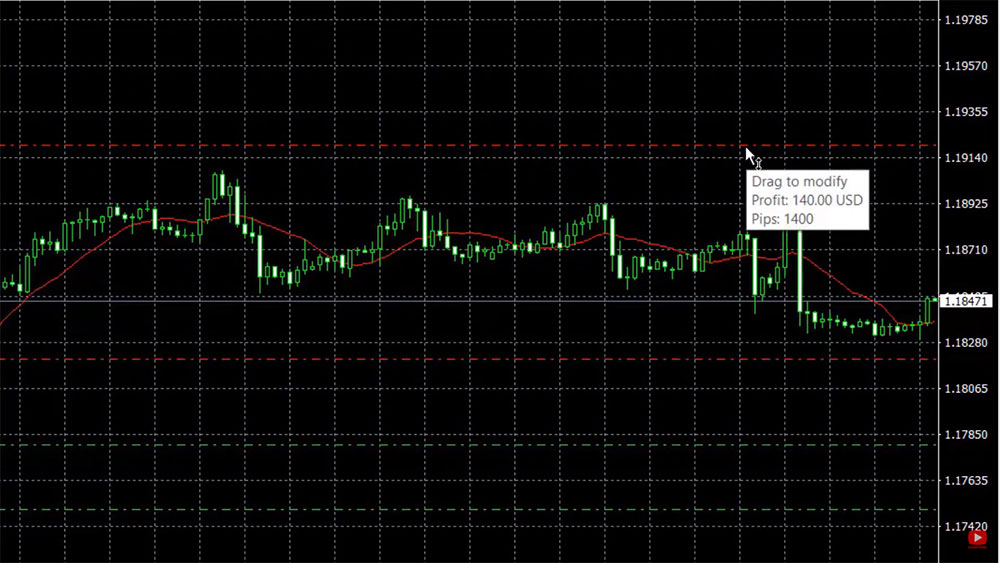
    For example, right over here you, see that the MACD or the bars get above the signal line and they give us a Buy signal right over here. Then when the MACD gets below the signal line, we can close the trade and take profit of over 400 pips in our example.

    The MACD bars movement through the signal line
    MACD bard show the buy and the sell signal

    How to change indicators visualisation

    Now, if you want to make it more visual, you can always modify the indicators. You can do it while you install them on MetaTrader 4 platform or you can do that later from the inputs and then click on OK and you will see the difference.

    So, how to install MetaTrader 4 indicators to see clearly where the crosses are or where the signal is? Well, that is up to you, it’s a personal choice how you will manage the colors over the chart.

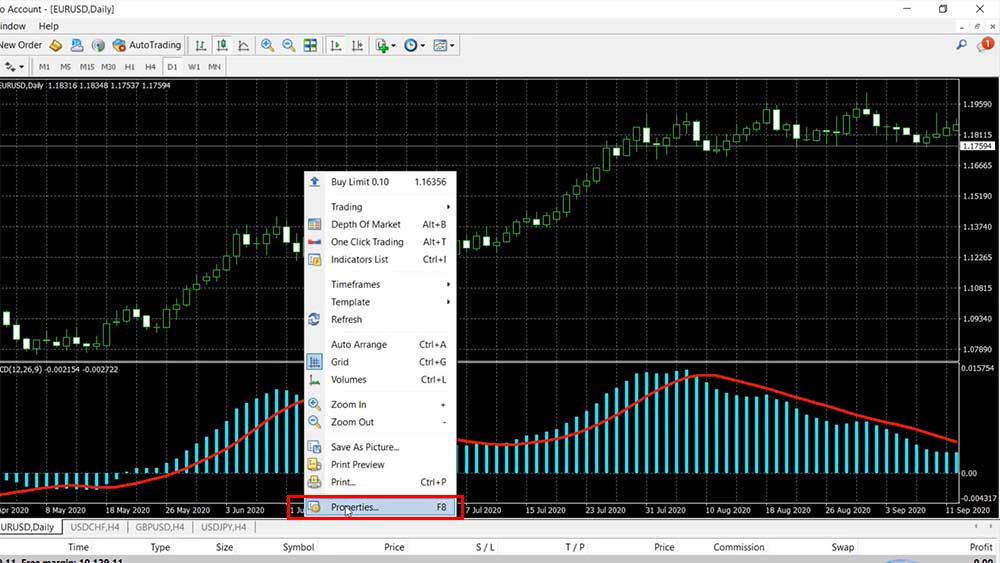
    It’s not only the indicators that you can change. If I right-click and go to Properties, I have the option to change the background, I can change the candlesticks, I can remove the grid from behind. Actually, I like to do that so the chart is clearer and I can put more indicators and I see them better.

    So do not hesitate to change the colors on the indicators to make them more visual when you install them but be careful not to place too many indicators over the MetaTrader 4 charts because if you put too many, you will see so many lines and indicators over the charts and you’ll be basically hiding the price.

    For example, if I put Bollinger Bands and I make them thicker, and then if I insert, let’s say, the Alligator because it has a lot of lines and I want to show it to you, and then if I put, for example, the Envelopes and again I make it thicker and I change the color, for example, to red and if I keep doing that, and if I click on Colors and I change the thickness and I click on OK, you will see more lines over the chart.

    the many lines and indicators over the MetaTrader 4 chart are hiding the price
    If you put too many indicators on the MT4 chart you may hide the price

    A lot of traders do the mistake to overload their charts with so many indicators and at the end of the day, don’t see the price and from my trading experience, I can tell you that the price is what matters the most.

    So when I’m building strategies for Forex trading, I try to keep the rule for 2 entry indicators that confirm each other and 1 exit indicator. No more. Sometimes, I go to 3 and maximum 4 entry Indicators and maximum 2 exit Indicators, but with the time I saw that 2 entry indicators or 2 indicators that confirm each other for me to open a trade and 1 indicator to use as a take profit or as a point where I’m closing the trade work best for me.

    So don’t install too many indicators on MetaTrader 4 because it will be harder for you to follow. You can read a lot about all the indicators out there, you will find so many strategies over the internet, so if you want to put them all in one chart probably, you will mess up. Just a few Indicators for a strategy works best and don’t make it too complicated.

    Conclusion

    So, this is how you can install and use trading indicators on MetaTrader 4 platform. Remember to make it simple, not complicated, it will be easier for you to trade with a few indicators on the chart. If you have any questions about how to install MetaTrader 4 indicators let me know in the comments below. I’ll be super happy to answer you.

  • Difference between Demo and Real Account

    Difference between Demo and Real Account

    In this lecture, I will share with you what is the difference between a demo and a real trading account and as well I will show you how you should test properly your trading platform or your broker so you won’t make the mistake to go for a broker that offers one demo trading and totally different live trading and leaves the clients and the traders frustrated.

    So why is so difficult to switch from demo to live trading? It’s the same thing, right? This is what the brokers say, “Open a demo account, practice some time, find your strategy, open a real live account and you will be making profits”. Well, fortunately, that’s not the case, and most of the people switching from demo to live account lose their money and in this lecture, I will tell you why and I will share with you what you need to do to make it the right way.

    Compare Open, High, Low, and Close prices

    So first things first, I always suggest my students, YouTube subscribers, and everyone reading my lectures or watching my videos to start on a demo account. This is where you cannot lose money. You don’t put any money into your account, into your crypto wallet, into your broker’s account, so there is nothing really to lose. All you have to do is practice trading until you get confident and you are satisfied with the results from the strategy or the robots that you are using, and then you can switch to Live Trading.

    But switching to live trading it’s not easy and this is why. Demo vs live trading could be really equal if your broker offers the very same prices on the chart. For example, in front of me, I have the MetaTrader 4 platform with a broker and here we have all of those candlesticks which form the historical data on the chart and we can see actually where the price was at any moment.

    However, some brokers offer different data on the demo account and different data on the live account and you can see that. So the first thing you need to do is when you open the demo account, pick a bar that is very different from the others so it’s easy to recognize. For example, right now, I’m on an hourly chart in EURUSD and I have this huge bar. If I put the mouse on the closing of the bar, right, I can see the Open, the High, the Low, and the Close prices. These 4 values are very accurate.

    Compare Open, High, Low, and Close prices
    Compare Open, High, Low, and Close prices

    Now do the same thing on your live account. Open the same chart on the same time frame, put the mouse over it and see if your live account matches your demo account. See if the bars have the same value.

    Open trade on your demo and your live account

    Now, if you’re going for manual trading, the second thing you can do is to open one trade at the very same moment on your demo and your live account. Open a very small position, a tiny fraction of your capital. For example, buy EURUSD at whatever price it is with 0.01 of a lot and open the same position on your live account and then put a Stop Loss and Take Profit for those positions and see if the broker will execute them exactly, just leave the trade going.

    For example, 20 Pips away nothing really to be bothered about, but just see where exactly your trades were opened and if the broker has done a precise Stop Loss of your position on the demo and on the live account.

    Test demo and live account with a robot

    Now the third thing you can do is to test your broker if you’re struggling with demo vs live trading with a robot. Okay, place a Robot on a demo account and place a robot on a live account, again with a very small fraction of your capital 0.01 of a trading lot and leave it trading for a few days. This way you will see if the trades are opening and closing precisely and exactly the same on your demo and your live account.

    And if you have no robots don’t worry. Just leave your email below and you can download a free Forex robot just for testing purposes so you can test exactly your broker if it offers the same conditions on demo and live account, just go ahead, download it, and test with a very small fraction of your capital.

    * indicates required

    And this is super important, guys, you have to test your broker for demo and live trading. You have to do that, anyway, it’s useless to test any strategies robots on a virtual account if your broker doesn’t offer the same conditions. It’s just like preparing yourself for a marathon and you’re running on a stadium for a few months but then the actual marathon is through the mountains. It’s the very same thing. You have to make sure that the broker offers the same trading conditions on demo and live trading account. Anyway, it’s absolutely useless to do anything on the demo account.

    Okay, again the best thing for me is to go test with a robot and see if the broker will open the very same trades in the demo and the live account. So, go grab your robots in the description below, those are robots, just for testing purposes of your broker demo vs live trading, so you can see if your broker has the same conditions, of course, you can always backtest those robots and if you find them useful for your broker, you can go and use them.

    If you want to know more tricks about testing demo and live accounts, trading robots, and all the problems we have with the brokers, check out our trading courses. I really thank you for staying with me until the end and I wish you safe trading.

  • How to Set Stop Loss in MetaTrader 4

    How to Set Stop Loss in MetaTrader 4

    Today I will explain what are Stop Loss and Take Profit in Forex trading, and how to set them in the MetaTrader 4 platform. Stay with me until the end of the lecture to see how useful it is to use Stop-Loss and Take Profit when you are trading. I will explain it in very simple words I will show it to you over the charts so no matter if you’re using MetaTrader 4 or any other platform you will feel comfortable with the Stop Loss and Take Profit.

    What is Stop Loss and Take Profit

    For the purpose of this lecture, I have decided to use BlackBull Markets which is a regulated broker from our trusted brokers’ section. Always make sure to use trusted brokers and from BlackBull Markets you can download the MetaTrader 4 platform which I have just in front of me.

    So in a previous lecture, I have explained how you can place a trade on MetaTrader 4. I show the different types of orders and I have left two orders, Buy Limit and Buy Stop, and they were both executed and you can see that these are open trades that brought me a profit of $64 at $84 until the moment, but these two don’t have a Stop Loss and a Take Profit.

    the proftiable traders from previous lecture
    The Buy Limit and Buy Stop traders from the last lecture brought me a profit

    So if I zoom out the chart for example to the Hourly chart you will see where the trades are. You can see that the price went up in my favor and I’m already on a profit.

    Now we have two options here – the first is to close the trade manually. If I press the X button the trade will close and I will have profit into my Account History.

    Closing the trade manually
    Closing the trade manually

    You can see it on the image below – the trade was opened at the price of one 1.1760 and I just closed it manually at 1.1844 so I have a profit of $84.20.

    Account History

    For the other trade that opened, I might want to use a Stop Loss or a Take Profit. It depends on what your strategy is but the Stop Loss and the Take Profit allow me to set levels at which the trade will close automatically so I don’t need to stay in front of the computer or the screen to close the trade manually.

    For example, I might have 1 level let’s say at 1.1890. I’m just giving a random example but we see on the image below that the price already reached 1.80 a few times, which obviously means that this level or this zone right here is an important resistance level. The buyers are getting weaker and the sellers are getting stronger at this zone, so you might want to decide that if the price reaches again 1.890 you want to take the profit or you want to close the trade automatically so we will collect this profit.

    The resistance level
    The resistance level

    I will make the Take Profit level green, and on the other hand, you might want to put a Stop Loss at a level where you will be happy closing the trade or a level lower than the current market price. I will make it red because it is a Stop Loss.

    How to set Take Profit and Stop Loss in MetaTrader 4

    If I put this level at 1.1765 for example, which is below my entry price of 1.1780, I will have a loss of 15 pips. If the price drops down below this level I will have a loss. Now if I want to have a Stop Loss at 1.1820 for example, the trade will still close but I will close on a profit because my entry price is 1.1780 so I will have a profit of $40 if the price drops down to this level and the trade is closed automatically.

    Alright, so this is the idea to set Take Profit and Stop Loss in MetaTrader 4 – to have automatic levels at which we want to close the trade even if we are not in front of the computer. When the price reaches one of the two levels, the trade will close.

    How to set Stop Loss in MetaTrader 4

    So the question now is how to set Stop Loss in MetaTrader 4 if you have an open position. In the terminal, you see Stop Loss and Take Profit set to 0.

    Stop Loss and Take Profit are set to 0

    What I will do is to right-click over the trade in the terminal and I will go to Modify or Delete Order. No worries, you won’t delete the order just click on that and you will see the boxes.

    Modify or Delete Order
    Modify or Delete Order

    Here you can use the arrows to increase it but obviously, it will take you ages to reach 1.18 or something so what you can do is just mark it and then type the value, for example, 1.1820. And if I click on Modify you will see that my Stop Loss is set.

    Setting a Stop Loss in MetaTrader 4
    Setting a Stop Loss in MetaTrader 4

    Now here I have this horizontal line which I will remove, so you can see clearly where the Stop Loss is.

    the red dashed line is the Stop Loss level
    The red dashed line is the Stop Loss level

    So this is how simple it is to set Stop Loss in MetaTrader 4. All you need to do is to choose the level at which you want to place the Stop Loss. In this case, if the price hits the Stop Loss we will be on the profit and if I put the mouse on it you will see that it says profit $40 and below we can see Pips and if we put the Stop Loss at 1.1820 we will have the profit of $40 or the difference is 40 Pips.

    the profit at the Stop Loss level
    The profit

    So if we are in a long trade, or if we have bought, the Stop Loss simply is a level that we set below the open trade where we will be happy closing the trades in order to make some profit.

    How to set Take Profit in MetaTrader 4

    In the very same way, we can set a Take Profit. For example, we can set it to 1.19200 and at that level we will have a profit of $140.

    Setting Take Profit in MetaTrader 4
    Setting Take Profit in MetaTrader 4

    Something very interesting about the Stop Loss and the Take Profit is that you can drag them. You can move them up and down on the chart. For example, I can move the Take Profit lower and you will see that it was moved down to $112 of profit or 112 Pips above the open price.

    Dragging the Take Profit on the chart

    It really depends on what your strategy is and what is your money management in the account. All of that I will explain later in another lecture, but to summarize this one more time – when you have an open position on MetaTrader 4 you can put a Stop Loss and a Take Profit. This way the trade will close automatically if the price reaches one of the two levels and you don’t need to stay in front of the screen to wait for this event to happen.

    How to set Stop Loss in MetaTrader 4 on a pending position

    Alright, so how to set Stop Loss in MetaTrader 4 on a pending position? Let’s say you want to sell EURUSD with a pending position so you won’t need to wait for the price to reach that level again. This time the Stop Loss should be above the entry price because this is a sell position. So if the price is 1.1750 I can set a Stop Loss at 1.1760, for example, and I can set a Take Profit at 1.1730 and if I click on Modify you will see them on the chart.

    how to set Stop Loss and Take Profit in MetaTrader 4 on a pending position
    how to set Stop Loss and Take Profit in MetaTrader 4 on a pending position

    So this way the Stop Loss says -$10 as a profit and if I put the mouse on the Take Profit again you will see that we will have a profit of $20. This is a sell trade and the Stop Loss is above and the Take Profit is below in the MetaTrader 4 chart.

    How to set Stop Loss and Take Profit on a pending position
    How to set Stop Loss and Take Profit on a pending position

    The other trade we have on the chart is a buy trade and here we have a Take Profit higher, Stop Loss should be lower but because this position is already on a profit I can put the Stop Loss higher than the entry. I can put it really close and if the price drops at the closest trade we will be out with a profit.

    How to set Stop Loss and Take Profit in MetaTrader 4 for a buy trade
    How to set Stop Loss and Take Profit in MetaTrader 4 for a buy trade

    Actually, I will try to demonstrate this. I will switch to a one-minute time frame so every candlestick represents one minute. I will move the Stop Loss very close to the current price so you will see that it’s already red in the terminal which gives me a warning that it is very close to the price.

    The Stop Loss is close to the current price
    The Stop Loss is close to the current price

    So if I put the mouse on the trade you will see that if the trade is closed it will bring me a profit of $64.40 and probably this is about to happen as I see the market going a little bit negative in the short term on the one-minute time frame but let’s see if this will happen. The price currently is 1.1845, the Stop Loss is 1.1844 so it’s about one-two Pips for the trade to be closed.

    I will try to put the Stop Loss even a little bit closer to the price (usually, I don’t do it that way), and is closed now. If I go to Account history you will see that the Stop Loss closed that trade and it’s on a profit.

    Account history shows the trade is closed by the Stop Loss on a profit
    Account history shows the trade is closed by the Stop Loss on a profit

    Conclusion

    So at any moment, you can squeeze the position. You can put the Stop Loss very closely especially if you see it going negative. This way you’re giving it a chance to go higher but at the same time if it drops further lower you don’t want to lose the profit and you can use that method of setting the Stop Loss very close to the position in MetaTrader 4.

    Okay, guys, so this is how easy it is to set Stop Loss in MetaTrader 4. Same with the Take Profit. You can do it for open trade, for a pending trade, or as well if you want to open a new trade. All you need to do is go to Trading, New Order, and there are the Stop Loss and the Take Profit and you can place the trade with a Stop Loss and the Take Profit. If you have any questions let me know in the comments below I’ll be super happy to answer you. If you found the lecture useful don’t forget to share it across social media so more people can see our free educational lectures. Take care and enjoy trading.

  • How to Place a Trade in MetaTrader 4

    How to Place a Trade in MetaTrader 4

    In this lecture, I will share with you how you can place a trade in the MetaTrader 4 platform and what are the different options. I have the MetaTrader 4 platform opened in front of me with an account from BlackBull Markets, so let’s go for it.

    For the purpose of this lecture, I have selected to use the BlackBull Markets that I have been using, and actually, if you have hard times finding a broker you can check out our trusted brokers’ page which we have created to help our students and the beginner traders to choose their broker. I have written personally a few tips and suggestions there and we have the recommended brokers’ tab, we have the cryptocurrency exchanges and wallets and we have some more regulated brokers that we’ve been using.

    How to place a trade in MetaTrader 4 with One Click Trading

    One more time for the purpose of this lecture I’ll be using BlackBull Markets which is a regulated broker I’ve been using for quite a long time. Now if you really don’t know from where to start and how to install the MetaTrader 4, you are missing the first steps. I have already prepared a lecture about installing MetaTrader 4 and once you have the MT4 installed, you are ready for trading.

    Now the easiest way to place a trade in MetaTrader 4 is to use this One Click Trading boxes. It is called One Click Trading box because if I right-click over the chart you see that I have the option to uncheck One Click Trading and this will make the box disappear.

    The One Click Trading option in MetaTrader 4
    The One Click Trading option in MetaTrader 4

    If I right-click again and I go to One Click Trading you will see that the box appears so with this box we see two things – we see the price at which we can sell and the price at which we can buy. As you can notice the prices are different. This is because we have a Bid price and an Ask price, the Bid price is the cheaper one at which we are selling and the Ask price is the more expensive price at which we are buying.

    use One-click trading to place a trade in MetaTrader 4
    One Click Trading in MetaTrader 4

    The difference between these two is called spread and this is how the broker benefits from our trading. Just like the exchange bureaus or the banks. Before you go on a vacation or to a foreign country and you want to exchange one currency for another, you can buy it from the bank or the exchange bureau and there is a difference between the Bid and the Ask price as well. This is how usually those brokers and exchanges make money.

    Spread is the difference between Bid and Ask price
    The Spread in MetaTrader 4

    Now in the middle, we have the Lot, the Lot is the quantity we want to trade. 1 Lot in the Forex trading equals a hundred thousand units, so if I wanna buy 1 Lot of EURUSD, I’ll be actually purchasing 100. If you want to trade a smaller amount you can decrease the lots to 0.05 or which will equal 10,000 EUR versus the USD.

    the Lot in MetaTrader 4
    The Lot is the quantity we want to trade

    Let me demonstrate it to you. Let’s say I’m following some trading strategy that shows me that currently, the trend is going down, EURUSD is going down. So I decide to sell it I will click on Sell and here is a warning with the disclaimer which appears just one time right after you install the platform.

    If I click on “I accept these terms and conditions” and I click on “Okay“, I won’t see this disclaimer anymore. So now if I click on Sell, the trade is executed immediately. I can see it below in the terminal. So you saw that I actually executed this trade or I placed this trade with one click and this is why it is called One Click Trading – because we can sell or buy with a click of a mouse.

    MetaTrader 4 terminal shows the trade is executed
    MetaTrader 4 terminal shows the trade is executed

    How to place a trade in MetaTrader 4 with New Order

    Alright, so what are the other options to open trade or to place a trade in MetaTrader 4? You can right-click over the chart and you can go to Trading, and here you have the option for a New Order.

    Now here comes a box with more details about what type of order you want to have, is it Market Execution. One Click Trading is a Market Execution because I click sell and the broker executes the trade at the market price or this is the current price we have in the market.

    Order type
    Order type

    So if I click on the order type I have a second option which says “Pending order”. If I select it you will see that a new box opens below and now I have four different types of pending orders.

    Different types of pending orders
    Different types of pending orders

    Place a trade with Buy Limit

    One is called “Buy Limit” which means that I can set a price lower than the current one and if the price reaches this level a buy position will be executed. For example, currently, we have the price at 1.1766 so if I select 1.760 I will click on “Place” and you will see that this pending order is below at price drops.

    With Buy Limit we can set a price lower than the current
    With Buy Limit we can set a price lower than the current

    Let me close this open position. I just wanted to demonstrate how this One Click Trading works. It’s on a loss really doesn’t matter because this is a demo account that I have open for the purpose of this lecture.

    So now I have left with the “Buy Limit” order which one more time will execute a buy position if the price reaches the level. For the price to reach the level while I’m recording this lecture and let’s see if this will happen or not and during this time I will explain the other types of pending orders.

    So “Buy Limit” one more time means that we set a level lower than the current price at which we want to buy and as well we have the option for expiry so if you want this to happen by the end of the day but you don’t want to leave such an order for tomorrow you can just set expiry by the end of the trading day.

    Set expiry date for the pending order
    Set expiry date for the pending order

    Place a trade with Sale Limit

    The next option is “Sale Limits” which obviously is the very opposite thing, we can set an order that will execute, for example, let’s squeeze the price right here, I will put it at 1.1770 okay, I will click on Place and you will see that now I will switch to M15 so we can see better we have a Sell Limit on the top, a higher level which will execute a Sell trade or a short position if the price reaches this level of 1.1770.

    This is not a trading strategy that I’m showing at the current moment. I’m just explaining how to place a trade in MetaTrader 4 and what are the different options you have.

    Okay so let’s see which one of the two the price will reach first.

    Place a trade with Buy Stop

    Again I will go to Trading, New Order, and the other two options are Buy Stop and Sell Stop. The Buy Stop is the option to place a level on the market higher than the current price where we want to buy.

    Place a trade with the Buy Stop limit in MetaTrader 4
    Place a trade with the Buy Stop limit in MetaTrader 4

    For example, if I set it to 1.1780 and I click on Place, we will see the order here but this is a Buy Stop or if the price reaches this level it will open a buy position. It’s kind of opposite to the Buy Limit because with the Buy Limit it will still open a buy position but on a lower level than the current price okay.

    Place a trade with Sale Stop

    The fourth option as you may guess already is the Sale Stop. That’s a level where we can place lower than the current price. So let me place it on 1.1750 and we will see the order. This means that we will sell EURUSD at this level which is lower than the current price. Now the price is going very close and it executed this Sell Limit and you see that once the price reached the level of 1.1770 it opened the short trade automatically.

    The Sale Stop limit
    The Sale Stop limit

    So I didn’t wait with my mouse on the Sell button for the 1.1770 to be reached and to sell it manually but it happened automatically by using those pending orders. Why those are useful? First of all, I don’t need to sit in front of the computer and wait to tremble with my finger on the mouse to execute at the right price. You see that if you want a certain price you can set it up with a Pending order and it will execute at that price.

    And this is actually a good sign of a decent broker if it executes the Pending orders exactly at the price you want. If you notice that your broker doesn’t execute Pending orders on the prices you want to have then there is something wrong with that broker and you better look for a new broker.

    Alright, so these are the different options that MetaTrader 4 offers to place a trade. Of course, you can use Expert Advisors or the so-called Robots that we show in our courses and we use for our trading in the Academy because they execute trades based on different strategies fully automatically but this I’ll be talking about in another lecture. For the moment, I wanted to show you how you can use the One Click Trading on MetaTrader 4 or how you can place Pending orders.

    Conclusion

    One more time, four different options for Pending orders – the Buy Limit, Sell Limit, Buy Stop and Sell Stop and pretty much discovers all possibilities of placing a trade in MetaTrader 4.

    • If you want to buy at a higher price then you need to use the Buy Stop
    • To sell at a lower price, you need to use the Sell Stop
    • if you want to sell at a higher price you need to use the Sell Limit
    • To buy at a cheaper price than the current level you can use the Buy Limit

    Alright, so these are the different options for placing a trade on MetaTrader 4. If you have any questions let me know in the comments below. I’ll be super happy to answer you. Enjoy trading and I will see you guys in another lecture, take care and enjoy trading.

  • How to Create and Sell NFT Art

    How to Create and Sell NFT Art

    In this lecture, I will share with you how you can create and sell your own NFT art and become a seller. So even if you’re not an artist, you can give it a try. Just what I will demonstrate in this lecture is for educational purposes. I’m not an artist, but I will show you step by step how to create an NFT and how to sell it on OpenSea, one of the most popular platforms.

    And as well, you will see all the fees. And I will share with you again some pros and cons, as I always like to do. So we can have a realistic idea about it. And you will know if this is the right thing for you.

    If you are an artist and you want to get started as soon as possible, listing an NFT on OpenSea or any other platform, I will show it to you right away. So let’s go for it.

    How to Create an NFT Art Collection

    Now on the front page, I will click on Create. So this is the very front bottom we see. And then I have the option to create a Collection.

    How to create an NFT collection on OpenSea
    How to create an NFT collection on OpenSea

    So for the purpose of the lecture, I will be creating a Collection that probably won’t have the purpose to really sell an NFT and make money out of it. So I’ll put the watermark logo that we use on our videos at Trading Academy and then I will be putting a name on my Collection. Let’s name it ‘Trading Academy‘. That’s what comes to my mind. This is the project I’ve been working on the last few years and then I have descriptions.

    You should think about the Collection like your store and OpenSea says actually right here, provide a description of your store. I even didn’t see that but yes, the Collection is like a store. And you need to describe what are you selling in the store.

    NFT Collection settings
    NFT Collection settings

    So for the purpose of the lecture one more time, I will just say ‘Items from Trading Academy‘, for example. Whatever you’re doing, you should put a decent description right over here.

    Then you have the option to select the blockchain. You can stick to Ethereum, you have the Polygon, which is a fast gas-free blockchain experience that works with Ethereum. And then we have the Klaytn, which is a global blockchain platform. So Polygon is actually India-based if I’m not wrong, it came as a solution with the higher gas fees. So it’s up to you. It is with the MATIC crypto.

    It’s a personal choice which blockchain you want to have but basically, the one you use, you will see that all new items from this collection will be added by default.

    I will stick to Ethereum just for you to see what are the actual fees. And then I will click on Create and you see that our NFT Collection has been created and now I have the option to add items.

    How to Create an NFT Art Item

    So here is my store or collection where I have nothing at the current moment, but I have the option to add items. You can drag and drop over here simply anything. The maximum size is 40 megabytes, it could be an image, video, audio, 3D model. And below are all the file types that OpenSea supports.

    And as you know NFT is a huge world where you can sell really everything. So again I will put the watermark and then as a name I will put Trading Academy’s watermark. And this is our brand watermark so I don’t think I will be selling it, but this is what came to my mind.

    Then you can put a link from the website. So what I can do actually is I will just copy-paste the URL from the Academy and put it right over there.

    Naming the NFT item for sale
    Naming the NFT item for sale

    So if you have a website, it’s not a bad idea to drop the link so that people can see that you are actually serious about what you are doing. You have a website, let’s say you are doing some digital animated art or whatever. You should be having a website. If you want everyone to take it seriously.

    And then we have the description that will be visible on the items details page. So here you should write a detailed description. Again, this is the watermark of the Academy.

    Adding an NFT item description
    Adding an NFT item description

    And then we have the Properties, so we have a few options here. It depends on what you are uploading as an item. But we have some Properties, we have some Levels. So it could be, for example, a Speed with a Value 1 of 5 if it is something connected with games, for example, this is where Levels are useful.

    Adding Levels to the NFT Art
    Adding Levels to the NFT Art

    Then we have some Stats. For example, if I am uploading some pictures from the Academy and they have some different stats or videos that are more useful for the traders, I can add these stats.

    And then we have Unlockable Content and with the Unlockable Content, it’s quite interesting because here I can add literally anything. It could be a URL or it could be a file that you want the buyer to be able to download. It could be an option for them to receive the actual item.

    Unlockable Content could be anything
    Unlockable Content could be anything

    So if you are selling socks for example, and if you have NFTs with different stocks, you can give buyers the option and send them the actual socks, the physical socks. Or it could be a ball. It could be glass, whatever. You have the option here to put whatever you want for the buyer to make it valuable.

    And for example, in my case, if one day we turn this Trading Academy Collection into a real store and we do NFTs (I haven’t planned it, honestly, but why not) what we can add here, for example, is links to some free courses. Or we can give them coupons or we can give them access to some of our paid courses. So whoever buys the NFT can access some of our paid courses. So it really depends on what your business is all about. For the moment, I will disable it.

    And then we have the Supply. This is the number of copies that are available for minting. And what does this mean? I will actually click on the Info tab and there is the explanation exactly.

    The NFT Supply
    The NFT Supply

    So what is minting? This is the fee when you are transferring from one account to the other or when someone buys an item from you.

    NFT Minting explanation
    NFT Minting explanation

    In all other cases, you don’t pay fees. So when there is an action, then basically this is the mint process and there is a gas, but there is no gas if you want to create more copies. But you see by default that the Supply value is 1 and the field is not active.

    How to Enable NFT Supply

    So I’ll show you a small trick on how you can enable it, I will go to the URL. Now let me try to write it precisely. It was ?enable_supply=true. So now you can see that the number of copies that can be minted is editable. I can select 50, I can select 100 as many as I want.

    Enabling NFT Supply
    Enabling NFT Supply

    But here, something important.

    Don’t forget that the NFTs are Non-Fungible Tokens and if you want to create a valuable one, I would suggest sticking to 1.

    And it isn’t active for a reason. I just gave you the trick on how you can enable it. You just need to drop this line at the URL.

    Now because I changed the URL, I will need to quickly import again the NFT that I want to create. I will keep the Supply to 1 because I personally believe that NFTs that are super unique have more value.

    Then there is the Ethereum blockchain, which I have selected. And on the bottom, we see that we have the option to Freeze metadata.

    Freeze metadata meaning
    Freeze metadata meaning

    And it says that ‘Once locked, your content cannot be edited or removed as it’s permanently stored in decentralized file storage, which will be accessible for other clients to view and use‘.

    And below you can see that to freeze your metadata, you must create your item first. So I will tap on Create.

    Create an NFT item
    Create an NFT item

    And Trading Academy’s watermark NFT has been created.

    NFT item has been created
    NFT item has been created

    And then I will just visit it. This is the NFT art of the Academy. I don’t have any trading data yet. It has not been traded. It’s listed by me.

    The NFT art of Trading Academy
    The NFT art of Trading Academy

    And of course, if you want to make an attractive store collection, the more details you put, the better.

    Below are the Contract Address, Token ID, it’s under Ethereum Blockchain, and Trading History. We have just one event that was created by me a minute to go.

    Item Details and Trading History
    Item Details and Trading History

    So it is that simple to create an NFT and of course, you should spend some more time for descriptions, making it a little bit more attractive and trustworthy.

    However, the purpose of this lecture was just to show you the steps of how you can create an NFT art. And something very important is this NFT is not yet on the blockchain. It will be there once I sell it.

    This is when the gas fees will play the role to actually store this NFT on the blockchain. But for the moment it is just listed in my Collection.

    How to Sell an NFT Art

    Now, you will see how you can sell your NFT because there are many details during the process. But no worries, it’s nothing complicated.

    Now I will show you how you can sell your NFT once you list it on the OpenSea. And as I said, it’s nothing really complicated. All you need to do is click on the Sell button above the NFT you have already created.

    And here are the settings and I will try to explain them with simple words.

    Fixed Price

    So the first thing is you can sell the NFT at a fixed price. For example, I can decide that this NFT worths 1 Ethereum and this will be the price that I will be requesting for the NFT. And immediately I want you to see the Fees.

    How to sell NFT with a fixed price
    How to sell NFT with a fixed price

    OpenSea charges 2.5% for using their platform. So it depends on how much you’re selling the NFT art. You will pay the fee accordingly.

    Using Auction

    The other option is to use an Auction. And here, of course, it’s all about the Highest Bid so you can choose a minimum bid price.

    For example, you can start from 0.1 of Ethereum. And then we have the Reserve price, which is pretty cool because you can create a hidden limit by setting a reserve price. As soon as the price reaches, for example, 2 ETH, your item will be auctioned. The highest bidder will win it. And it is for a certain period of time.

    how to sell nft art at auction
    How to sell NFT art at auction

    Something important here, you cannot put a reserve price below 1 Ethereum. For example, let me put it to 0.5. You will see on the right side in red, I have the reserve price must be greater than the 1 Ethereum in value.

    OpenSea minimum Reserved price
    OpenSea minimum Reserved price

    You can sell your NFT art in two, five, ten days, whatever Expiration date you want. If you are not in a rush, I would suggest to you to give it more time, because this way you will be having hopefully more bids. So you can go for a week, a month, or you can select never. Meaning that you won’t have an expiration date for the auction.

    Setting the Expiration Date for the sale
    Setting the Expiration Date for the sale

    I personally believe that if you have a limit date, you’re kind of giving the people a limit to thinking about it, to decide if they want to bid or not. So I think something about 1 week is really enough, an appropriate time for the expiration date.

    How to sell a group of NFT art items

    On the right side, we have the Bundle. So if you have a group of NFT items, you can bundle them and sell them together.

    How to sell a group of NFT art items
    How to sell a group of NFT art items

    I will tap on that, but I don’t have a bundle. In my Wallet, I have just the NFT that I have bought previously and the watermark NFT that I have created before. I don’t think they bundle well at all.

    Selecting NFT items to sell
    Selecting NFT items to sell

    So one more time you can select between Set Prices and the Highest bid. I want to make the lecture really educational and show it step by step how to buy and sell an NFT art so I will go for a Set price. Let’s go for 1 Ethereum, for example, a fixed price for the watermark of the Academy. And if you are on the Set price, actually you can schedule for a future time or you can keep it private.

    Set Price options
    Set Price options

    And then on Instructions, there is something very important. If you have just created your OpenSea account, just like the one I have created for the purpose of this lecture, you have to complete two free plus gas transactions.

    So the first one is to initialize the account or it will become eligible for selling items. And the second one is to allow OpenSea to access the items.

    Instructions for selling an NFT
    Instructions for selling an NFT

    And what it says after that is important.

    After those, you will see a signature request to finalize your listing. In the future as long as the item was approved in step two above, you won’t have any transactions at all, only a signature.

    OK, so these two should be made just once and I will show you that right away.

    Posting the NFT listing for sale

    So I’ll click on Post Your Listing and it says, to allow OpenSea to sell items on your account, you must first complete a free plus gas transaction. Keep this stuff open while we wait for the blockchain to confirm your action.

    And on the right side, you can see that the Gas fee that I should be paying is 0.021826 Ethereum, which is approximately $46.21. And I need to confirm it.

    I have added some more Ethereum before preparing this lecture so I can actually do the whole selling process. And I will just click on Confirm, and if I click on Edit, you will see that I can actually do it cheaper if I want to do it slowly. But I think it could take even a few days that we have the average speed.

    Choosing a gas fee to speed up the processing
    Choosing a gas fee to speed up the processing

    So slowly is about $25. Then we have the average speed and a fast. However, I have confirmed that because I want to do it while I’m recording the lecture. Obviously, I don’t want to wait hours or even days.

    But what’s interesting is that you can choose a high gas fee to speed up the processing of the transaction. So you have the option actually to choose how fast you want to do it. If you are not in a rush, you can choose the slow option and pay less.

    But one more time. I wanted to do it while I’m recording the lecture so you will see how it works. And it’s interesting to see actually how long time it will take us for the selling account initialization, even if we go with the fastest option.

    Selling account initialization

    It took actually less than a minute, I think.

    Gas fee transaction confirmation
    Gas fee transaction confirmation

    So once again, this was a one-time payment to initialize the account for making selling orders.

    And now let me put again 1 Ethereum for the price and I will post the listing. And now you see that I need just to sign it. So I’ll click on Sign.

    Signature request for placing an NFT item for sale
    Signature request for placing an NFT item for sale

    And so what happens? The NFT art item that we have created at the beginning of this lecture is listed for sale. So Trading Academy’s Watermark is listed for 1 Ethereum.

    The NFT item is listed for sale
    The NFT item is listed for sale

    Honestly, I was not planning to list our watermark, but for the purpose of this lecture, I decided to do it. So you will see step by step how it works. And below in the trading history, you will see that our NFT item was listed for 1 Ethereum.

    Trading History for the NFT item

    Why I was not planning to sell it as NFT art is because we paid much more for a designer to create the watermark, honestly.

    But any tutorials I record should be 100% complete because you as a person that spends time watching my lectures, deserve to see the whole thing.

    So now if I look on OpenSea for Trading Academy, let’s see if we will see it listed. Oh, yeah, it’s listed on the Trading Academy.

    Our NFT item is listed for sale
    Our NFT item is listed for sale

    But one more time, that was not the purpose of creating this NFT. I just wanted to show you the whole process of how to create and sell NFT art. And as simple as that, you just need to follow along with the steps one more time.

    Keep in mind that you are paying this fee above $40. And as you saw, it could be less if you are not in a rush. I’m not in a rush. Just wanted to make it quick while I’m recording the lecture.

    But the fees, when the sale happens, actually will be covered by the buyer.

    When you use a fixed price, like what I did right now for the watermark NFT, if someone buys this NFT, they will be covering the gas fee for the transaction. But if I was using an Auction and I see the offerings, if I accept a certain offer, let’s say someone offers me 5 Ethereum and I’m happy with that and I accept the offer, then I’ll be taking care of the fees.

    OK, this is very important to note. So it’s up to you what is your strategy. Think about it depends again on what you’re selling.

    It’s all about actually what you are selling so you can build your strategy. If you have any questions on how to create and sell NFT art, let me know in the comments below. I’ll be super happy to assist you and I will see you guys in the next lecture.

  • How to Buy The Best NFT Art

    How to Buy The Best NFT Art

    In this lecture, I will be talking about buying NFTs. And as you already saw, it’s a huge market and if you’re new to this and you jump from platform to platform, you might get frustrated and have a hard time selecting your first NFTs.

    The first time I talked about which are the best NFT tokens to buy was back in July 2021 when I did two price predictions. One was for MANA, the other one was for SAND. At that time these NFT tokens were trading about above $2.15 and I said that MANA will reach above $4.20. I usually avoid making price predictions because nobody knows what exactly will happen but based on my experience and price action trading technical analysis I saw clearly that this will happen sooner or later and it happened later in October 2021.

    However, I decided to create this lecture and give you some tips on how to buy the NFT tokens when they are already expensive and are they really expensive. What if they reached $10, 15, 20, will we still consider $2, 3 to be expensive? I will cover it all in this lecture. I will tell you how I’m looking at those NFT tokens and as well I will share with you why I keep buying NFT tokens and which are the best NFT tokens to buy in 2022 if you believe in the NFT industry.

    And why not, it’s exploding. We see the top-ranking keywords on Google, YouTube, everyone is looking for NFTs and this huge demand makes the prices increase which is the thing I take advantage of as a trader, and in this lecture, I will share my experience so you will know when exactly is a good time to buy any of the NFT tokens. So now I’ll be giving you some tips on how you should be selecting your NFTs and why it’s important to look at popular artists.

    Which are the most valuable NFT tokens

    Before I start I have to say that I’m not sponsored in this lecture by any of those NFT tokens, not the games, not the websites, nobody. I decided to write it so you will know when it is time to buy NFT tokens and which are the best NFT tokens to buy at any current moment. If you’re ready I am let’s do it.

    Now if you want to keep an eye on the most traded NFT tokens and you want to buy those that have the most volume that people are flipping around and there is a huge market cap you can visit the website called coingecko.com. I’m not related to that website, I’m not promoting it.

    Just click on NFT related coins and you will see the top NFT tokens by market cap and whenever you’re reading this lecture if you look at this page you will see which are the top coins with the biggest market gap.

    Let’s face it, market cap matters just like with Bitcoin and Ethereum. They have the biggest market cap which means that this is where the biggest investments are and if the big guys are investing into this coin there is a huge potential. It’s not a guarantee that it will last for ages but for the moment if the big guys are investing into it you should be considering those coins instead of those small coins which are riskier.

    At the same time, the riskier coins usually bring more profits so I personally diversify the risk by investing in NFT coins with huge market cap and with coins that are down in the list such as the Alien Worlds. At the same time, I have Axie Infinity, Sandbox, and Decentraland which are in the top 10 by the time I’m writing this lecture.

    Actually, I have bought them much earlier this year when they were trading at about 50 cents, and if you wonder at any moment which NFT tokens to buy you can check out my Patreon where I share all the signals when I purchase NFT tokens or other coins like Bitcoin, Ethereum, or Solana and all the rest. As well you will get access to my cryptocurrency portfolio spreadsheet which is very useful if you want to track your NFT tokens. If you look at the bottom of my spreadsheet you will see that there are the NFT tokens I have bought and you will see what profits those brought to me.

    However, I don’t put more than 10% of my crypto portfolio into NFT tokens, one more time because they are considered to be riskier investments even the recent months they have proven that they will last for longer and if you look at the market cap one more time you will see that the top eight coins are in the top 100 by market cap among all the coins.

    This proves that the NFT tokens are already huge and I definitely will be looking to buy more NFT tokens in the near future. So let me tell you when it is a good time to buy NFT tokens.

    Best NFT tokens to buy actually

    Now when you select which NFT tokens to buy, it is time to decide is it a good time to buy one now or not and there are usually two cases when the people feel certain about purchasing or buying those NFT tokens. This is when they are on our new record highs and it seems like they are so expensive and you are afraid that you are not getting the best price possible and at the same time if you are looking into those after a Bull run.

    For example, when the Bitcoin drops we all know that the other coins drop as well just like it happened this year. Bitcoin lost over 50% of its value after Elon Musk was smart on Twitter and all the rest followed along. Some coins actually lost 70, 80, 90% of their value and this is where the people just panic and they think the market crashed, they lost all of their money but actually, this is the best time to buy and to invest especially into the NFT tokens.

    So personally I always wait for such huge retracements if I want to buy crypto and when you select your NFT tokens to buy for investment purposes or if you just want to flip them you would better wait for a huge retracement. Don’t take this as financial advice but I will share with you how I’m doing it.

    I am purchasing NFT tokens whenever they lose over 60% of their value. For example, Alien Worlds in September lost over 64%of its value and today it actually lost nearly 40%. So I usually take advantage of those drops and when the people actually panic they will lose their funds and they help the price to go even lower.

    This is where the smart money comes in. This is where the huge investors are buying again and again and this is when you should be buying. So my rule for the NFT tokens to buy is when they lose over.

    We are already on a profit even if we reach just the previous stop, the previous record high. We are on a profit and of course if you catch some of the NFT tokens that are breaking new record highs and you want to jump on the train, make it carefully. You might get on a nice profit especially if you were trading MANA during the last months or Sandbox. You would definitely make a profit, I just did a bigger profit because I waited for the retracement before that so when the price was breaking the new record highs, I was already on a profit and this brought me actually hundreds of percent in growth.

    How to Choose an NFT Art

    So I’m on the Rarible right now and you can see the top sellers on the front page. And this is the reason, these are the sellers that have sold the most NFTs for 1 day in value.

    Rarible homepage
    Rarible homepage

    For example, Alex Henry has sold NFTs for 12.5 Ethereums in 1 day. Now, if I switch to 7 days, you will see that Alex Henry has sold NFTs for 16.83.

    So for 1 day, he sold for 12, which means that the last 24 hours were great for him. And in the past 1 week, he has sold NFT for 4.3. And if I switch to 30 days, let’s see if Alex Henry is in here. No, he’s not.

    Why buy NFT from the top sellers

    So this is the first step I want to give you. If you are choosing your artist by this filter, you want to buy NFT from one of the top sellers, make sure to switch through the different time periods. Because it might happen that some of the guys had a great day and sold an NFT for a lot of money.

    But it could be just luck or it could be speculation as well. So it could be an artist that listed an NFT on the high price, bought it from a different wallet just to get on the first page. So make sure to switch through the different time periods.

    For example, if I look at Mani Grupa, you will see that if I switch to 7 days, it is still here with 21.4 and if I switch to 30 days, you will see it’s still in here with 92.4.

    Switching to different periods
    Switching to different periods will show you the NFT top sellers

    So this gives me an idea that this artist is selling NFTs constantly in the last 30 days, in the last 7 days and in the last 24 hours. If I scroll below, you will see some of his art.

    Look for unique NFT tokens to buy

    The next thing I want you to pay attention to is the number of pieces. So, for example, this Gold Mani Token starts from 2.7 Ethereum, and this is 12 out of 25. As well, the Exclusive Mani Token is 21 of 25.

    Number of NFT pieces for sale
    Number of NFT pieces for sale

    Now, some artists prefer to create many additions for their NFTs while others create unique NFTs.

    If I click on Bunny, which is another NFT artist, you will see that this artist creates a bigger number of NFTs in one edition. For example, this is 91 of 100. And then we have 89 of 100 or 417 out of 420.

    Some artists create a higher number of NTFs
    Some artists create a higher number of NTFs

    If I click on “Bunny POP SMOKING THE DIP” for example, you will see that it costs 0.1 RARI or this is about $117 for 5 editions. And RARI is the token for the Rarible platform.

    Going back to the first page, I will click on Alex Henry and you will see that his NFTs are 1 out of 1, which means that he is creating unique NFTs. And personally, I think unique NFTs have more value.

    So my second tip before you buy an NFT is to look at how many additions the NFT has or if you’re looking for unique NFTs, because this is what NFTs are, they are non-fungible tokens.

    You should be looking for artists like Alex Henry. I am not promoting him, I don’t know the guy. But I know that he is creating unique NFTs that are 1 out of 1 and if you buy one, it will be super unique. No one else will have it.

    Now, it’s another question if you will be able to sell this NFT. But this is what I will be talking about in another lecture about creating and selling NFT art.

    Look for artists that you actually know

    And my third tip when selecting the artist is to be someone that you actually know. Let’s look at the top-selling NFT creators in 2021, or we can say that this is for the first quarter of 2021.

    List of top-selling NFT creators in 2021
    List of top-selling NFT creators in 2021

    Obviously, number 1 is Beeple. You can see that he had sold 845 artworks for over $100 million. Obviously, $70 million came from ‘The First 5000 Days‘ NFT. But you can see that he keeps on selling. So he’s not someone that created a one-time NFT and is now taking a break on Hawaii.

    Actually, he could be. But my point of view is that he is the artist who sold this NFT art for a record price and he keeps on creating new NFTs and selling them. And obviously, his name is already quite popular.

    Then we have Trevor Jones, who has sold NFTs for over $18 million. But you can have a look at the number, 5,284 artworks. Much bigger number compared to what Beeple did with 845 and he got less in revenue. Still obviously awesome revenue.

    Then we have the 18-year-old crypto art surrealist Fewocious. And he made over $370,000 from an NFT drop on their birthday this year. Or in total over $18 million as well.

    Then we have the Pak with over $16 million with over 1,681 pieces of art. And the list goes on.

    But what I want you to take out from this lecture is that there are already popular artists. And you might know these guys from social media, you might know them from blog articles like that one, or you might know them from the different NFT platforms.

    But it’s a fact that when popular artists list new NFTs, they have much more value compared to the NFTs that come from newbie sellers. And some might say it’s not fair for the new guys, but it is what it is.

    When you are a new YouTuber you really have to work hard until you get subscribers, so you will have more views on your videos.

    It’s the very same thing here. You need to become popular. If you want to become popular, you need to work hard. You need to create something unique. You need to stand in front of the crowd.

    And if we are looking from the bank perspective, as someone who wants to buy an NFT, definitely looking into the popular sellers or the popular creators is the thing you need to consider.

    How to find valuable NFT tokens to buy

    Now, I will share with you what I am looking at when I want to buy NFT, because honestly, it’s hard, especially if you want to buy NFT in order to resell it later. It’s really hard to estimate if you will be able to resell this NFT on a profit or not.

    So on OpenSea if I click on any of the NFTs randomly, I am picking randomly this CryptoModel. We see that this CryptoModel is on sale and I can buy it for 0.0259, but it’s a new one.

    Picking NFT art from OpenSea

    It’s a new one, there is no history and it was just created. So I really don’t know if I’ll be able to resell it at a profit. Maybe not because I don’t have any data.

    So when you’re looking to buy NFT tokens you want to see some data for that NFT.

    So for example, if I click on the CryptoPunks collection, which we said are quite popular, you’ll see that some are on sale, others not, but one says Last 40 Ethereum. CryptoPunk number 486. Let me click on it and you will see something interesting here.

    CryptoPunks collection
    CryptoPunks collection

    There is an increase in the price. So this is January 29, 2021. Then we have a sale on the 14th of February, then on the 24th of February.

    Increase in NFT token price
    Increase in NFT token price

    And below in the Trading History, what you can notice is that the price increased. The first sale was for 13 Ethereums, then for 15 and then for 39 and then for 40. And you see that all of these are different owners.

    NFT trading history
    NFT trading history

    So simply said, this shows me that there is an interest in that specific NFT token for some reason.

    One person sold it to another one, then the BlackSwanSong sold it to Petitcaillou. Then this guy sold it to the B9FDDB and then this guy sold it to the other one and the price increased from 13 up to 40 Ethereums. And this is just in 2 months and I’ll bet. So this is the next important thing I want to see.

    Now 2 concerns here, one is that the price jumped significantly from 15 to 39, which says to me that probably it is too late to buy this NFT. And the second thing is that nobody has bought this NFT for 2 months now.

    So one more time, when I’m choosing an NFT, I want to see an increase in the price, which means that I have a higher probability of reselling it at a more expensive price.

    But ideally, I’m looking to buy NFT tokens that increase in price consistently, and at the same time, this increment in value happened recently.

    If it’s in the last few days, awesome. If it’s in the last few weeks, it’s OK. But 2-3 months ago, not really.

    So if I look for some other CryptoPunks, I will just pick any randomly. Let me go back to one, which is a little bit cheaper compared to the rest. I will click on it and you will see that we have a steady increment in the price. But this is because probably we had just 2 sells.

    how to buy nft tokens

    So the first one was at 0.25 on the 23rd of November 2019 and then 2021 on January the 5th.

    So let me click on another one and let’s see what data it shows.

    how to buy nft art

    It shows ‘All Time Average Price’, but if there were 2-3 transactions only, not really an average price. Exactly 3. But you can see 12, 18, 24. 5, 3 months, 2 months ago.

    So pretty similar, just the price increased a little bit more steadily. But again, there is a huge period when nobody wanted to buy this NFT token.

    Choose a nice NFT that was interesting for the people

    So this is the risk that you are always taking when purchasing NFTs. You might choose a nice NFT that was interesting for the people. The price was increasing, but it could happen that nobody will buy your NFT for a few months, even years.

    So 3 things I’m looking for:

    • NFTs that were bought and sold a few times, at least 3. If I could be the 4th or the 5th person, that would be best and ideally.
    • I’m looking for steady growth in the price.
    • And at the same time, I want to see the NFT selling in the last few days or weeks and not months.

    So this is what I’m looking for when purchasing NFTs, this is my personal experience. And if you have some other criteria, I’ll be happy to know it. But when an asset is unique, it is non-fungible.

    It is really a hard task selecting the NFT you want to buy because the data that we see from the platforms allows us to see if this NFT was sold a few times, what was the price.

    Unfortunately, it’s not data similar to what we see with the regular cryptocurrencies, Bitcoin, Ethereum. So right here you see one that actually decreased in value. So such an NFT won’t work for me and it doesn’t necessarily mean that it will further decrease.

    But it’s not only me who sees the stats, it’s everyone else. And if the next person sells it for 15, everyone else will know that this NFT actually loses its value instead of increasing it.

    So feel free to share in the comments below when is the best time to buy NFT tokens or which are the best NFT tokens to buy according to you. I’ll be super happy if you share your thoughts below so we can discuss it together and the lecture will be more useful to everyone.

  • Bitcoin Dollar Cost Averaging Strategy

    Bitcoin Dollar Cost Averaging Strategy

    In this lecture, I will give you an example of a Bitcoin dollar cost averaging strategy if you are interested in investing and not in trading. Initially, this is a trading strategy so we buy and then we take quick profits, then we buy again, we take quick profits. But if you want to use it as an investment strategy, it works just great and I will share it with you right now.

    Bitcoin dollar cost averaging strategy
    Bitcoin dollar cost averaging example

    Bitcoin Dollar Cost Averaging Investment Strategy

    What I want to show you is that our simple Bitcoin trading strategy is actually very suitable if you are purchasing regularly Bitcoin or, in other words, if you’re using a dollar cost averaging strategy.

    So for beginners, a dollar cost averaging strategy means that you are buying regularly Bitcoin. For example, you are just buying for $100 every week, every Monday, or you are buying for $1,000 every month. Or it could be less. It could be just $10 every week or every 2 weeks. It depends on how much you can afford, how much you want to put on the market.

    Usually, the dollar cost averaging is suitable for very beginners who have no idea about indicators at all and they just buy every Monday, for example, or every first day of the month.

    And in the long-term, the Bitcoin dollar cost averaging strategy is profitable until the moment. Because overall, the Bitcoin market went positive. There were declines, there were negative times, but overall, in 2021 especially, everyone who used the dollar cost averaging strategy during this time is in a huge profit. Because if you did it, you were buying Bitcoin at a much cheaper price where the market is today.

    Bitcoin dollar cost averaging strategy profits
    The Bitcoin dollar cost averaging investing strategy is profitable in the long run

    When to Buy an Asset

    Now, with this Bitcoin dollar cost averaging strategy, you won’t be just buying every Monday or every first day of the month no matter where the price is. You will be buying whenever the market turns positive again.

    So let me go back a little bit earlier so we can have a market where the Bitcoin price is going up and down. For example, there is a period over in 2019 that was quite interesting because the price reached nearly $14,000. Then last year in March, because of the Coronavirus, it dropped down below $4,000. And after that, it reached record highs above $60,000 in 2021.

    The volatility of Bitcoin price
    The volatility of Bitcoin price

    Now, how you can use this Bitcoin strategy and combine it with the idea of dollar cost averaging investing strategy? Let me zoom the chart just starting randomly somewhere from the daily chart.

    For example, let’s say that you got very enthusiastic right in June 2019, and you wanted to start buying Bitcoin and you are using our simple Bitcoin trading strategy. So you would be buying when the 50 Moving Average goes up. And at the same time, when we have a bar opening above the Moving Average with a period of 5. And below you can see an example entry. The market goes up and you buy.

    Buying Bitcoin when the market goes up
    Buying Bitcoin when the market goes up

    Let’s say, you buy Bitcoin for $100 when there is an exit condition, and what do you do? Nothing. You are investing in Bitcoin. This is what I’m talking about in this lecture.

    If you are the type of person that wants to buy regularly Bitcoin and have it in your portfolio or invest some of your savings into Bitcoin, I will share with you how you can use this Bitcoin strategy for investing.

    The first opening above the Moving Average

    Then where is the next entry? On the image below you can see another opportunity to buy. The price was below, it went above on the first opening above the Moving Average, so we buy again.

    Another entry in our Bitcoin dollar cost averaging investment strategy
    Another entry in our Bitcoin dollar cost averaging investment strategy

    And then where we have the next buying opportunity on the chart below. And then we have the next one. So we have 3 entries, and then the price went above, and then it went below. And you will see on the image below that here I have one more entry because we have a bar opening above the chart.

    entries for the bitcoin dollar cost averaging investing strategy
    More entry examples with our Bitcoin dollar cost averaging strategy

    And I won’t make this lecture very long but you get my point. Every time we have the entry signal from the simple Bitcoin trading strategy, we buy.

    Should you buy when the 50 Moving Average turns downwards?

    And then on the image below, we may have one more buying opportunity. But should I be putting the circle there or not? I will give you a second to think about it.

    The 50 Moving Average turns downwards
    The 50 Moving Average turns downwards

    No, I shouldn’t be doing it because the 50 Moving Average turns downwards. It’s going down instead of going up and we are not buying during this time.

    I think the next buying opportunity was on the opening of the bar on 13 September 209. On that day the 50 Moving Average goes upwards.

    The next buying opportunity in the Bitcoin dollar cost averaging strategy
    The next buying opportunity in the Bitcoin dollar cost averaging strategy

    Then the 50 MA goes down until January 2020 and probably the first entry will be at the end of January 2020, right after the 50 Moving Average changes its direction upwards. I’ll be buying it right over there, on the 27th of January, 2020.

    The first entry in 2020
    The first entry in 2020

    So this way, you will be buying only when the market turns positive and you won’t be buying when it’s negative. And in the long term, one more time, what we’ve seen so far from Bitcoin is that we have some great buying opportunities in 2019. And then you see that the market went very positive in 2021.

    Bitcoin buying opportunities in 2019

    Investing in Bitcoin with the dollar cost averaging strategy

    So this Bitcoin strategy, you can apply for investing purposes. And if you are a fan of the dollar cost averaging strategy or if you just want to buy Bitcoin from time to time, you can keep an eye on that strategy. Whenever you have the entry you can buy. In the long term, you would be profiting because Bitcoin has been on the market for over 12-13 years and this strategy proved to be profitable.

    You will be buying regularly when you have the signals. Of course, at any moment when you are happy with the profits, you can take them. Especially when you have a huge move like in the image below. Then the 50 Moving Average starts to turn downwards, probably the best time to take the profits because we never know exactly where the top is. And taking the profit on the top or selling everything you have on the top is nearly impossible.

    The dollar cost averaging strategy is profitable for Bitcoin
    Bitcoin price during the years

    And if I zoom the chart back in 2017-2018, you can see a very similar thing. So even if you are selling Bitcoin at 11,000-12,000 when the 50 Moving Average starts to go downwards or when the 5 crosses the 50 Moving Average downwards, it’s a great sell signal as well. You can use this moment to sell Bitcoin and take profits because if you have bought it earlier, you would be definitely on profit at that moment.

    The best time to sell in 2018 if you bought Bitcoin earlier
    The best time to sell in 2018 if you bought Bitcoin earlier

    My trading chart

    So one more time, you can use the signals from the simple Bitcoin trading strategy to buy. And if I show you my chart with the dollar cost averaging strategy for Bitcoin where I’m buying regularly based on many things, not just on the 5 Moving Average, but I have a lot of drawing tools and trend lines and counter trend lines, which is the strategy that I explain in my Cryptocurrency Investment Strategy course, you will see how many times I have bought it.

    The light blue points on the image below show where I have bought Bitcoin and you can see that when the market turns negative, I didn’t do it. I’m waiting for the new uptrend to come on the market.

    My chart for Bitcoin
    My chart for Bitcoin

    So this simple strategy will give you great entry points if you want to buy Bitcoin regularly and use it as a dollar cost averaging investment strategy.

    I would be super happy if you practice and share with me and the other students where are all the entries during 2020. You can do it on any trading platform, not necessarily on TradingView.com, but you can put circles, arrows, whatever it is with all the entries.

    Make sure that you understand the Bitcoin dollar cost averaging investment strategy and this way you will be convinced that you know what you’re doing. But even if you are not going to invest in Bitcoin but you like just to trade with a robot, by practicing you will just learn exactly which are the buy signals in the Bitcoin dollar cost averaging strategy.

  • How to Backtest Bitcoin Strategy

    How to Backtest Bitcoin Strategy

    Today I will share with you how to backtest a Bitcoin trading strategy or how to perform Bitcoin robot backtesting on MetaTrader.

    While I’m waiting for some more results with the robot, I will demonstrate to you how backtesting works on MetaTrader. You will see that it’s super similar to what we see in EA Studio.

    How to backtest Bitcoin trading strategy

    So right in front of me, I have the MetaTrader on my VPS. This is where I have placed the Bitcoin trading strategy I showed you in a previous lecture. And you see that I have a sell trade opened at 32,829.33, the current price is 30,825, which brings me a profit of $197. And we will see how this trade will go if we have a new bar opening above the Moving Average, the 5 Moving Average, the position will close on profit.

    Results from the Bitcoin strategy backtest
    Results from the Bitcoin strategy backtest

    The only scenario this position might close on a loss, the price goes above the opening, and tomorrow opens above the 32,829. In this case, the position will be closed on a loss. But we need to see a really positive day in order for this to happen. But we will see how it will go.

    Now, while I’m waiting for some more results from this automated Bitcoin strategy, what I want to show you is how to backtest the Bitcoin robot on MetaTrader. And probably, this is the easiest way to backtest the Bitcoin strategy on your broker. Alright?

    Setting the backtesting settings in Strategy Tester

    So if you have already chosen a broker and you have installed the MetaTrader, you have the robot downloaded from the Simple Bitcoin Trading Strategy course, you can backtest it and see how the Robot performed with your broker. Because the brokers offer a different bid and ask price, different spread, so the results are slightly different from one broker to another or from one platform to another.

    Bitcoin spreads with the broker
    Bitcoin spreads

    So what I will do, I will right-click over the chart, I will go to Expert Advisors, and I will go to Strategy Tester. Or you can do that by pressing F6 on your keyboard. The Expert Advisor is placed automatically, the ‘Symbol’ as well.

    opening Strategy Tester in MetaTrader
    How to open Strategy Tester in MetaTrader

    Then on the ‘Model’, we have 3 options: Every tick, Control points, and Open prices only. Now, the model depends a lot on how the Robot or the Expert Advisor was coded. So in our case, I will select Open prices only because the Bitcoin strategy works on the opening of the bar.

    Select the model for the Bitcoin trading strategy backtest
    Select the model for the Bitcoin trading strategy backtest

    And then below we have the period. You can uncheck the ‘Use date’ if you don’t want to use the period but you want to backtest the robot on the complete historical data you have. I will show you the difference in a second. For the moment, I will just check it and I will start the backtest from the 1st of January, 2018, right until the current moment.

    Select the date range for the Bitcoin strategy backtest in MetaTrader
    Select the date range for the Bitcoin strategy backtest in MetaTrader

    Then we have on the right side the ‘Period’. This Bitcoin strategy works on the daily chart, so leave it to ‘Daily’ and the ‘Spread’ is ‘Current’. With the broker I have selected, it is actually fixed at $30 so doesn’t really matter if I will leave it to ‘Current’ or I will write $30.

    Setting the Period and Spread for the Bitcoin strategy backtesting
    Setting the Period and Spread for the Bitcoin strategy backtesting

    And then I will just click on Start and that’s it. It’s ready. It works that fast with such a Robot on a daily chart.

    Results from the Bitcoin strategy backtest

    I will click on the Results then, and you will see all the trades that were executed from the very beginning. So this account starts from $10,000.

    Backtesting results from the BTC strategy
    Backtesting results from the BTC strategy

    Actually, if I go back to Settings and if I go to Expert properties, this is where you can set the initial deposit. By default it’s 10,000. It’s alright to leave it there.

    Setting Initial deposit in the Expert properties
    Setting Initial deposit in the Expert properties

    And then in the ‘Results’, we can see that the balance starting from the 10,000, went up until $70,000. Right? If I click on the graph, I will see how the equity line looks like.

    The equity line from the BTC strategy backtest
    The equity line from the BTC strategy backtest

    And then on Report, we can see a lot of statistics like consecutive wins, consecutive profits, we can see percentages for long positions, short positions, relative draw-down. It’s a lot of things here that I’m not going into details about.

    Bitcoin strategy backtesting report in MetaTrader
    Bitcoin strategy backtesting report in MetaTrader

    But the most important is the graph. You want to see a profitable backtest in order to use the Bitcoin trading strategy for real trading. Right?

    Or the best thing actually, is backtesting the Bitcoin strategy, see if it’s profitable on your broker or not. If it is profitable, then you test it on a Demo account to ensure yourself that it’s alright to use that Bitcoin trading strategy. After that, when you feel comfortable, you can test it, if you decide, on a live account.

    So this is the Bitcoin backtesting on MetaTrader. It works really fast. If I uncheck the starting date, I will perform a backtest for the complete period. In this case, we have Bitcoin backtest data starting since 2014. So let’s see the graph in this case.

    All-time equity line for the BTC strategy
    All-time equity line for the BTC strategy

    It’s just going near the flat because there was not so much volatility during this time until 2017, 2018. So from Use date, one more time, you can select a starting date and this is useful if you want to backtest the Bitcoin trading strategy to the robot for the last few months, for example.

    Using Visual mode in Strategy Tester

    Below we have the Visual mode which is quite interesting when you do it for the first or the second time. I usually don’t use it, but I will show it to you. So if I click on Start, a new tab will open, and simply, you will see all the trades opening and closing.

    Visual mode in the Strategy Tester tool
    Visual mode in the Strategy Tester tool

    So when we have a red arrow, it is a short trade, when it’s a green one, it’s a long trade. And then it shows where the trade was opened and closed and I can increase the speed a bit, here it is.

    So it will visualize the Bitcoin strategy backtest a little bit faster. You can see this is back in 2019 when the price was at about 3,000, 4,000, 5,000, 7,000, 8,000, 9,000. And still, the Bitcoin robot works very nicely. So the Visual mode is just for you to have an idea of how the Bitcoin strategy backtest works or where the trades were opened and closed.

    Compare Bitcoin backtesting results in MetaTrader and EA Studio

    Now, very interesting here is to compare these results or this Bitcoin backtesting graph that ended at about $70,000, starting from $10,000 with the strategy builder Expert Advisor Studio.

    So here is the Bitcoin strategy and you can see that the balance chart is just the same. Here, the window is very small, that’s why it looks a little bit different. But it’s actually the very same thing on MetaTrader. We see it in a huge wide window, that’s why it looks like that. But if I minimize it, you will see that on EA Studio, we have the very same Bitcoin trading strategy backtesting.

    Bitcoin trading strategy backtesting chart in EA Studio
    Bitcoin trading strategy backtesting chart in EA Studio

    And actually, to make sure that the results are similar, you need to change the Symbol Settings in EA Studio.

    So what you need to do is click on Data, and then you have Symbol Settings. And right here you need to enter the spread, you need to enter the swap long, and the swap short.

    Setting the Symbol Settings in EA Studio
    Setting the Symbol Settings in EA Studio

    So if I go to the MetaTrader one more time, I will right-click on Bitcoin, and on the ‘Specification’ tab, we can find how much the swap long is and how much the swap short is. It is in percentage, keep that in mind. So -20 for keeping a long position overnight and 7.5 interest rate on a yearly basis to keep a short trade. And this is what I have selected on EA Studio, swap type, interest rate, or percentage. And then we have the swap long, swap short.

    Bitcoin contract specifications in MetaTrader
    Bitcoin contract specifications in MetaTrader

    So in Symbol Settings you need to set the very same swap long, swap short, spread, how many digits. Basically, all the settings you get for the Symbol from your broker so you will have an identical Bitcoin trading strategy backtest.

    Conclusion

    EA Studio, one more time, is for more professional analysis where we have Monte Carlo, Multi Market, Out of sample simulation, we have a huge report right here, we have profit and loss in currency by entry hours, by exit hours.

    A lot of statistics are useful when creating a trading strategy. As well as the Indicator chart where we clearly see all trades opening and closing, the Balance chart, the Journal, and a lot more.

    But if you don’t want to go into details with EA Studio and you just want to backtest the BTC trading strategy on MetaTrader, this is how you can do it. It’s super easy and you will see if this strategy actually brought you profits with your broker or not.

    If it brought you losses, then probably choosing a different broker is the better solution. Maybe the spread is bigger with the broker and that’s why the Bitcoin trading strategy might show losses with you. I don’t know. If you have that issue just let me know. I will help you out. But you need to see a profitable backtest with the strategy.

    The backtest is very important before you start testing an Expert Advisor. And don’t hesitate to do it. We’ll see you, guys, in the next lecture. Take care.

  • Bitcoin Trading Strategy for Beginners

    Bitcoin Trading Strategy for Beginners

    In this lecture, I will share with you a simple Bitcoin trading strategy for beginners and I will explain what is the idea of this BTC strategy. You will see how simple it is. Moreover, I will show you how it’s proven, I will show you what is the backtest of the strategy, or in other words, I will show you all the entries and the statistics for this Bitcoin trading strategy. So you will be really surprised by how one simple Bitcoin trading strategy could be so profitable and easy to apply.

    Bitcoin trading strategy example

    So this is the Bitcoin on the hourly chart, and for beginners, this means that one candlestick or one bar represents one hour time. Whenever we have a green candlestick, it means the bar is positive or the hour is positive, when we have a red one it means it is a negative bar.

    It opened at one price and then it closed the hour on a lower price and it formed a negative candlestick. With the positive candlestick, it’s the very opposite thing. It opened at one price, went up and down during the hour, and it closed at a different price. So it formed a positive candlestick.

    Now, the Bitcoin trading strategy that I will show you applies on a daily chart. And if I zoom out the chart, you will see that Bitcoin recently after the drop in May 2021, it’s been not easy for trading because it’s just going sideways, up and down.

    And if you don’t have a strategy such as the one I will show you, it is really hard to decide when you have to buy, when you have to sell, and many people lose their money exactly on such market conditions.

    Bitcoin price drop in May 2021
    Bitcoin price drop in May 2021

    Using the Moving Average trading indicator

    So now I’m on the TradingView website, on a daily chart, which means that one candlestick represents one day time. And again, we have positive and we have negative candlesticks.

    Here is the Bitcoin trading strategy. I will add an indicator called Moving Average. And those of you who have experience in trading know this strategy for sure. Moving Average is probably one of the first indicators out there at its super easy to apply it and use it.

    I will navigate to Indicators and start typing Moving Average and I will click on the indicator. And what happens, I see one line over the chart and this is exactly the Moving Average.

    put moving average indicator in the bitcoin day trading strategy chart
    Put Moving Average indicator in the Bitcoin day trading chart

    So for this Bitcoin trading strategy, I will click on the Moving Average or on the line, and I will go to More (the three dots), and I will click on Settings.

    changing Moving Average settings
    Changing the Moving Average settings in TradingView

    So here I will tap on Inputs and I will set the length to 5. Later I will tell you why I know this is the number I need to use. And then in Style, I will just make it probably red to be more visual.

    Setting Input values for Moving Average indicator
    Setting the Inputs for Moving Average indicator

    So what is the Moving Average doing? It makes the chart smoother. You can see the prices going up and down, but when we have a Moving Average, we see clearly a direction.

    The Moving Average line in the Bitcoin day trading strategy
    The Moving Average line in the Bitcoin day trading strategy

    And if I scroll earlier when the market was very bearish, back in May 2021, you can see a very clear direction with the Moving Average. It was falling, then it was rising, then it was falling. So the Moving Average makes the trading chart very easy to read. You just have a line that follows the price.

    crypto market in May 2021
    The crypto market was very bearish back in May 2021

    What is the Bitcoin trading strategy?

    We have a buy signal whenever the daily candlestick opens above the Moving Average.

    So, for example, in our Bitcoin trading strategy, the positive bar from the bottom image opened below the Moving Average, but the next one opened above the Moving Average. So here is our buy signal or our entry where we have to buy Bitcoin.

    the positive bar from opened below the Moving Average, but the next one opened above the Moving Average
    The buy signal from the Moving Average

    Now, let me place a circle on the trading chart and I will put it on the opening of the bar. This is a red candlestick, which means that the opening is on the top of the body of the candlestick. And if I put the mouse on it, you will see exactly the 4 values – open, high, low, and close. So the opening of this candlestick, for example, was at 37,388.05.

    View the values of the candlestick in Trading View
    View the values of the candlestick in Trading View

    So let me zoom in on the Bitcoin trading strategy chart so you can see it clearly. We have the entry on the opening of the first candlestick that opens above the Moving Average. So the price was below the Moving Average, it went above, and on the next candlestick, on the opening, we have the entry.

    Now, what happened very shortly after that, in 2 days time, the price went below the Moving Average and it opened below. So what we do here, we have to sell. And you will say, ‘Alright, but this will be a loss.‘ We’ll be buying approximately at 37,376 and selling it at 35,597. And yes, that’s true. If we buy where’s the green circle and we sell it over where’s the red circle, this will be a losing trade. But stay with me because we will eliminate such trades. And let’s follow along.

    example of losing trade in the Bitcoin trading strategy
    Example of a losing trade

    Then the price went up and then it went down. When it went up, you will see on the bottom image that we have a new bar that opened above the Moving Average. And then when the price went below on the opening of this bar, we have the sell signal. Is that right? That’s right. So, again, we have a loss. And I selected these examples because I wanted to explain the Bitcoin day trading strategy.

    Another example of losing trade in Bitcoin trading strategy
    Another example of losing trade

    It is that simple. And I wanted to show you that there are actually losing trades.

    If I keep doing that you will see that we have more losing trades. And why is that? This is because we are in a downtrend.

    And if you zoom out the Bitcoin trading strategy chart, you will see clearly the price going downwards from the mid of April. Before that, it was going upwards. And if you zoom the chart when the price was going upwards, you will see something totally different.

    We have the entry signal whenever the price breaks the Moving Average with a period of 5, and on the opening of the first candlestick, we have the entry. And then where is the exit? It’s right over here, with this candlestick. I will make it red. So here is the entry, here is the exit. We buy at somewhere 18,800 and we sell at 22,700.

    Bitcoin trading strategy example while market was in uptrend
    Bitcoin trading strategy example while the market was in uptrend

    Then we have a small losing trade that opens where we should be buying at 23,800 and sell it at 23,200. But then when the candlestick opened at 23,700 and something, our exit is way up higher. I will show you exactly where it is on the Bitcoin trading strategy image below. So we would be buying at 23,700 and something and sell it at 38,200. So you see what a profitable trade is over here.

    Another example of a winning trade

    Are we in an uptrend or a downtrend?

    And now comes the question, how do we filter if we are in an uptrend or we are in a downtrend? In the Bitcoin trading chart, you can see the price going downward. So you will be having some losses. And then again, you will have some amazing trades.

    And if I have to be precise, right over here, we have the bar that opens above the Moving Average at about 35,500, and we should be selling it at about, what is it? $54,000 and something. So you see how the Bitcoin day trading strategy catches these nice movements.

    winning trade from a Bitcoin trading strategy
    Another winning trade from the Bitcoin trading strategy

    But how do we filter if we are in an uptrend or we are in a downtrend? Simply, I will put one more indicator which is Moving Average, but with a period of 50. I can choose whatever color I want, but I will just make it dark red. And you can see that this 50 Moving Average shows the direction of the trend for this Bitcoin trading strategy for beginners. And when the 50 Moving Average goes upwards, only then we are buying using the 5 Moving Average.

    the direction of the trend in the Bitcoin trading strategy
    The second Moving Average shows the direction of the trend

    So if I scroll the chart again to the right side, you will see that the 50 Moving Average after the beginning of May changed its direction downwards. So all of the losing trades at that time, we are not buying them because the 50 Moving Average is showing a downtrend.

    The 50 Moving Average showing the Bitcoin downtrend since May 2021
    The 50 Moving Average showing the Bitcoin downtrend since May 2021

    And the two Moving Average lines look different very because they are calculated based on different periods.

    The 50 Moving Average uses the last 50 days, or if I have to be precise, the closing prices of the last 50 days, and it summarizes them and then divides them by 50. So it gives us the average price for the last 50 days. And the 5 Moving Average uses the average closing price of the daily candlesticks of the last days. This is why the 5 Moving Average goes closer to the price, while the 50 Moving Average is lagging after the price but it shows clearly the trend.

    You can see it very clear that for some time the price was going down and then from 9th of October, 2020, when the price was at about $11,000, very clearly, we are in an uptrend up until May 2021 when the 50 Moving Average changed its direction downwards.

    So if you are using an exchange and you want to use this Bitcoin trading strategy, all you have to do is look for the 50 Moving Average to be rising in order to look for the entry signals when we have the price going above the 5 Moving Average or to look for a candlestick that opens above the 5 Moving Average and then to take the profit when it goes below the 5 Moving Average.

    And then you can see that we will be taking profits many times.

    Taking profits from a simple Bitcoin trading strategy
    Taking profits from the simple Bitcoin trading strategy

    Using the Bitcoin trading strategy when 50 Moving Average goes down

    You might say, ‘OK, but when the 50 Moving Average is going down, we are not doing anything and we are not trading.

    The thing is, you can be trading when the price is going down with the trading brokers. Some crypto platforms allow that but with simple words, it is called CFD or Contract For Difference. I will explain how it works very shortly.

    Let’s imagine that we sit on the computer on the 17th of June 2021, and we see that we have a bar that opens below the 5 Moving Average. At the same time, the 50 is going down which means we have a confirmation to sell. And instead of exit, this is our entry or this is where we will be selling Bitcoin vs. USD and we will be taking our profit on the first bar that opens above the Moving Average, which is right you can see on the bottom image.

    The first bar that opens above the Moving Average
    The first bar that opens above the Moving Average

    So we will be selling it here and we will be taking the profit right over here, which is a move of $4,000 and something. So when the 50 Moving Average goes down, we can sell the Bitcoin and make a profit on a lower level.

    And for beginners, I know it’s complicated. You might ask immediately how I’m selling the Bitcoin if I didn’t buy it previously. This is the CFD trading, which stands for Contract For Difference.

    So some brokers allow that. And there, you can fund an account. Let’s say you fund an account with $50,000, for example. You can sell one Bitcoin, and when the price goes down, you can close the position and benefit from the difference. This is why it’s called CFD trading. Of course, if the price goes against you, then you will be handling losses in your account. It’s very similar to short-selling in stock trading.

    So simply put, you are trading on the value of the asset and you are not owning the Bitcoin at this time. You are owning Bitcoin only when you buy it from the exchange or from the wallet and you keep it in your crypto wallet and you have it.

    When we are trading with the Expert Advisors, we are doing both. We are buying it and we are selling it. So we are trading all the time. We are taking all of the opportunities out there.

    Bitcoin trading strategy overview

    So to summarize it, I don’t want to make the lecture complicated because it’s really a simple Bitcoin trading strategy. But I tried to explain it as simpler as possible.

    When the market is going up, we follow the 50 Moving Average to confirm that we are in an uptrend. Then we are buying using the 5 Moving Average. And when the market is going up, you can use exchanges to buy Bitcoin and sell it at a more expensive price to get some profits. At the same time, you can use the brokers with the CFD trading that I explain.

    Now, when the market goes down, we can sell using the same Bitcoin trading strategy, but we can do that using CFD trading and we are taking the very same signal but on the opposite side. When the bar opens below the 5 Moving Average, we are selling it. And when another bar opens above the Moving Average, we are closing the position to take the profit.

    So when the market is positive, you can apply this Bitcoin trading strategy easily on the exchanges and with the brokers. And when the market is negative, when we are in a downtrend, you can apply this strategy with the brokers and the CFD trading.

    And, one more time, some of the crypto platforms allow selling the Bitcoin even without owning it previously.

    How to check the BTC trading strategy performance in the past

    So how do I know if this Bitcoin trading strategy is actually profitable or it’s losing? Is it making money in the long-term or is it losing money?

    In trading, and especially when we use strategies and Expert Advisors or the so-called robots, we have the backtest. The backtest shows us what is the performance of a certain trading strategy in a past period.

    And there are a variety of tools, platforms, where you can perform backtests. You can do a backtest on MetaTrader as well. But what I use as a professional trader, and because I do this full-time for quite a long time now, I use professional software.

    And before I show it to you, I know many are wondering, ‘OK, why do we need to have a backtest and the software, is a simple strategy? It’s very clear where we buy, we have the confirmation of the 50 Moving Average, we have the 5. We see over the chart where the entries are very clear.

    But wait, maybe somewhere in the chart, we have an opening below the 5 Moving Average? If I zoom in, it really looks like the candlestick on 8th February 2021 opened below the 5 Moving Average. The entry is there and I said that the exit is when we have a candlestick opening below the Moving Average.

    Moving Average value on the closing of the trading day
    Moving Average value on the closing of the trading day

    And if I put the mouse on it, you will see that the opening of the candlestick is 38,795.69, and the 5 Moving Average is 39,916.88. So the opening is below. But pay attention here, this value for the Moving Average is on the closing of the day, not on the opening.

    So I don’t know, actually, looking at the chart, what was the Moving Average value at the opening of the candlestick at the beginning of the day.

    The same thing with the below recent example where I said we can sell the Bitcoin. On the 24th of June, we have the sell. Very clearly, the candlestick opens below the Moving Average, the price goes down, and there is the exit. But what about the candlestick on the 21st of June? Did it open above or below the Moving Average?

    The opening is at 35,617, and the 5 Moving Average value is 35,321.12 which shows that the opening was above the Moving Average. Because if it’s above, we should be closing the trade here and not 3 days later. But again, this value for the 5 Moving Average is on the closing of the day and not on the opening. So again, I don’t know when this candlestick was starting and what was the value of the Moving Average.

    And this is why looking back over the chart this way could be really misleading when you are using indicators. And many traders and mentors are building their strategies, recording complete courses and videos over the chart and saying, ‘Oh, you should be buying here, you should be selling there, buying here, selling there.

    That is completely wrong because the indicators are repeating. They are lagging behind the price and especially when we have a small Moving Average like 5, the value of the Moving Average changes all day long.

    So at the current moment, by the time I am recording, we can see that the price is 34,556.75, but it’s changing. It was one value at the opening of the day and it will be a completely different value at the closing of the day because it’s changing.

    When the day closes and the new candlestick starts, then we will have a confirmed value, just like what we have with the candlestick from the 21st of July. The confirmed value for the Moving Average is 35,321.12, but this is after the day closed.

    And this is where a lot of traders make a huge mistake building strategies based on what they see in the past. Because in this example, we don’t know what was the value of the Moving Average when this day was opening.

    The backtesting software

    So let me show you the software and you will get a better idea of what I’m explaining.

    I will go to our website, and in the menu, you can see Software. And here, we have 3 trading software integrated – Expert Advisor Studio, Forex Strategy Builder, and the Historical Data app from where you can download free historical data for any asset.

    It’s useful when you’re doing backtests, it’s useful for many things. You can download the data completely free. No registration is needed, no strings attached, nothing. You can download the data for many assets. We have as well Bitcoin and Ethereum here, commodities, indexes, Forex pairs, and you can download it in different formats as well.

    But what I want you to focus on is the Expert Advisor Studio because this is where I will show the strategy.

    EA Studio is professional trading strategy builder software. There is a free trading course for the software on the front page that I have recorded. And personally, I’m using this software daily. It comes with 15 days free trial if you want to give it a try, generate strategies, backtest strategies, and export them as ready robots.

    So basically, this is the idea of the software. I’m not going into details. It’s not the purpose of the lecture. I will click on Strategy and you will see exactly the BTC trading strategy I’m talking about in this lecture. The idea of the software is that with one click, we can export it as a ready-to-use Expert Advisor for MetaTrader 4 and for MetaTrader 5. Or in other words, with one click, we can have the robot, the code for the robot.

    Bitcoin trading strategy in EA Studio
    Bitcoin trading strategy in EA Studio

    So we don’t need to hire developers, we don’t need to understand programming, the software does it really automatically with one click. And it’s much more for the software, but, one more time, not the purpose of this lecture. I’m not going to explain it in detail, there is a free course on the front page which you can have a look at if you are interested.

    Backtesting the Bitcoin trading strategy

    Now, what I want to show you here is the Bitcoin trading strategy that I have explained so far.

    So we have the entry conditions here. You can see that we have Moving Average with a period of 5, with the condition, the bar opens above Moving Average. And if I change the period, for example, if I increase it to 6, immediately, I see the difference in the balance chart. Let’s increase it to 20, you see that there is a difference. Actually, the BTC trading strategy became worse.

    So I’ll bring it back to 5, I’ll click on Accept. And actually, the Balance chart is the result or the backtest of the Bitcoin trading strategy. And you can see that the backtest shows that the strategy was profitable so far.

    The first Moving Average from the Bitcoin trading strategy
    The first Moving Average for the Bitcoin trading strategy

    And if I click on Edit again, you will see that this data is from 2018 until the moment. I’m looking usually at the last 2-3 years, not going back before 2017 because the market was totally different. And you can change the data period actually from the Data menu.

    Market info in EA Studio
    Market info in EA Studio

    Now, in the second place, we have the second indicator. Again, Moving Average with the condition rises and you see that the period is 50. So again, if I change it to 60, you will see that there is a difference, getting worse.

    The second entry indicator for the Bitcoin trading strategy
    The second entry indicator for the Bitcoin trading strategy

    So obviously, with time, I have played around with the BTC trading strategy a lot to find the best values. Moving Average of 5 with the condition the bar opens above Moving Average and the condition for 50 Moving Average where we need to see rising, works best for me and for the current market conditions.

    And these conditions where we want to see the bar opens above the Moving Average and the Moving Average rises are for the Long entry or when we are buying the Bitcoin.

    For the short entry, when we are selling it, you can see the very opposite. The bar opens below Moving Average and the Moving Average falls.

    Short entry conditions for the BTC trading strategy
    Short entry conditions for the BTC trading strategy

    And below we have the exit conditions. So we exit the trade when the bar opens below Moving Average. And this is for the Long exit, one more time.

    Exit conditions for the BTC trading strategy
    Exit conditions for the BTC trading strategy

    Entries and exits in the BTC trading strategy

    Now, here is the magic. I will click on the Indicator chart and you will see all the entries and exits very precisely. The strategy building software shows us exactly where were the Long entries and where were the Short entries with the Bitcoin trading strategy. Or in other words, when we have green below, this is the Long entry. And you see that when the 50 Moving Average starts to decline, we have only Short entries.

    EA Studio Indicator chart showing the entries and exits in the BTC trading strategy
    The Indicator chart shows the entries and exits in the BTC trading strategy

    You can see it in red below the chart when we have the short trades or when we are selling the Bitcoin. And you can see it in green when we are buying the Bitcoin. So here you can see very visually where are the trades.

    And below you can see the example, that I have pointed out. So you can see that with this long candlestick, let me go back to Trading View.

    Comparing a candlestick in EA Studio and Trading View
    Comparing a candlestick in EA Studio and Trading View

    And it really looks like the opening of the bar was below the Moving Average. But if we look at it in the Indicator chart where we have the backtest on EA Studio, you see that we are still in the long position or in a buy trade up until this moment. So there was no exit at this moment.

    And the strategy builder software is accurate because it has the full values of the opening, the high, the low, and the close for every candlestick right there. This is called the historical data which I have mentioned earlier. And when I move the mouse through the candlesticks, all the values change below.

    Entry moment in the BTC trading strategy

    And actually, you see from the image below that I was wrong for this entry moment in the BTC trading strategy. It was a bit earlier right another candlestick.

    Entry for a trade in a BTC trading strategy
    Entry for the trade was a bit earlier

    So we have the price below the 5 Moving Average and the first opening was right over there. But anyway, that’s the entry we talked about if you missed the first one. You see the price below and then going up.

    But one more time, EA Studio software knows exactly where were the entries and the exits. And this is why using a trading robot is the best option for me because even if I miss an entry, the robot will not miss it. It will enter the market exactly and precisely. And it won’t be late with the trades, with the entries, and with the exits.

    And if I scroll more through the Bitcoin trading strategy, you will see so many trades that opened and closed. You will see clearly that when the 50 Moving Average goes down, we open just short trades. When it goes up, we open long trades.

    And it’s not just the Indicator chart. We have a Balance chart where we see the performance of the BTC trading strategy with some more statistics.

    The Balance chart for the Bitcoin trading strategy
    The Balance chart for the BTC trading strategy

    In the Journal, we can see exactly all the trades starting from 2018. I selected that period of time for the backtest one more time, but you can see exactly where the trade was opened, at what price, and what is the result. Was it a losing trade or a profitable one?

    Different days trades from the Bitcoin trading strategy
    Different days trades from the Bitcoin trading strategy

    And like every trading strategy out there, there will be losing trades. Even if we use the filter of 50 Moving Average to show us where the trend is going, remember that there will be losing trades. But at the end of the day, what matters the most is to have profitable trades from the Bitcoin trading strategy. And, of course, when the market is volatile, and when there are nice, huge movements, there will be more profits.

    You can see that recently, in 2021 when the market was extremely volatile. You see a profit of $3,000, then 2 negative trades, then another $2,000 of profit. And here is a great profit of $17,000 that the strategy took.

    17019.62 profit from a short position trade in the Bitcoin trading strategy
    17019.62 profit from a short position trade in the Bitcoin trading strategy

    Let’s have a look at this trade. So it was a short position at 55,827 on the 11th of May 2021. When the market turned negative, this trade over there brought a great profit with the BTC trading strategy.

    The profitable trade in EA Studio's Indicator chart
    The profitable trade in EA Studio’s Indicator chart

    So this is why I’m using the software EA Studio to show me a realistic backtest to know exactly where the trades happened and not to be misled by looking just at the chart with the Moving Averages.

    I explained that the indicators are repeating. You can read much more about the repeating over the Internet. And, one more time, many traders do the mistake to build trading strategies based on just what they see, but this is wrong. You need to have professional software. I mean, you don’t need to have it. I need to have it as a trader who builds strategies and uses trading strategies daily.

    How to apply the BTC trading strategy

    To apply this simple Bitcoin trading strategy, you don’t need to have the software because you already have the robot, the ready-to-use code, and the Expert Advisor for this strategy attached to the Simple Bitcoin Trading Strategy course.

    So this is how I know that this BTC trading strategy works great. I’ve been using it for quite a long time and it worked really perfectly, catching some great moves on both sides when the market goes up when the market goes down.

    And of course, I keep an eye on the strategy. I have a lot of tools in EA Studio like Optimizer, Normalizer, Walk Forward, Monte Carlo, which I won’t talk about in this lecture. But I use these tools in the software to modify and improve the BTC trading strategy so you always have the latest version in the course. And of course, if I modify it, I’ll let you know and you will be able to download it.

    So these were the parameters and the values for this simple Bitcoin trading strategy for beginners. Moving Average of 5 and Moving Average of 50 is what I’m using at the current market conditions for Bitcoin. And if you have any questions, let me know in the comments below. I’ll be super happy to assist you.

    And in the course, I show how actually you can trade with this robot and with this simple Bitcoin trading strategy, and I give some tips as well if you want to use the strategy for investment purposes.

    Thank you for reading. We’ll see you right in another lecture.

  • Markets.com Review – How Safe Is The Broker?

    Markets.com Review – How Safe Is The Broker?

    In this broker review, we will look at Markets.com – a regulated trading broker which offers access to over 2,200 trading instruments and several different trading platforms. We will review the trading assets offered by the broker, different types of fees, the account types as well as the unique features that Markets.com offers to its users.

    Introduction to Markets.com

    Markets.com is a CFD and Forex broker that has offices in Cyprus and several other countries. It has been in business since 2008 and serves clients through two platforms, which focus on CFDs and investing. This Markets.com review will explain how this brokerage works, so you can know whether they’re the right fit for you.

    Markets.com is highly regulated, with authorization in the UK, EU, Australia, South Africa, and the BVI. Their strategic authorization in different geographical regions allows them to do business with traders from a large number of countries. It’s very likely that you’ll be able to open an account there, whether you’re in the Caribbean, or in Europe, and this Markets.com review will explain how you can do that.

    review of Markets.com website
    Markets.com website

    The regulations in some countries prevent the broker from providing its services in those areas. These are a few of the countries where citizens or residents cannot open accounts:

    • Japan
    • Canda
    • Belgium
    • The USA

    Your capital receives a high level of protection while it’s in your account and as you execute each trade. This trading broker meets the requirements for trading that are set by the:

    • Financial Conduct Authority (FCA) in the UK
    • Cyprus Securities and Exchange Commission (CySEC) in Cyprus
    • ASIC in Australia
    • FSCA in Sounth Africa
    • FSC in the British Virgin Islands

    It provides a wide range of assets to traders and investors, through its Marketsi platform and Marketsx, so you can diversify your portfolio while utilizing trend-following strategies. Marketsx is for trading CFDs and Forex while Marketsi is the platform for investors.

    If you wish to trade real stocks, you can use its Marketsi platform, benefitting from regulatory standards established by CySEC. Both platforms are designed to be intuitive and are supported by robust technology. As we will explain later in this Markets.com review, both platforms can also be used on your smartphone, so you can trade or invest on the go.

    Since this Markets.com broker review is primarily meant to be of interest to Forex traders, it will be focused on the broker’s Marketsx platform.

    Traders should carefully consider whether they understand how CFDs work before using the platform since these arrangements carry a high level of risk.

    Markets.com recently changed its fee structure, so the prices are usually in the same range as those of its competitors. There’s no commission on Forex transactions but profits are made off the spread. The EUR/USD is charged at 0.7 pips for most accounts.

    European Union regulations require companies to report the number of retail accounts that lose money while trading CFDs. In the EU, Markets.com does business through Safecap Investments Limited Equity, and in accordance with CySec’s rules, it reports that 70% of its retail accounts lose money by trading its CFDs. This is better than the industry average of around 80%.

    It’s easy to open an account on Markets.com. The entire process is digital and your initial minimum deposit is low. They also offer a demo account, so you can become familiar with the platform before you start trading.

    Markets to Trade

    Through its platforms, Markets.com offers several of the more popular products among traders, including:

    • ETFs
    • Forex
    • Stocks
    • Blends of CFD funds
    • Bonds
    • Crypto

    You can trade 60 ETFs, including the ChinaCSI300. Their ETFs give you access to markets that are usually out of reach. They cover stock market sectors, commodities and indices.

    Their leveraged ETFs provide multiples of the underlying assets that are being tracked and you can take a position on a broad market trend by utilizing ETFs. This alternative provides savings by combining multiple trades into one, thereby lowering your dealing costs.

    Regulation

    While Markets.com doesn’t hold a banking license, it’s regulated by many financial authorities around the world. The complete list of regulatory authorities was mentioned earlier in this Markets.com review and includes CySEC and the FCA.

    CySEC and the FCA are highly regarded in the Forex sector. They’re known for establishing standards that ensure traders can operate in a safe setting. Even if you’re in a country where there’s not a top-tier regulator, there are still standards that Markets.com must meet because of this relationship via its subsidiaries.

    regulation stamp

    Its parent company, Playtech, is listed on the London Stock Exchange (LSE). All companies that are listed on the LSE are required to maintain a high level of transparency. If there are financial issues within the company, they can be detected early.

    Markets.com offers negative balance protection, so your trading losses can never exceed the funds that you have in your account. In this Markets.com review, we’ve stated that trading CFDs carries high risk. However, negative balance protection limits the amount of money that you can lose.

    Most Markets.com users receive investor protection. If the brokerage goes bankrupt or commits fraud, you’ll get most of your capital back. In fact, some investors will get all of their capital back, if the sum in their account was less than the maximum limit that was legally protected.

    The amount of investor protection that you get depends on where you reside and which subsidiary of the company you sign up with. For example, if you live in the UK, you’ll sign up with Finalto Trading. You’ll be trading in accordance with the investor protection level that’s set by the FCA. This is £85,000.

    Investor protection will be offered to you no matter where you live in the UK. However, it’s not available to residents of all countries. If you live in a country where the regulators are the FSC or ASIC, you won’t have any protection.

    Markets.com Fees & Withdrawals Review

    When you open an account at Markets.com, you may have to occasionally pay non-trading fees but you’ll regularly pay trading fees. Non-trading fees are fees that aren’t directly linked to trading.

    Markets.com does well with its non-trading fees and rarely charges traders anything in this category. In this review, we found that no fees are charged for withdrawals, deposits, or maintaining an account at Markets.com.

    However, if you don’t trade frequently or also use other brokerages, be wary of having your account become inactive because that will attract an inactivity fee. Your account will have to be inactive for at least three months before it will attract an inactivity fee. After that period, you’ll have to pay $10 for each month that you remain inactive.

    As stated earlier in this Markets.com review, you won’t be charged for deposits. However, like some of their competitors, this brokerage does have a minimum sum that you can deposit and this is $100 or EUR 100. You can make the deposit by using your electronic wallet, credit card, or debit card.

    Once you decide to enter a trade, trading fees will come into play. Different types of trading fees are applied to each kind of transaction. These fees include the following:

    • Commissions
    • Conversion rates
    • Financing rates
    • Spreads

    Commissions are applied by using the base currency that you’ve selected, so if your base currency is Euro, commissions will be charged as Euro. This is calculated at the prevailing market rate.

    These small commissions are only applied to stock CFDs. They won’t be applied to other transactions. For example, if you’re trading Forex, you won’t be charged a commission. The commission on stock CFDs is applied to both sides of the trade.

    CFT Trading image

    This commission is $10, applied when you enter the trade and $10 applied when you exit, so in all, you’ll pay $20 in commissions. This is converted to Euro if your base currency is Euro. You’ll also pay a spread on each share you purchase.

    Forex fees are built into the spread. These fees are different for each currency pair that you’re trading. Markets.com offers institutional-grade liquidity and that allows them to deliver trading opportunities for a lower cost than some of their competitors. For example, EUR/USD has a spread of 0.7 pips.

    When calculating fees in Forex transactions and for other trades, you’ll also have to consider slippage, which is the difference in price that can occur during a period of high volatility. You may expect to pay a particular sum for a transaction but the prices change and when it’s executed, you’ll end up paying more. Sometimes slippage works in favor of the trader, who ends up paying less.

    Overnight funding charges are usually applied if you have an open position at the end of the business day. These rollover charges are not the same for each instrument. They’ve applied automatically once you have an open position at the end of trading.

    Interbank interest rates also affect your overnight funding charges. You’ll know how much the fee is when it appears on your account at the end of the trading day. In most cases, this fee is applied without notice.

    Account Types at Markets.com

    In this Markets.com broker review, we’ve mentioned that the brokerage has two separate platforms. These are Marketsi and Marketsx. You won’t need separate accounts for each one. The same login details will give you complete access to both, so you can trade Forex and invest in stocks for your portfolio without using two different sets of account credentials.

    The entire process of opening your account is digital and you’ll usually be approved in just one day. You’ll need to supply the same personal information that all Forex brokers require to the regulations.

    This includes your name, ID, and other details that can be used to verify your age, nationality and identity. Any of the following documents can be used for ID verification:

    • National ID
    • Passport
    • Driver’s license

    To verify your country of residence, you can use your bank statement or a utility bill, such as your gas bill. You’ll also be asked to share financial details which are used to facilitate deposits and withdrawals. Any errors at this stage can result in unnecessary delays when you need to withdraw your money, so check everything.

    Markets.com asks all traders to indicate how much experience they have with different instruments. You’ll also have to complete a short quiz that gives more information on your trading knowledge. Remember, trading CFDs is risky and around 70% of this broker’s clients lose money on their trades. While this is lower than the industry average of 80%, it’s important to ensure that you understand how these agreements work, before you put your capital into any of them.

    In this Markets.com broker review, we’ve also mentioned that a demo version is available for new traders or clients who want to become comfortable with using this platform before they use real cash. One account is used for both your virtual and real trading, so check that you’re selecting the right option before you open or close a position.

    You can fund your account by using any of the methods that Forex traders can usually use, including:

    • Bank transfer
    • Credit cards
    • PayPal
    • Fast bank transfer
    • Skrill
    • Debit cards

    The debit or credit card that you use should be on the international Visa network. If you try to use a card that only works in your country, the transaction is unlikely to be completed.

    You can only fund your Markets.com account by using an account that’s in your name. If you’re married and you’ve decided to change your name, the name on your new ID must match the name on your funding account.

    Some funding methods, such as bank transfers, take a few days to be processed. If you want your account to be funded almost instantly, you can use your debit or credit card to make a deposit.

    When you’re ready to make a withdrawal, you can use any method that you choose. The options that are provided for making deposits are also made available for withdrawals.

    In this Markets.com withdrawal review, we want to emphasize the fact that this broker doesn’t charge for withdrawals. It doesn’t matter what method you prefer, you won’t have to pay a fee. This means it’s better to just withdraw to your credit card if you want your cash quickly because you won’t pay for the convenience.

    Withdrawals to credit cards will reach your card in one day. While the broker won’t charge you, other fees may be applied. Check your electronic wallet and other options to ensure that you won’t pay fees on their end. The credit card that’s being used for your withdrawal must be in your name.

    In this Markets.com withdrawal review, we’ve mentioned at least six methods that can be used for both withdrawals and deposits. All of these alternatives won’t always be available at their competitors. You may also be charged a fee for withdrawals or deposits at some other Forex brokers.

    Trading Platforms

    Marketsx is used to trade Forex. When you log on to Marketsx, you’ll see popular trading options on your left, favorites in the middle and positions on the right of your screen. This layout for your tabs helps you to stay organized.

    It supports 11 base currencies, including the following:

    • AUD
    • USD
    • EUR
    • GPB
    • CHF
    • NOK
    • DKK
    • SEK
    Marketsx benefits
    Marketsx benefits

    The array of base currencies helps you to save money. If you fund your account by using the same currency as a base currency that you like, you won’t have to do any conversions when you’re ready to trade Forex. This way, you’ll avoid the conversion fees.

    In fact, you’ll avoid conversion fees once you’re trading any kind of asset by using the same kind of currency that’s in your account. This applies to both Marketsx and Marketsi.

    Marketsi platform features
    Marketsi platform features

    These platforms are user-friendly, which is a definite plus. You can’t use biometric authentication, such as FaceID, so you won’t be able to save time that way., They don’t offer two-step authentication, so you won’t have the option of gaining that extra level of security.

    Their platforms have several features that you’ll find useful, such as price alerts that let you know when the market has reached your ideal criteria. These can be sent to your email address or you can have an SMS sent to your phone. They don’t send you order confirmation alerts.

    Each of their platforms can be customized to an extent. That is, you can choose from several layouts or adjust a few other features. Unfortunately, they don’t offer a lot of customization options.

    A search function is provided, which lets you identify emerging markets ETFs or anything else that you might be interested in. When you type in the first two or three letters of the term, you’ll see every term that’s related to it. That saves time since you can simply scroll down and select the relevant information.

    You can trade via your Android or iOS mobile device. An app is available for each of these mobile devices but if you don’t want to use it, the web version of the platform also works well.

    In this Markets.com broker review, we’ve discussed mobile trading in Marketsx. Markets.com also offers the MetaTrader 4 and MetaTrader 5 platforms for desktop trading. You can customize your charts and your workspaces on these platforms.

    The drawback of using either version of MetaTrader is that the design is a bit outdated. Like Marketsx, it lacks two-step authentication. However, Forex traders can get a clear fee report with either version of MetaTrader.

    Education

    A demo account, tutorial videos and regular webinars help clients to keep on learning more about the Forex market and other trading options. The videos are available on their YouTube channel and the platform.

    Markets.com knowledge center
    Markets.com knowledge center

    Most of the videos range from 15 minutes to an hour in length. For example, videos on trend signals are about an hour-long, while those that give tips on trading are shorter and easier to review when you’re taking a break. You can watch them whenever you choose.

    The platforms use charts, which provide traders with a good experience. If you’re also looking at investing in stocks, only basic news is provided. They also stick to basic information on companies, so you won’t get much insight on what may be happening right then, that might influence price changes.

    They’ll regularly share trading ideas but they won’t always go in-depth on why they’re recommending a particular approach. They do have recommendations from analysts at leading financial institutions, such as Goldman Sachs and J.P. Morgan.

    Special or Unique Features

    The app is available in 25 languages, so you can trade in the language that is perfect for you.

    Clear portfolio reports are available to all clients under the My Account tab. These reports can be downloaded, so you can view them when it’s convenient to you.

    Conclusion – Pros and Cons

    Markets.com makes it easy for traders to deposit and withdraw their money. No fees are charged for either of these transactions.

    You can fund your account or withdraw your profits via several methods, including debit cards, credit cards and e-wallets. Unfortunately, a clear fee report is not available, so you can’t check your swap charges.

    If you’re using the app, you’ll have three types of orders available. These are, market, limit and stop. Trailing stop is not offered.

    Many traders like to have access to research and tools. Markets.com provides interactive charts and ideas to help with each transaction.

    It’s easy to open a trading account and if you like to trade CFDs or Forex, you’ll be able to choose currency pairs and instruments that complement your strategy. However, the Marketsx platform doesn’t currently offer more alternatives than these.

    If you trade infrequently, it’s important to note that this broker charges an inactivity fee. If you’re new to Forex trading or want to see how the platform works before you deposit real cash, their demo account will be helpful.

    Overall, Markets.com has many of the features that Forex traders look for in a brokerage. Doing business since 2008, they’re regulated by top-tier authorities and offer investor protection in some jurisdictions. You’ll have a wide range of products to choose from, including ETFs and all the popular Forex pairs.

    You won’t be charged for withdrawals or deposits and can even find ways to save on each trade, by choosing your base currency to benefit your trading style. It’s easy to open an account online and once you do, free tutorials are available to support your trading journey.